![]()
|
|
|
Weekly - Bullish Conservative Investors - Go To TTD Long-Term Plays - Monday, January 29, 2018 |
|
|
Go to Video Show - "How to Make Money With Breakout Stocks |
|---|

By Leo Fasciocco -- TTD
Ticker Tape Digest presents its daily stock market report containing stocks to go long as Breakout Trades, Quick Trades, or Bargain Accumulation Trades.
We also feature stocks under Significant Accumulation that are poised to breakout.
|
Ticker Tape Digest's Daily schedule guide for TTD subscribers 1. Pre-market - check Breakout Watch List and Quick Trades. 2. Morning - (11:30 - 12 A.M.) - check breakout stocks tape and breakout chart slide show. 3. Midday (1 P.M.) check TTD Midsession Report and see market video show. 4. After close (4 P.M.) check final TTD Report for day. Trading Strategies Bullish Aggressive Investors Bullish - "Breakout Stocks" - ideally suited for bull markets and special situation stocks. Potential for large returns. (See Performance) Aggressive Investor Bullish- "Quick Trade Stocks" -ideally suited for entry into top performing issues looking for a small quick profit." (See Performance) Conservative Investors "Bargain Buy Trades for the Long Term." Ideally suited for entry into top performing big cap stocks on pullbacks within overall up trend.(See Performance) Bearish Aggressive Bearish Investors - "Breakdown Stocks" to Sell Short. Ideally suited for bear markets or market pull backs. Potential for large returns (See Performance) |
|---|
The TTD report also contains stocks to short as breakdown plays and as bargain (swing trade) shorts.
Investors should tend to try to go with a strategy that fits with the stock market's trend, unless there is a special situation play.
TTD's Breakout Stocks - Long are
most suitable for aggressive investors seeking ideal entry points into leading stocks, especially during bull markets. They can do extremely well in bull markets with gains of as much as several hundred percent. 
These stocks can also do extremely well during strong market rallies, or if they are in a industry group that is performing very well. They tend to have strong earnings outlooks and are near new-52 week, or all-time highs.
TTD Quick Trade Stocks - Long These are leading issues that have pulled back in recent days, but could move higher soon. They are most suitable for Aggressive Investors willing to trade short term. These stocks will do extremely well during market advances. They have about 74% win rate. During market rally sequences the win rate is even higher. The return is small 3% to 8% in just a few days.
TTD's Bargain Buy Trades - Long - Long Term. These are for conservative bullish Investors These long-term buys are ideally suited for entry into stocks on pull backs within overall up trend. These stocks can give a good return long-term especially during a bull market.
TTD also presents Stocks To Sell or Sell Short. These issues are suitable for aggressive investors willing to take short positions both as trades or for longer-term plays. These stocks will do very well during bear markets or market pull backs.
TTD's Bearish breakdown stocks to sell short. These issues have potential to fall sharply. They often show a technical breakdown and also some fundamental business problem such as weak earnings.
TTD's multi-media updates include a slide-show that presents charts and analysis at midsession. Some times TTD presents feature analysis on stocks and the market. TTD uses Windows Media Files. (WMV).
TTD also presents a "Breakout Watch List" that is up dated daily. This list consists of key stocks in position to breakout. A close watch of this list can put you in the stock just as it breaks out. A good idea is to study the list and be ready to move into a stock quickly as it hits its breakpoint.
TTD often suggests using stop buy orders to enter. It is very important to buy a breakout stock as close as possible to the breakpoint. The idea is to get "elbow room" if the stock should follow through to the upside. This is very important in being successful in making big money with breakout stocks.
It is also essential to have a stop loss strategy for all stocks in which positions are taken. Not every stock will work as expected. It is important for investors to "police" their portfolios and avoid getting trapped in any bad positions.
Quality rating of breakout Two key factors: 1 - Stock near all-time high in price or near a 52-week high. 2 - earnings growth current year is strong. The ideal play is a stock with an Above Average Quality Rating. The stock is near a new high and will have strong earnings. TTD's other ratings are Average and Below Average.
TTD also has special feature sections on Educational Tips on Investing.
To email Mr. Leo Fasciocco leo@tickertapedigest.com.
For service, email Beverly Owen owen@tickertapedigest.com. TTD’s Tel: 1-480-926-1680.
Thursday - February 1, 2018
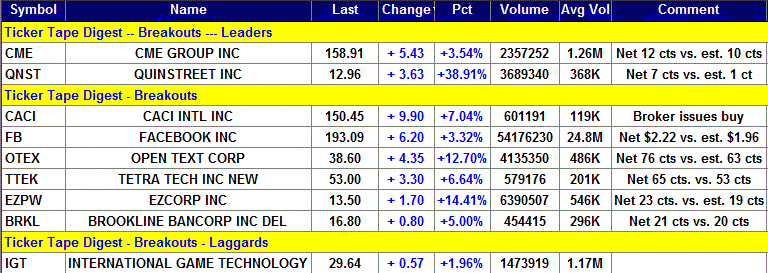
TTD's Breakout Stocks
Stock Market Overview
Total Buy Breakouts so far today - 9
Quality of Breakouts - Average
Stocks Screened - 12,234
Bull side - Medium size list of breakouts, but some interesting plays. Bulls can be venturesome.
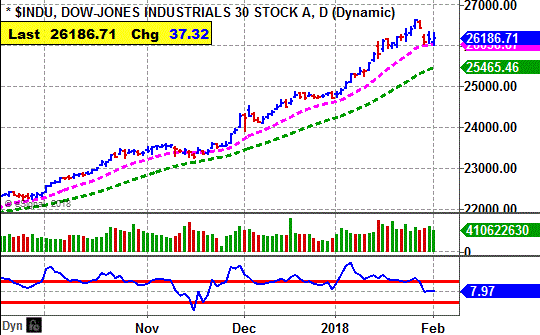
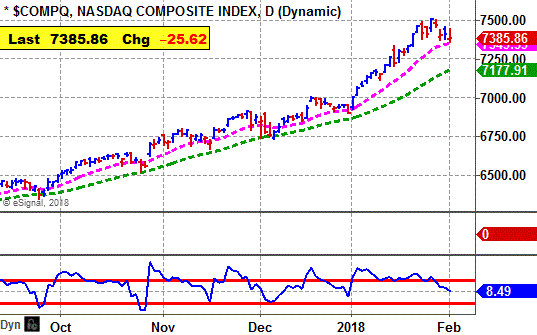
Stock market - Bullish. Major averages remain bullish in all time sectors. However, market needs to be watched closely.
Stock Market Momentum
(Daily is based on a moving average)
|
Market (Daily) |
Market (Weekly) |
Market (Monthly) |
|
Dow - Bullish |
Dow - Bullish |
Dow - Bullish, |
|
Nasdaq - Bullish |
Nasdaq - Bullish |
Nasdaq - Bullish |
|
S&P 500 - Bullish |
S&P 500 - Bullish |
S&P 500 - Bullish |

Ticker Tape Digest's
|
TTD's Quality Rating of Stock - CME - ABOVE AVERAGE |
CME, based in Chicago, operates exchanges trading futures, options and other securities. Annual revenues: $3.6 billion. CME's stock breaks out from a nine-week flat base. 
The move - triggered by better than expected earnings - carries the stock to a new all-time high. That is bullish.
TTD highlighted CME as a breakout at our midsession video show on the Web. 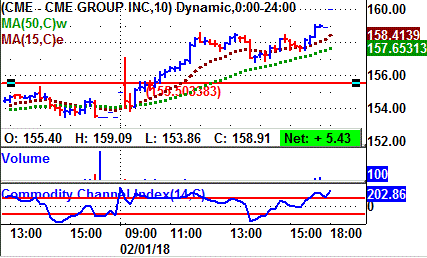
CME is trading 2.4 million shares, about double its average daily volume of 1.3 million shares.
CME reported net for the fourth quarter of $1.12 share. That topped the Street estimate of $1.10 a share.
The stock moved higher in the morning and cleared its breakpoint line.
The move carried the stock to a peak near midday at $158.58.
The stock then trended sideways until late in the session when the stock moved a bit higher to closer near its high for the day.
Tape Action
CME's tape action shows the recent block trades.
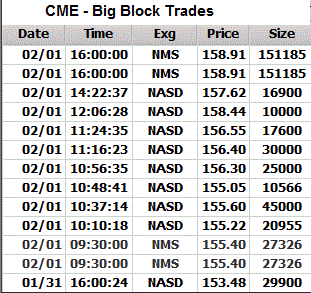 One can see the price for the blocks climbing from $153.48 in the prior session to as high as $158.91.
A key bullish trade came in the morning when a block of 27,326 shares (duplicated) crossed the tape at $155.40.
That was up from the prior block trade at $153.48 on 29,900 shares.
Then near the close a massive block of 151,185 shares (duplicated) crossed the tape at $158.91.
That was up sharply from the prior block trade at $157.62 on 16,900 shares.
Business
CME provides products across all asset classes, including futures and options based on interest rates, equity indexes, foreign exchange, energy, agricultural products and metals.
The company's operations consist of the Chicago Mercantile Exchange Inc., Board of Trade of the City of Chicago, Inc., New York Mercantile Exchange, Inc. and Commodity Exchange, Inc.
CME company provides electronic trading around the globe on its CME Globex platform.
The Company also offers clearing and settlement services across asset classes for exchange-traded and over-the-counter derivatives through its clearinghouses CME Clearing and CME Clearing Europe.
Charts
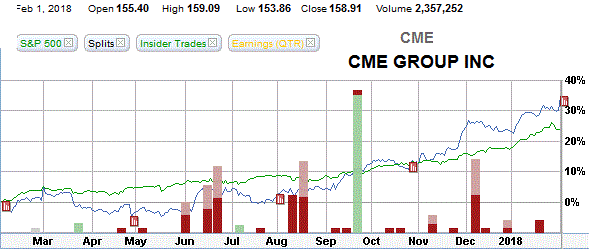
CME's 12-month performance chart shows the stock appreciating 32% versus a 23% gain for the stock market.
Insiders have been buyers using stock options at $54 to $83 a share. They were sellers at $136 to $152 a share.
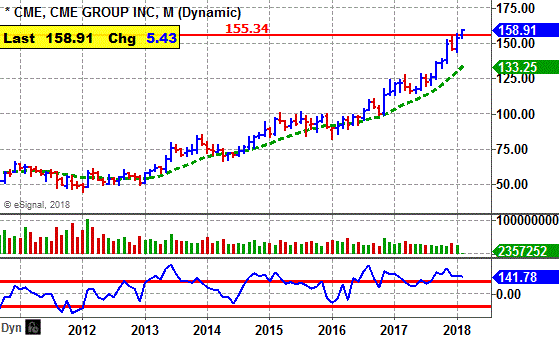
CME's long-term play shows the stock marking a bottom at $44.93 in early 2012. Since then the stock has been trending steadily higher.
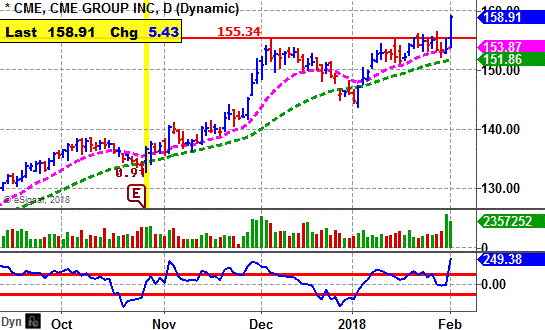
CME's daily chart shows the stock climbing from $130 in September to a peak at $155 by December.
The stock then put down a flat base with one shake out to the downside.
The breakout Thursday comes wit good volume.
The CCI momentum indicator (bottom of chart) is strongly bullish.
Earnings Outlook:
This year, analysts are forecasting a 30% jump in net to $6.19 a share. The stock sells with a price-earnings ratio of 25.
TTD sees that valuation as reasonable.
Net for the upcoming first quarter is expected to leap 25% to $1.52 a share from $1.22 the year before.
The highest estimate on the Street is at $1.58 a share.
The company has topped the consensus estimate the past seven quarters.
Strategy Opinion: TTD is targeting CME for a move to $190. A protective stop can be placed near $151.
TTD rates CME a good intermediate-term play.
Suitability: Average Bulls.
TTD's special research of Stock's Prior Performance:
Probability - Breakout Success - Bullish. CME has scored modest gains off its recent breakouts.
Probability - Earnings Response - Bullish. CME rose 8 times after the past 11 earnings reports when there was a significant change.
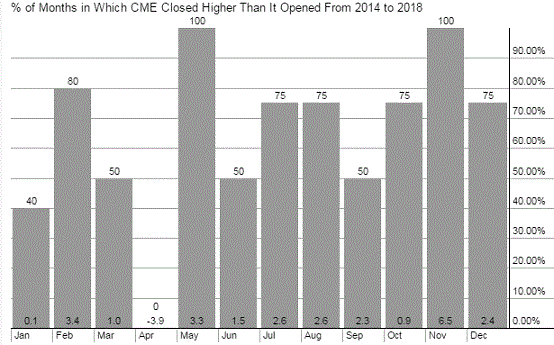
Probability: Seasonal Success - Bullish. CME rose an average of 3.4% in February and 1% in March.
Stock's Prior Performance After A Breakout
|
Stock's % Change from Breakout to peak - prior to cut below 50-day M/A. |
Date of Breakout |
Break point Price |
Stocks Price Peak after Breakout - prior to cut below 50-day M/A |
Date Trade Closed |
|
10% |
11/2/2017 | 138.68 | 153.41 | 12/4/2017 |
|
7% |
9/6/2017 | 127.96 | 138.02 | 10/5/2017 |
|
15% |
6/8/2017 | 120.78 | 127.32 | 6/14/2017 |
| 12% | 1/9/2017 | 110.07 | 123.43 | 12/13/2016 |
| 11% | 7/8/2016 | 98.82 | 109.76 | 9/19/2016 |
(In actual trading, entry and exit points could vary depending on broker execution.
Also, ideal are breakouts to a new 52-week high or better, perhaps all-time highs.)
Stock's Long-term Chart
Stock's Performance Chart with Quarterly Earnings Markers vs. S&P 500
Insider Buying in Green - Insider Selling in Red
Stock's Monthly Seasonal Performance Chart - Past 5 Years
Showing % Months UP and % Change
| TTD's Breakout Profile Rating CME Group Inc. (CME ) |
| TTD Check List | Bullish | Bearish | Neutral |
| Near 52-week High | YES | ||
| Volume | YES | ||
| Tick Volume | YES | ||
| Price Trend - Daily | YES | ||
| Price Trend - Long Term | YES | ||
| Price Daily Spread | YES | ||
| Base Structure | YES | ||
| Base - A-D | YES | ||
| Earnings-Quarterly | YES | ||
| Earnings-Long Term | YES | ||
| Earnings Outlook | YES | ||
| Industry Group | YES | ||
| Prior Breakout Success | YES | ||
| Fund Sponsorship | YES | ||
| Total Score | 14 | 0 | 0 |
Charts of Selected Breakout Stocks
|
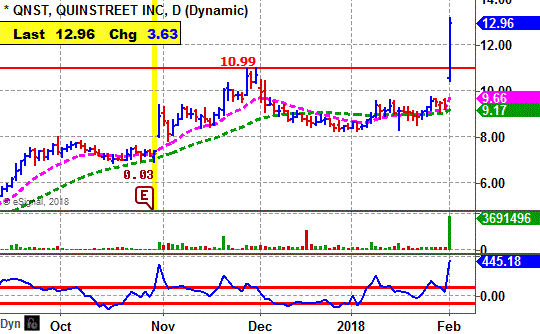
TTD's Quality Rating of Stock - QNST - ABOVE AVERAGE |
|
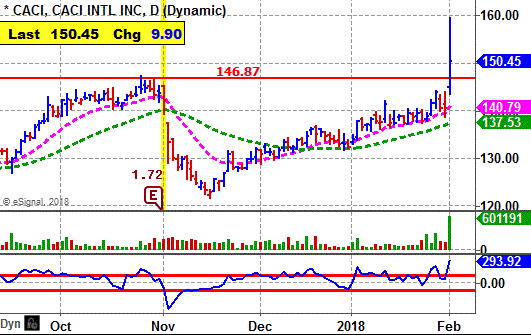
TTD's Quality Rating of Stock - CACI - AVERAGE |
|
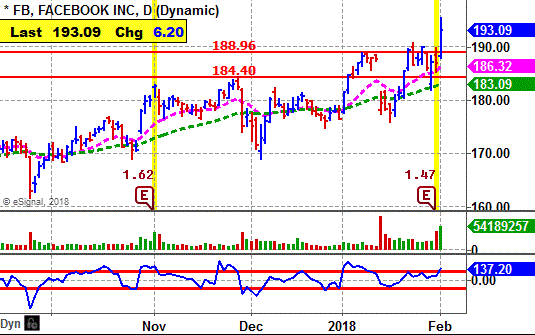
TTD's Quality Rating of Stock - FB - AVERAGE |
|
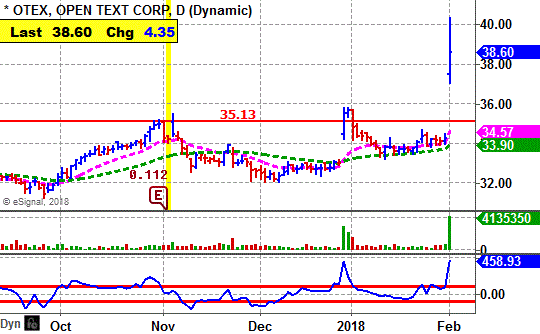
TTD's Quality Rating of Stock - OTEX - AVERAGE |

Ticker Tape Digest’s Daily List of “Stocks To Sell or Sell Short” ranks stocks well timed to be sold immediately based on daily trading. The list can be used as an alert to reduce current long-term positions.
Shorts from tape action so far today - 12
Stocks Screened - 12,234
Long-Term Environment for bears: Unfavorable.
Bear Side - Large list of shorts Thursday. Aggressive Bears can be venturesome.
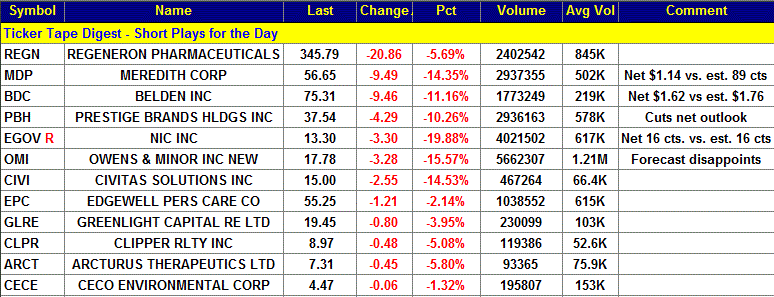
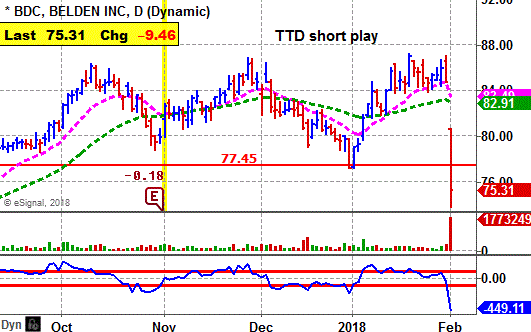
BDC. based in St. Louis, is a signal transmission solutions provider company. Annual revenues: $2.4 billion. BDC's stock falls sharply Thursday after reporting disappointing earnings. TTD sees more on the downside. 
So far today, BDC is trading a heavy 1.8 million shares, eight times its average daily volume of 219, 000 shares.
BDC reported net for the fourth quarter of $1.62 a share. That was below the consensus estimate of $1.76 a share.
BDC's stock gapped lower in the morning and touched $74.19.
The stock bounced back to around $76, fell to $74 in mid-afternoon. It was unable to sustain any comeback rally. 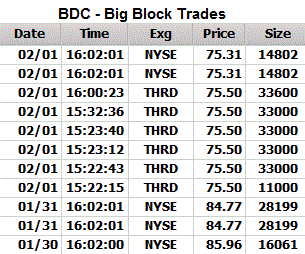
Tape Action
BDC's tape action shows the recent block trades.
One can see the price for the blocks falling from $84.77 in the prior session to as lows $75.31.
A key bearish trade came in the morning. Then near the close Wednesday a block of 14,802 shares (duplicated) crossed the tape at $75.31.
That was down from the prior block trade at $75.50 on 33,600 shares.
The tape would indicate potential for more on the downside.
Business
BDC makes signal transmission solutions for the broadcast, enterprise, and industrial markets.
The company's signal transmission solutions provides transmission of data, sound, and video for various applications.
The Company's sells its products to distributors, end users, installers, and to original equipment manufacturers.
Earnings:
This year, analysts are forecasting an 11% increase in net to $6.11 a share.
The company's miss on the fourth quarter 2017 net was the first in the past ten quarters.
Charts:
BDC's daily chart shows the stock gapping sharply lower and undercutting key technical support.
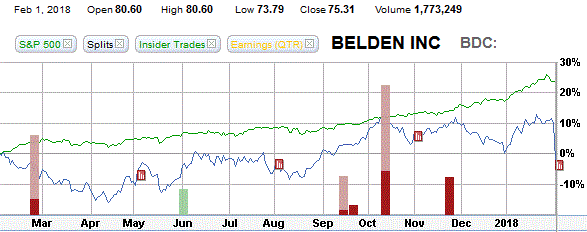
The 12-month performance chart shows the stock up just 2% versus a 22% gain for the stock market.
Strategy Opinion: TTD is targeting BDC for a decline to $65 within the next few months. A protective stop buy can be placed near $78.50.
Suitability: Average Bears.
TTD's special probability research of Prior Performance:
Probability - Earnings Response - Neutral. BDC rose 7 times after the past 14 earnings reports when there was a significant change.
Probability: Seasonal Activity - Bullish. BDC rose an average of 5.6% in February the past five years and 3% in March.
|
TTD's Quality Rating of Stock - BDC - BELOW AVERAGE |
Stock Performance Chart with Quarterly Earnings Markers vs. S&P 500
Insider Buying in Green - Insider Selling in Red
TTD columnist Leo Fasciocco has covered the stock market for over 30 years. His articles appear in many publications. He has also been a speaker at the Intershow conferences. He has been on television and radio. He is author of many educational articles about stock investing and the book “Guide To High-Performance Investing.”

For information to subscribe to the Ticker Tape Digest Services call: Beverly Owen at 1-480-926-1680.
Distributed by Corona Publishing Enterprises. TickerTape Digest Inc. 1220 W. Sherri, Gilbert, Az. 85233.
TTD “Professional Report” is available on the Web: $100 per month. Password needed. Published daily - around 20 times a month.
TTD Pro Report includes a Morning chart slide show of breakout stocks, a Midsession video-audio show with commentary on breakout stocks and shorts and a Final end of day overall report on breakout stocks for the session, short plays and accumulation plays. There are other features too such as Quick Trades and Long-term Plays.
TTD Daily Report is $39. It covers a Morning slide show of charts of stocks breaking out and a TTD end of day print report covering breakout stocks and shorts.
Credit cards accepted. Payable to Corona Publishing Enterprises.
(The information contained has been prepared from data deemed reliable but there is no guarantee of complete accuracy. Ticker Tape Digest Inc. is not affiliated with any broker, dealer or investment advisor. Nothing in this publication constitutes an offer, recommendation or solicitation to buy or sell any securities. Further research is advised. This report is copyrighted and no redistribution is permitted with out permission.)