Daily - Go to TTD's Tape of Stock Charts - Monday, February 2, 2015
|
Daily - Go to TTD's Tape of Stock Charts - Monday, February 2, 2015 |
|
Weekly - Bullish Conservative Investors - Go To TTD Long-Term Plays - Monday, January 26, 2015 |
|
Go to Video Show - "How to Make Money With Breakout Stocks" |
|---|

By Leo Fasciocco -- TTD
Ticker Tape Digest presents its daily stock market report containing stocks to go long as breakout trades, quick trades, or bargain trades. We also feature stocks under Significant Accumulation that are poised to breakout.
|
Ticker Tape Digest's Daily schedule guide for TTD subscribers 1. Pre-market - check Breakout Watch List and Quick Trades. 2. Morning - (11:30 - 12 A.M.) - check breakout stocks tape and breakout chart slide show. 3. Midday (1 P.M.) check TTD Midsession Report and see market video show. 4. After close (4 P.M.) check final TTD Report for day. Trading Strategies Bullish Aggressive Investors Bullish - "Breakout Stocks" - ideally suited for bull markets and special situation stocks. Potential for large returns. (See Performance) Aggressive Investor Bullish- "Quick Trade Stocks" -ideally suited for entry into top performing issues looking for a small quick profit." (See Performance) Conservative Investors "Bargain Buy Trades for the Long Term." Ideally suited for entry into top performing big cap stocks on pullbacks within overall up trend.(See Performance) Bearish Aggressive Bearish Investors - "Breakdown Stocks" to Sell Short. Ideally suited for bear markets or market pull backs. Potential for large returns (See Performance) |
|---|
The TTD report also contains stocks to short as breakdown plays and as bargain (swing trade) shorts.
Investors should tend to try to go with a strategy that fits with the stock market's trend, unless there is a special situation play.
TTD's Breakout Stocks - Long are most suitable for aggressive investors seeking ideal entry points into leading stocks, especially during bull markets. They can do extremely well in bull markets with gains of as much as several hundred percent.
These stocks can also do extremely well during strong market
rallies, or if they are in a industry group that is performing very well. They tend to have strong earnings outlooks and are near new-52 week, or all-time highs. 
TTD Quick Trade Stocks - Long These are leading issues that have pulled back in recent days, but could move higher soon. They are most suitable for Aggressive Investors willing to trade short term. These stocks will do extremely well during market advances. They have about 74% win rate. During market rally sequences the win rate is even higher. The return is small 3% to 8% in just a few days.
TTD's Bargain Buy Trades - Long - Long Term. These are for conservative bullish Investors These long-term buys are ideally suited for entry into stocks on pull backs within overall up trend. These stocks can give a good return long-term especially during a bull market.
TTD also presents Stocks To Sell or Sell Short. These issues are suitable for aggressive investors willing to take short positions both as trades or for longer-term plays. These stocks will do very well during bear markets or market pull backs.
TTD's Bearish breakdown stocks to sell short. These issues have potential to fall sharply. They often show a technical breakdown and also some fundamental business problem such as weak earnings.
TTD's multi-media updates include a slide-show that presents charts and analysis at midsession. Some times TTD presents feature analysis on stocks and the market. TTD uses Windows Media Files. (WMV).
TTD also presents a "Breakout Watch List" that is up dated daily. This list consists of key stocks in position to breakout. A close watch of this list can put you in the stock just as it breaks out. A good idea is to study the list and be ready to move into a stock quickly as it hits its breakpoint.
TTD often suggests using stop buy orders to enter. It is very important to buy a breakout stock as close as possible to the breakpoint. The idea is to get "elbow room" if the stock should follow through to the upside. This is very important in being successful in making big money with breakout stocks.
It is also essential to have a stop loss strategy for all stocks in which positions are taken. Not every stock will work as expected. It is important for investors to "police" their portfolios and avoid getting trapped in any bad positions.
Quality rating of breakout Two key factors: 1 - Stock near all-time high in price or near a 52-week high. 2 - earnings growth current year is strong. The ideal play is a stock with an Above Average Quality Rating. The stock is near a new high and will have strong earnings. TTD's other ratings are Average and Below Average.
TTD also has special feature sections on Educational Tips on Investing.
To email Mr. Leo Fasciocco leo@tickertapedigest.com.For service, email Beverly Owen owen@tickertapedigest.com. TTD’s Tel: 1-480-926-1680.
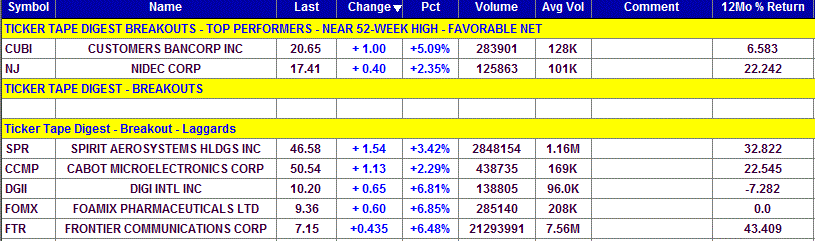
Breakout Stocks
Total Buy Breakouts so far today - 7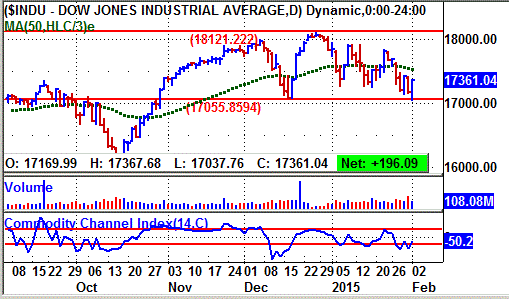
Overall Quality of Breakouts - AVERAGE
Stocks Screened - 8,300
Bull side - Breakout list small and extremely selective. Stock market holding above near-term support. February tends to be a weak stock market month.
(Put mouse on Dow chart to see Nasdaq chart)
Long Term Environment for bulls: Favorable
Stock Market Momentum
Market (Daily) - NYSE Bearish, Nasdaq Bearish
Market (Weekly) - NYSE Bearish, Nasdaq Bearish
Market (Monthly) - NYSE Bearish, Nasdaq Bearish
Ticker Tape Digest's
|
TTD's Quality Rating of Stock - NJ - ABOVE AVERAGE |
NJ, based in Japan, makes electric motors and components. Annual revenues: $8.3 billion. NJ's stock breaks out today from a six-month flat base. The move carries the stock to a new all-time high. That is bullish. So far today NJ is trading 125,863 shares. Its average daily volume is 101,000 shares. 
TTD highlighted NJ as a breakout at our midsession video show on the Web Monday.
The stock, which generally shows on a chart with gap moves, pushed higher in the morning to cut across its breakpoint line. (see 10-minute chart)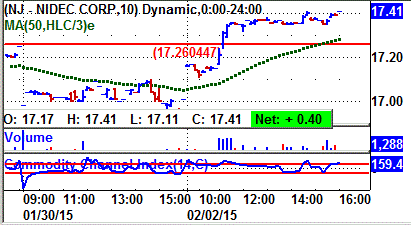
The intraday breakpoint area showed strong volume. That is bullish indicating good demand for the stock.
The stock then trended sideways the rest of the day with a slight bias to the upside.
NJ's tape action shows the recent block trades.
One can see the price for the blocks climbing from $16.86 a few sessions ago to as high as $17.37.
A key bullish block came when 2,300 shares crossed the tape Monday morning at 17.26.
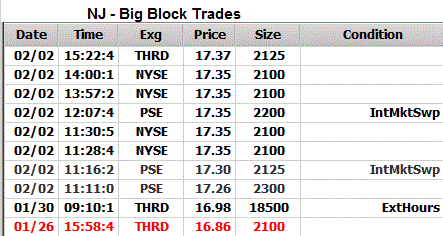
That was up from the prior block at $16.98 on 18,500 shares.
NJ makes electric motors and components.
The company offers hard disk drives spindle motors and other small precision motors for optical disk drives, laser printers, copiers, polygon scanners, electronic cooling fans, refrigerators, mobile phones, DVD recorders and automobiles.
It also provides automotive motors and electronic controls for power steering and dual-clutch transmission systems, engine and fuel cell cooling systems, seat adjusters, window lifts, door lock actuators, vehicle traction systems and collision avoidance.
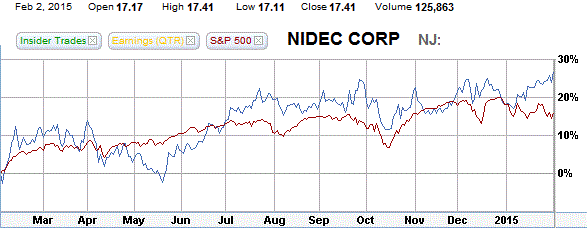
NJ's 12-month performance chart shows the stock appreciating 25% versus a 15% gain for the S&P 500 index.
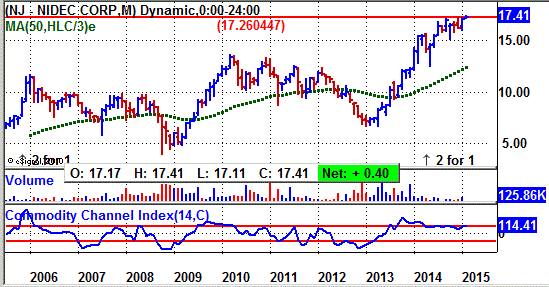
NJ's long-term chart shows the stock advancing 5 back in 2008, the bottom in the prior bear market, to 13 by early 2010.
The stock then fell back to 7 in 2013. However, since then NJ has pushed steadily high and today hits a new all-time high. That is bullish. The stock's long-term chart is adjusted for two 2-for-1 stock splits and 4-for-1 split back in 2003. 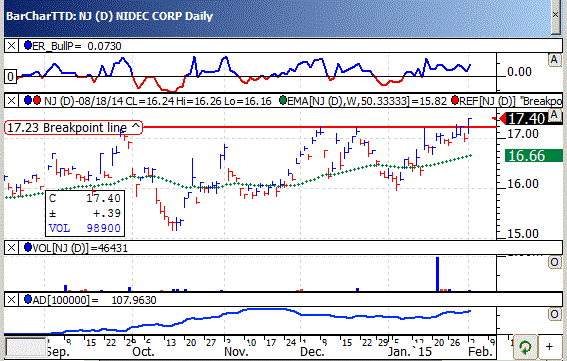
NJ's daily chart shows the stock meeting upside resistance at 17.23.
The stock punches through Monday to clear resistance and hit a new all-time high.
The base is well formed. The stock's TTD momentum indicator (top of chart) is solidly bullish.
The accumulation - distribution line (bottom of chart) is in an overall up trend. It compliments the price action well.
Analysts look for a 26% increase in NJ's earnings for the fiscal year ending in March.
They project 59 cents a share, up from 47 cents a year before.
Going out to fiscal 2016 ending in March, the Street is forecasting a 29% increase in NJ's profits to 76 cents a share from the anticipated 59 cents a share anticipated for fiscal 2015.
Strategy Opinion: TTD is targeting NJ for a move to 22 off this breakout. A protective stop can be placed near 16.20.
TTD rates NJ a very good intermediate-term play provided earnings remain on course.
Sponsorship: Average. A top rated fund holding the stock is 4-star rated DFA International Core Equity Fund. It has 19,800 shares.
The largest fund holder is the Virtus Balanced A Fund, 2-star rated with a 229,650 shares.
NJ has 1.1 billion shares outstanding.
Insider Activity: Not available. Currently, one analyst follows the stock and has a strong buy.
Stock Performance Chart with Quarterly Earnings Markers.
| TTD's Breakout Profile
Rating Nidec Corp. - (NJ) |
| TTD Check List | Bullish | Bearish | Neutral |
| Near 52-week High | YES | ||
| Volume | YES | ||
| Tick Volume | YES | ||
| Price Trend - Daily | YES | ||
| Price Trend - Long Term | YES | ||
| Price Daily Spread | YES | ||
| Base Structure | YES | ||
| Base - A-D | YES | ||
| Earnings-Quarterly | YES | ||
| Earnings-Long Term | YES | ||
| Earnings Outlook | YES | ||
| Industry Group | YES | ||
| Prior Breakout Success | YES | ||
| Fund Sponsorship | YES | ||
| Total Score | 12 | 0 | 2 |
Charts of Selected Breakout Stocks
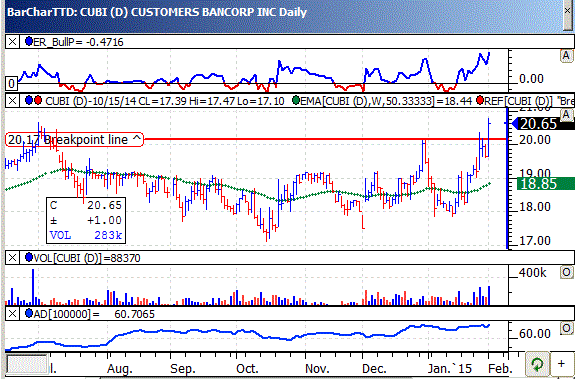
| TTD's Quality Rating of Stock - CUBI - ABOVE AVERAGE |
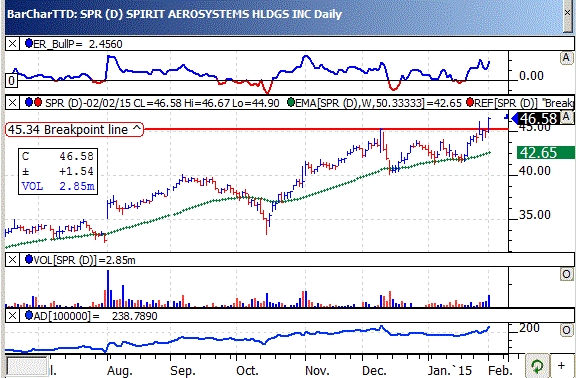
| TTD's Quality Rating of Stock - SPR - BELOW AVERAGE |
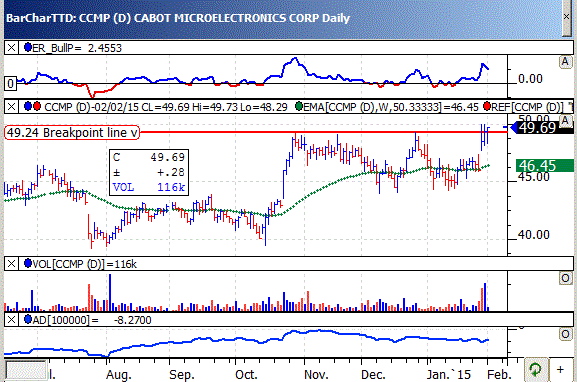
| TTD's Quality Rating of Stock - CCMP - BELOW AVERAGE |
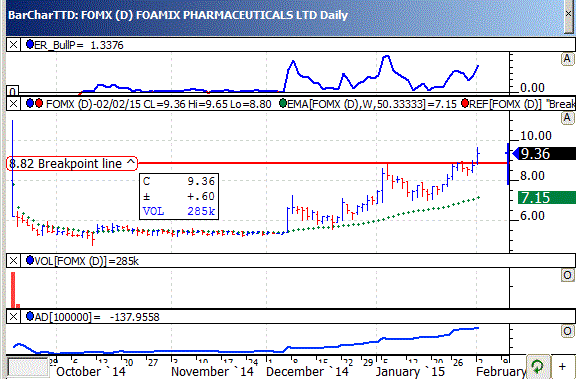
| TTD's Quality Rating of Stock - FOMX - BELOW AVERAGE |

Ticker Tape Digest’s Daily List of “Stocks To Sell or Sell Short” ranks stocks well timed to be sold immediately based on daily trading. The list can be used as an alert to reduce current long-term positions.
Shorts from tape action so far today - 8
Stocks Screened - 8,300
Long-Term Environment for bears: Neutral.
Bear Side - Good number of shorts with some interesting plays. Bears be selective. Stock market still in trading range. TTD's short from Friday was Guess Inc. (GES) at 19.06. Monday, the stock has declined to 18.19 and is working well for bears.
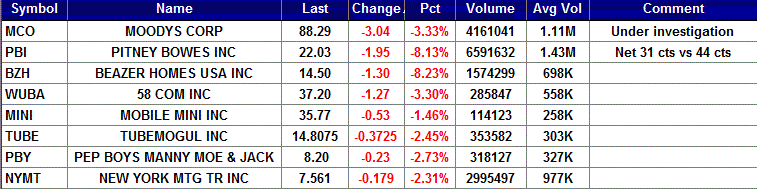
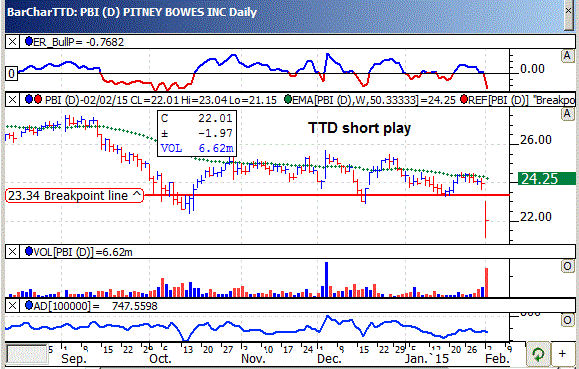
PBI, based in Stamford, Con., provides mailing processing equipment and logistics services. Annual revenues: $3.9 billion. PBI's stock gaps lower today in heavy trading after lowering its earnings outlook for 2015. The stock cuts below key technical support and that triggers a TTD short play. 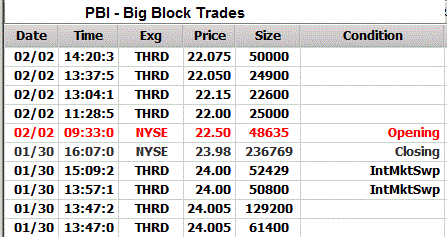
TTD sees more on the downside. PBI was featured as a short at our midsession video show on the Web Monday.
PBI reported earnings for the fourth quarter that was in line with Street expectations. However, going out to 2015 the company projected net of $1.85 to $2 a share.
That was disappointing to the Street which as a consensus estimate of $2.01 a share.
PBI's stock gapped lower in the morning. It hit an intraday low of 21.15.
The stock then lifted to around 22 and trended sideways the rest of the day still in the red.
PBI's tape action shows heavy in the prior session, Friday. A block of 236,769 shares crossed the tape at $23.98.
That was down from the prior block at $24 on 52,429 shares.
PBI operates in three segments: Mailing and integrated logistics, office solutions and capital services.
The company operates in the United States and outside the U.S.
Mailing and Integrated Logistics includes revenues from the rental of postage meters and the sale and financing of mailing equipment.
Office solutions includes revenues from the sale, financing, rental and service of reprographic and facsimile equipment. Capital services provides large-ticket financing and fee-based programs covering a broad range of products.
This year, the Street is looking PBI to show a 6% increase in net to $2.01 a share from $1.90 the year before.
PBI's daily chart shows the stock declining to around 24 in October. The stock then trended mostly sideways. Today, PBI gaps lower with big volume undercutting key technical support.
Strategy Opinion: TTD is targeting PBI for a decline to 17.50 within the next few months or sooner. A protective stop buy can be placed near 23.10.
| TTD's Quality Rating of Stock - PBI - BELOW AVERAGE |
TTD columnist Leo Fasciocco has covered the stock market for over 20 years. His articles appear in many publications. He is also a speaker at the Intershow conferences. He has been on television and radio. He is author of many educational articles about stock investing and the book “Guide To High-Performance Investing.”

For information to subscribe to the Ticker Tape Digest Services call: Beverly Owen at 1-480-926-1680. Distributed by Corona Publishing Enterprises. Ticker Tape Digest Inc. P.O. Box 2044 Chandler, Az. 85244-2044. TTD “Professional Report” is available on the World Wide Web: $100 per month. Password needed. “TTD Professional“ Faxed is $200 per month. The TTD
Daily Report is $39.95. Credit cards accepted.
(The information contained has been prepared from data deemed reliable but there is no guarantee of complete accuracy. Ticker Tape Digest Inc. is not affiliated with any broker, dealer or investment advisor. Nothing in this publication constitutes an offer, recommendation or solicitation to buy or sell any securities. Further research is advised. This report is copyrighted and no redistribution is permitted with out permission.)