|
Aggressive Investor Bullish- Go To TTD Quick Trade Setups (win rate 70%) - Thursday, February 11 |
|
Go to Video Show - "How to Make Money With Breakout Stocks" Go to Video Show -TTD Performance 2008 Long and Short |
|---|

TTD will not publish Friday. We resume Tuesday. Have a nice Holiday Weekend
By Leo Fasciocco -- TTD
Ticker Tape Digest presents its daily stock market report containing stocks to go long as breakout trades, quick trades, or bargain trades. We also feature stocks under  Significant Accumulation that are poised to breakout.
|
Ticker Tape Digest's Trading Strategies Overview and Performance Bullish Aggressive Investors Bullish - "Breakout Stocks" - ideally suited for bull markets and special situation stocks. Potential for large returns. Aggressive Investor Bullish- "Quick Trade Stocks" -ideally suited for entry into top performing issues looking for a small quick profit." Conservative Investors "Bargain Buy Trades" (swing trades). Ideally suited for entry into stocks on pullbacks within overall up trend. Good for trading range markets Bearish Aggressive Bearish Investors - "Breakdown Stocks" to Sell Short. Ideally suited for bear markets or market pull backs. Potential for large returns Conservative Bearish Investors (swing traders). "Bargain Bearish Plays" to Sell Short. Ideally suited for trading range markets with overall market down trend. |
|---|
The TTD report also contains stocks to short as breakdown plays and as bargain (swing trade) shorts.
Investors should tend to try to go with a strategy that fits with the stock market's trend, unless there is a special situation play.
TTD's Breakout Stocks - Long are most suitable for aggressive investors seeking ideal entry points into leading stocks, especially during bull markets. They can do extremely well in bull markets with gains of as much as several hundred percent.
These stocks can also do extremely well during strong market rallies, or if they are in a industry group that is performing very well. They tend to have strong earnings outlooks and are near new-52 week, or all-time highs.
TTD Quick Trade Stocks - Long These are leading issues that have pulled back in recent days, but could move higher soon. They are most suitable for Aggressive Investors willing to trade short term. These stocks will do extremely well during market advances. They have about 74% win rate. During market rally sequences the win rate is even higher. The return is small 3% to 8% in just a few days.
TTD's Bargain Buy Trades - Long These are for conservative bullish Investors The strategy is called swing trading. These long buys are ideally suited for entry into stocks on pull backs within overall up trend. They are good for trading range markets. These stocks can give a good return in a week or two. They can also explode into a breakout and a powerful advance.
TTD also presents Stocks To Sell or Sell Short. These issues are suitable for aggressive investors willing to take short positions both as trades or for longer-term plays. These stocks will do very well during bear markets or market pull backs.
TTD's Bearish breakdown stocks to sell short. These issues have potential to fall sharply. They often show a technical breakdown and also some fundamental business problem such as weak earnings.
TTD's Bearish bargain play stocks to sell short. These issues are usually in down trends and are poised to rollover after a minor rally. They often can provide a conservative bear with a good entry point.
TTD's multi-media updates include a slide-show that presents charts and analysis at midsession. Some times TTD presents feature analysis on stocks and the market. TTD uses Windows Media Files. (WMV).
TTD also presents a "Breakout Watch List" that is up dated daily. This list consists of key stocks in position to breakout. A close watch of this list can put you in the stock just as it breaks out. A good idea is to study the list and be ready to move into a stock quickly as it hits its breakpoint.
TTD often suggests using stop buy orders to enter. It is very important to buy a breakout stock as close as possible to the breakpoint. The idea is to get "elbow room" if the stock should follow through to the upside. This is very important in being successful in making big money with breakout stocks.
It is also essential to have a stop loss strategy for all stocks in which positions are taken. Not every stock will work as expected. It is important for investors to "police" their portfolios and avoid getting trapped in any bad positions.
Quality rating of breakout Two key factors: 1 - Stock near all-time in price or near a 52-week high. 2 - earnings growth current year is strong. The ideal play is a stock with an Above Average Quality Rating. The stock is near a new high and will have strong earnings.TTD's other ratings are Average and Below Average.
TTD also has special feature sections on Educational Tips on Investing.
To email Mr. Leo Fasciocco leo@tickertapedigest.com.For service, email Beverly Owen owen@tickertapedigest.com. TTD’s Tel: 1-480-926-1680.
Stocks Screened - 8,200
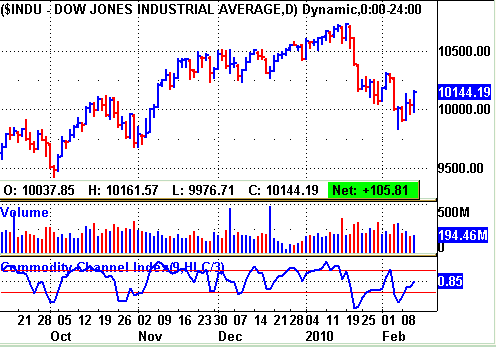
Bull side - Breakout list remains skimpy. Bulls continue to be patient and selective. The major weekly averages are still bearish. However, the potential for an upside turn is in place.
(Put mouse on Dow chart to see Nasdaq chart)
Long Term Environment for bulls: Neutral
Market (Daily) - NYSE Bullish, Nasdaq Bullish
Market (Weekly) - NYSE Bearish, Nasdaq Bearish
Market (Monthly) - NYSE Bearish, Nasdaq Bearish
|
TTD's Quality Rating of Stock - ZBRA - AVERAGE |
ZBRA, based in Vernon Hills, Il., makes specialty printing devices. Annual revenues: $813 million. ZBRA breaks out from a seven-week flat base today. The stock hits a 52-week high. However, it has been a laggard. The big positive is expectations of strong profits this year and next. So far today, ZBRA is trading 577,511 shares, double its normal daily volume of 263,000 shares. 
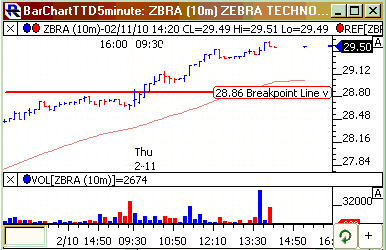
ZBRA's 5 minute chart shows the stock driving above its breakpoint in the morning. It continued higher showing very good follow through action intraday.
The stock's tape action shows the big block trades of the past few days. .
The action is very bullish. The first big block of notice was on Wednesday. It was 15,000 shares crossing at $28.22. That was up sharply from the prior block trade at $26.70 back a few days before.
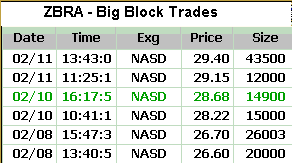 Today, a big block of 43,500 shares crossed at $29.40. That was significantly higher than all the prior block trades.
TTD sees the tape action indicating very good institutional buying interest.
ZBRA sells specialty printing devices that print variable information on demand at the point of issuance.
These devices are used worldwide by manufacturers, service organizations and governments for automatic identification, data collection and personal identification in applications.
The company's product range consists of direct thermal and thermal transfer label and receipt printers, passive radio frequency identification printer/encoders, dye sublimation card printers and digital photo printers.
It also sells a range of specialty supplies consisting of self-adhesive labels, thermal transfer ribbons, thermal printheads, batteries and other accessories, including software for label design and printer network management.
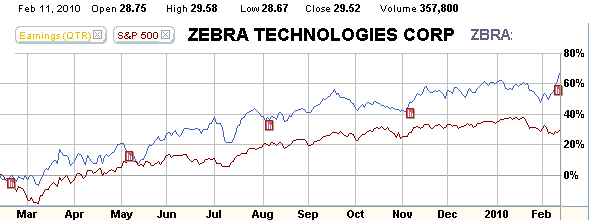
ZBRA's 12-month performance chart shows the stock appreciating 65% compared with a 30% gain for the S&P 500 index. So, although the stock is well off from its all time high of 62.40 made in 2004, it has been outperforming in recent months.
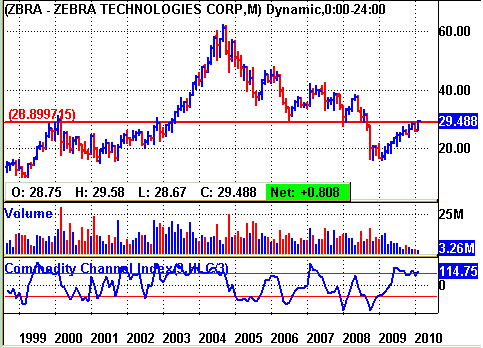
ZBRA's long-term chart shows the stock climbing from a bear market low of 16 early in 2009 to 29. 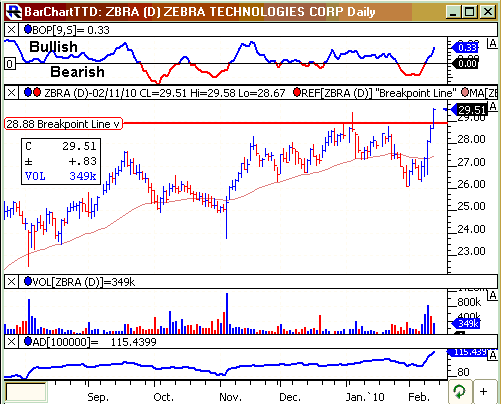
ZBRA's daily chart shows the stock climbing sharply the past few sessions. The trigger for that was the company's forecast on Feb. 9 of first quarter net of 27 cents a share to 34 cents.
That was above the Street consensus estimate for the quarter of 29 cents a share. The highest estimate was at 31 cents a share.
The 27-34 cent share estimate is up from last year's net of 17 cents a share.
Technically, the breakout is being supported by good buying. The TTD momentum indicator (top of the chart) is bullish.
The accumulation - distribution line (bottom of chart) has broken out to the upside. That indicates good buying in the stock supportive of the technical breakout.
This year, analysts forecast a 44% jump in ZBRA's earnings to $1.34 a share from 93 cents a year ago. That forecast could get boosted to about $1.40 a share. The stock sells with a price-earnings ratio of 21 based on 2010 net. TTD sees that as a bit low given the strong profit outlook.
Going out to 2011, the Street forecast a 25% gain in net to $1.67 a share from the anticipated $1.34 a share.
Strategy Opinion: TTD is targeting ZBRA for a gallop to 36 within the next few months, or sooner. A protective stop can be placed near 26. TTD rates ZBRA a good intermediate-term play.
Sponsorship: Excellent. The largest fund holder is 5-star rate Neuberger Berman Genesis Fund with a big 6.4% stake. The second largest fund holder is 5-star rated Royce Premier Investment Fund with a 2.9% stake. ZBRA has 58.8 million shares outstanding.
Insider Activity: Neutral. Not much trading by insiders. Ten analysts follow the stock, 2 have a buy, down from 4 three months ago.
Stock Performance Chart for 12 months with Quarterly Earnings Markers.
|
TTD's Breakout Profile Rating Zebra Technologies Corp. - (ZBRA) |
| TTD Check List | Bullish | Bearish | Neutral |
| Near 52-week High | YES | ||
| Volume | YES | ||
| Tick Volume | YES | ||
| Price Trend - Daily | YES | ||
| Price Trend - Long Term | YES | ||
| Price Daily Spread | YES | ||
| Base Structure | YES | ||
| Base - A-D | YES | ||
| Earnings-Quarterly | YES | ||
| Earnings-Long Term | YES | ||
| Earnings Outlook | YES | ||
| Industry Group | YES | ||
| Prior Breakout Success | YES | ||
| Fund Sponsorship | YES | ||
| Total Score | 10 | 1 | 3 |
(The “breakout List” gives all stocks breaking out of a base of five weeks or more. These stocks have a good chance to trend higher. However, a stop should be used to avoid those that do not work. They are ranked according to percentage change and classified as leaders or other. (Trading strategy: One should buy breakout stocks at breakpoint by using market order or stop buy)
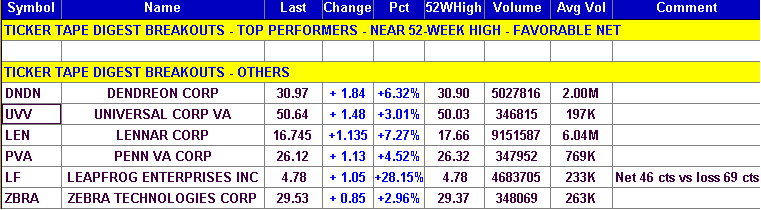
Charts of Selected Breakout Stocks
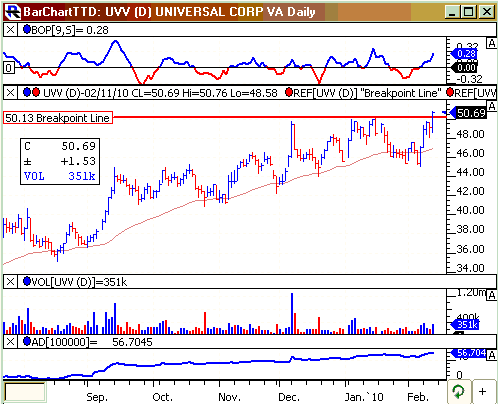
| TTD's Quality Rating of Stock - UVV - AVERAGE |
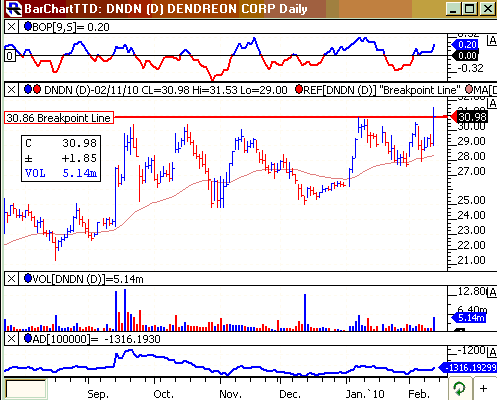
| TTD's Quality Rating of Stock - DNDN - BELOW AVERAGE |
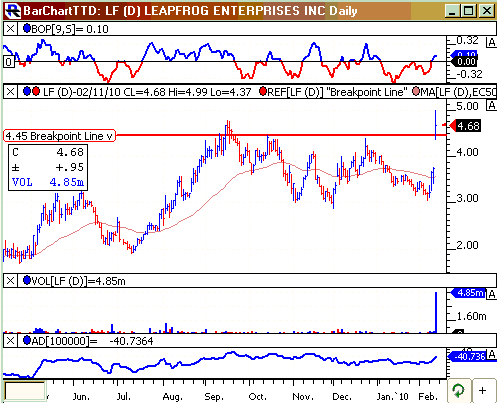
| TTD's Quality Rating of Stock - LF - BELOW AVERAGE |
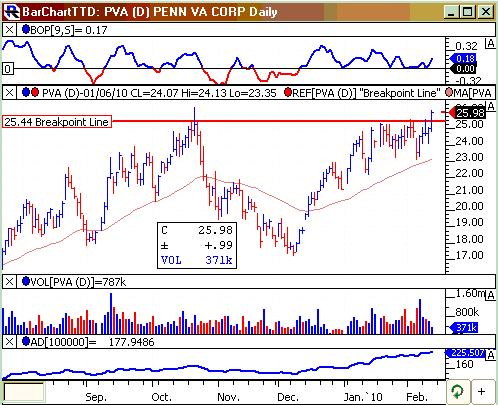
| TTD's Quality Rating of Stock - PVA - BELOW AVERAGE |

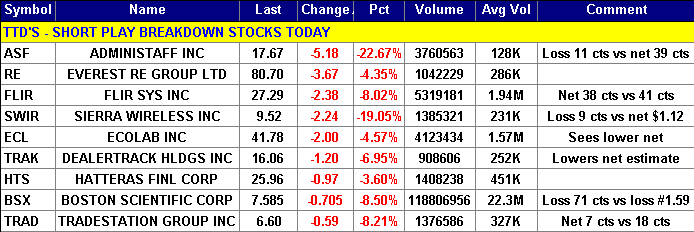
Ticker Tape Digest’s Daily List of “Stocks To Sell Short” ranks stocks well timed to be sold immediately based on daily trading. The list can be used as an alert to reduce current long-term positions.
Shorts from tape action so far today - 9
Stocks Screened - 8,200
Long-Term Environment for bears: Neutral.
Bear Side - Breakdown list expands today even though the stock market scores a big gain. Bears continue to be venturesome. TTD's short play from Wednesday was ISIS Pharmaceuticals Inc. (ISIS) - 9.23, down 1.81. Thursday, the stock is trading at 8.74 and working well for bears.
(Trading strategy: These stocks can be sold short, or if held should be sold. If a stock is sold short, a protective stop buy should be placed. Short plays work best when the stock market is in a down trend.)
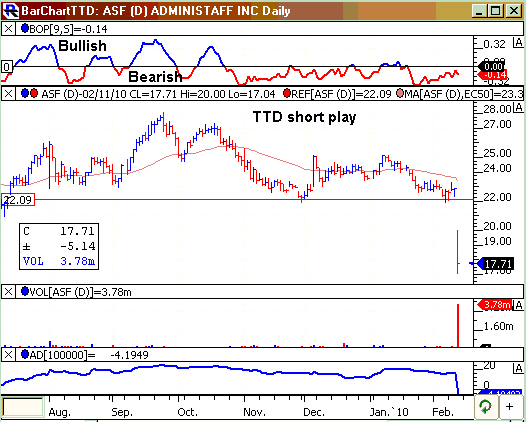
ASF, based in Kingwood, Tex., provides employment services. Annual revenues: $1.7 billion. ASF's stock fell sharply today after the company reported a surprise loss for the fourth quarter. Volume ASF swelled to 4.3 million shares, an awesome 33 times its normal daily volume of 128,000 shares. The selling stamped indicated heavy institutional selling pressure. Although ASF is extended to the downside, TTD still sees more to go. 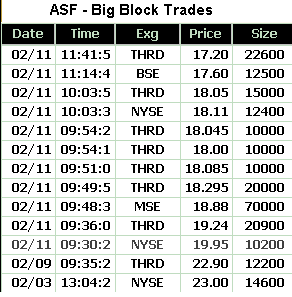
TTD highlighted ASF as a short at our midsession show on the Web Thursday.
ASF's stock plunged at the opening. It hit a low at 17.04 in the late morning. In the afternoon, the stock trended sideways unable to rally.
TTD's clip of the tape shows the recent Big Block trades in ASF.
One can see the price for the blocks falling from $23 to $17.20. A key trade was a big block of 70,000 shares that crossed in the morning at $18.88. That was down sharply from the prior block trade at $19.24.
ASF provides personnel management system encompassing a range of services, including benefits and payroll administration, health and workers' compensation insurance programs, personnel records management and employer liability management.
It also services employee recruiting and selection, employee performance management and employee training, and development services to small and medium-sized businesses. The company has 51 sales offices in 24 markets. In April 2008.
ASF reported a fourth quarter loss of 11 cents a share compared with a profit of 39 cents a year ago. The Street was expecting a profit of 15 cents a share. So, the loss was a big surprise. For 2010, analysts have been forecasting a profit of $1.12 a share. That may get cut.
ASF's daily chart shows the big gap drop in the stock and big volume. The pattern is extremely bearish.
Strategy Opinion: TTD is targeting ASF for a drop to 14.50 within the next few months, or sooner. The stock has the potential to go even lower. A protective stop buy can be placed near 19.
TTD columnist Leo Fasciocco has covered the stock market for over 20 years. His articles appear in many publications. He is also a speaker at the Intershow conferences. He has been on television and radio. He is author of many educational articles about stock investing and the book “Guide To High-Performance Investing.”

For information to subscribe to the Ticker Tape Digest Services call: B. J. Owen at 1-480-926-1680. Distributed by Corona Publishing Enterprises. Ticker Tape Digest Inc. P.O. Box 2044 Chandler, Az. 85244-2044. TTD “Professional Report” is available on the World Wide Web: $100 per month. Password needed. “TTD Professional“ Faxed is $200 per month. The TTD Daily Report is $39.95. Credit cards accepted.
(The information contained has been prepared from data deemed reliable but there is no guarantee of complete accuracy. Ticker Tape Digest Inc. is not affiliated with any broker, dealer or investment advisor. Nothing in this publication constitutes an offer, recommendation or solicitation to buy or sell any securities. Further research is advised. This report is copyrighted and no redistribution is permitted with out permission. Some of the charts are from Telescan, Insight Trading, First Alert and other sources.)