Daily - Go to TTD's Tape of Stock Charts - Tuesday, February 19
|
Daily - Go to TTD's Tape of Stock Charts - Tuesday, February 19 |
|
Weekly - Bullish Conservative Investors - Go To TTD Long-Term Plays - Tuesday, February 19 |
|
Go to Video Show - "How to Make Money With Breakout Stocks" |
|---|

By Leo Fasciocco -- TTD
Ticker Tape Digest presents its daily stock market report containing stocks to go long as breakout trades, quick trades, or bargain trades. We also feature stocks under Significant Accumulation that are poised to breakout.
|
Ticker Tape Digest's Daily schedule guide for TTD subscribers 1. Pre-market - check Breakout Watch List and Quick Trades. 2. Morning - (11:30 - 12 A.M.) - check breakout stocks tape and breakout chart slide show. 3. Midday (1 P.M.) check TTD Midsession Report and see market video show. 4. After close (4 P.M.) check final TTD Report for day. Trading Strategies Bullish Aggressive Investors Bullish - "Breakout Stocks" - ideally suited for bull markets and special situation stocks. Potential for large returns. (See Performance) Aggressive Investor Bullish- "Quick Trade Stocks" -ideally suited for entry into top performing issues looking for a small quick profit." (See Performance) Conservative Investors "Bargain Buy Trades for the Long Term." Ideally suited for entry into top performing big cap stocks on pullbacks within overall up trend.(See Performance) Bearish Aggressive Bearish Investors - "Breakdown Stocks" to Sell Short. Ideally suited for bear markets or market pull backs. Potential for large returns (See Performance) |
|---|
The TTD report also contains stocks to short as breakdown plays and as bargain (swing trade) shorts.
Investors should tend to try to go with a strategy that fits with the stock market's trend, unless there is a special situation play.
TTD's Breakout Stocks - Long are
most suitable for aggressive investors seeking ideal entry points into leading stocks, especially during bull markets. They can do extremely well in bull markets with gains of as much as several hundred percent. 
These stocks can also do extremely well during strong market rallies, or if they are in a industry group that is performing very well. They tend to have strong earnings outlooks and are near new-52 week, or all-time highs.
TTD Quick Trade Stocks - Long These are leading issues that have pulled back in recent days, but could move higher soon. They are most suitable for Aggressive Investors willing to trade short term. These stocks will do extremely well during market advances. They have about 74% win rate. During market rally sequences the win rate is even higher. The return is small 3% to 8% in just a few days.
TTD's Bargain Buy Trades - Long - Long Term. These are for conservative bullish Investors These long-term buys are ideally suited for entry into stocks on pull backs within overall up trend. These stocks can give a good return long-term especially during a bull market.
TTD also presents Stocks To Sell or Sell Short. These issues are suitable for aggressive investors willing to take short positions both as trades or for longer-term plays. These stocks will do very well during bear markets or market pull backs.
TTD's Bearish breakdown stocks to sell short. These issues have potential to fall sharply. They often show a technical breakdown and also some fundamental business problem such as weak earnings.
TTD's multi-media updates include a slide-show that presents charts and analysis at midsession. Some times TTD presents feature analysis on stocks and the market. TTD uses Windows Media Files. (WMV).
TTD also presents a "Breakout Watch List" that is up dated daily. This list consists of key stocks in position to breakout. A close watch of this list can put you in the stock just as it breaks out. A good idea is to study the list and be ready to move into a stock quickly as it hits its breakpoint.
TTD often suggests using stop buy orders to enter. It is very important to buy a breakout stock as close as possible to the breakpoint. The idea is to get "elbow room" if the stock should follow through to the upside. This is very important in being successful in making big money with breakout stocks.
It is also essential to have a stop loss strategy for all stocks in which positions are taken. Not every stock will work as expected. It is important for investors to "police" their portfolios and avoid getting trapped in any bad positions.
Quality rating of breakout Two key factors: 1 - Stock near all-time in price or near a 52-week high. 2 - earnings growth current year is strong. The ideal play is a stock with an Above Average Quality Rating. The stock is near a new high and will have strong earnings. TTD's other ratings are Average and Below Average.
TTD also has special feature sections on Educational Tips on Investing.
To email Mr. Leo Fasciocco leo@tickertapedigest.com.For service, email Beverly Owen owen@tickertapedigest.com. TTD’s Tel: 1-480-926-1680.
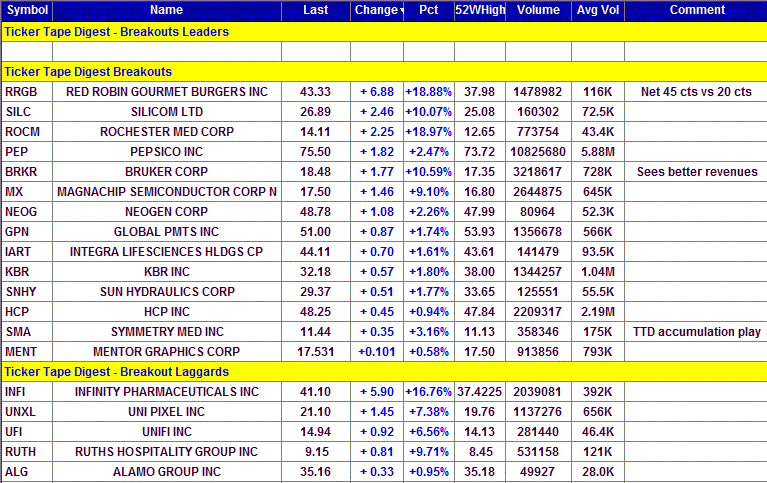
Breakout Stocks
Total Buy Breakouts so far today - 19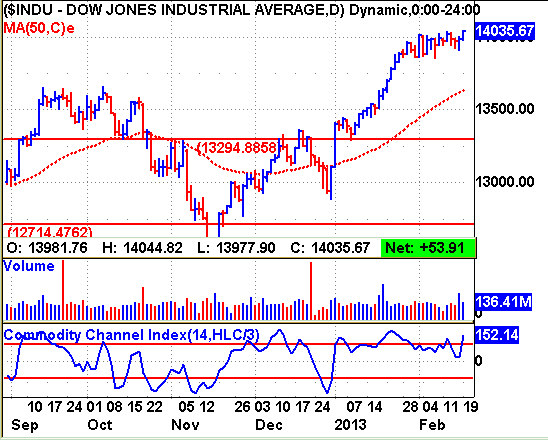
Overall Quality of Breakouts - Average
Stocks Screened - 8,300
Bull side - Breakout list large with some interesting plays. Bulls can be venturesome. Stock market holds up trend.
(Put mouse on Dow chart to see Nasdaq chart)
Long Term Environment for bulls: Favorable
Market (Daily) - NYSE Bullish, Nasdaq Bullish
Market (Weekly) - NYSE Bullish, Nasdaq Bullish
Market (Monthly) - NYSE Bullish, Nasdaq Bullish
Ticker Tape Digest's
(See Top Performing Breakout Stocks for 2011- 2012)
|
TTD's Quality Rating of Stock - SMA - AVERAGE |
SMA, based in Warsaw, Ind., produces medical devices for spinal and
dental problems. Annual revenues: $388 million. SMA's stock break out today from a well-formed
seven-week flat base. The company had strong profits last year and should show strong earnings this year. 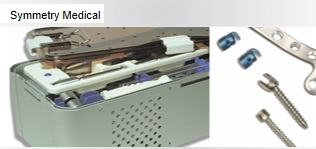
TTD highlighted SMA as a possible breakout a few sessions ago.
So far today, SMA is trading 358,346 shares, about double its normal daily volume of 175,000 shares.
The stock rose steadily in the morning and cleared its base. In the afternoon it moved sideways holding the bulk of its gain. (See 10-minute chart) 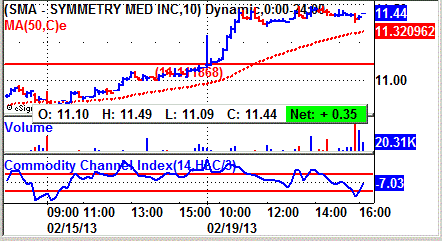
Technically, the breakout looks picture perfect. However, it will be important for the stock to follow through to the upside.
SMA's tape action showed some important institutional accumulation.
There were four key bullish block trades.
A look at TTD's table shows the block trades. The first came on 27,148 shares at $10.93, the second on 21,465 shares at $11.03, the third on 10,240 shares at $11.09 and finally the fourth on 19,100 shares at $11.43.
That was very impressive tape action and came when the stock was breaking out. 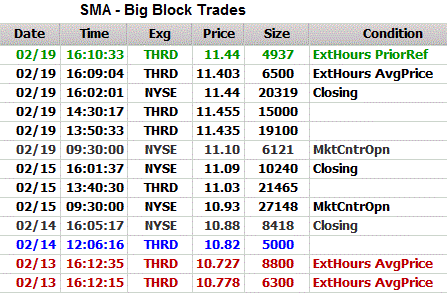
A few sessions ago, TTD spotted a giant block trade of 68,938 shares crossing at $10.80. That was up from a prior block at $10.74.
SMA makes medical devices for the medical market. They are used for orthopedic, spinal, trauma, dental, cardiovascular, and ophthalmology treatment. Their brands include Jet, Othy, PolyVac, Thornton and UltreXX.
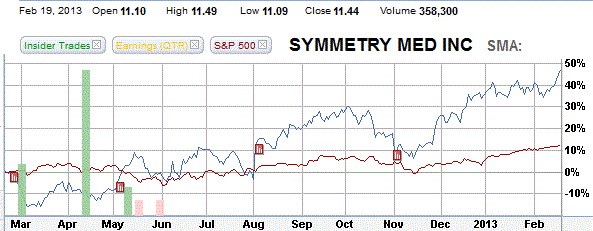
SMA's 12-month performance chart shows the stock appreciating 48% versus a 15% gain for the S&P 500 index.
Also, one can notice the blue blocks showing strong insider buying. The setup is very bullish.
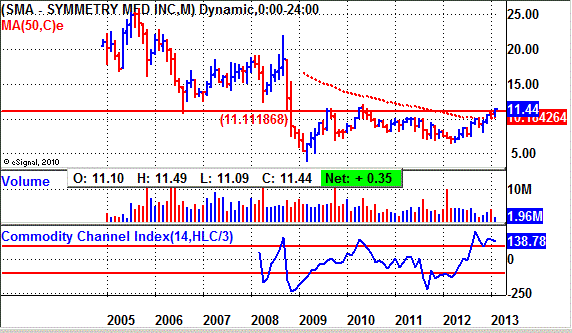
SMA's long-term chart shows the stock coming public in late 2004 and trading around 20. The stock climbed to 25 in 2005. However, it fell back and in 2008 got dragged lower due to the bear market. The stock bottomed around 4 in early 2009.
On a long-term bases, the stock has been trending sideways in a range between 6 and 12. It has a chance to make a long-term breakout to the upside.
SMA's daily chart shows the stock advancing from 7 back in August to a peak near 11 in early January.
The stock then put down a well formed flat base. 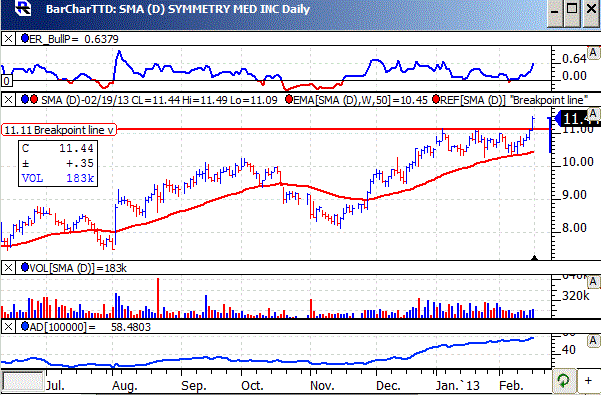
The breakout today comes with a good widening of the daily spread. Also, the stock appears to be closing near its high for the session, which is also bullish.
The TTD momentum indicator (top of chart) has been bullish for the past three months.
The accumulation - distribution line (bottom of chart) broke out before the price of the stock.
Analysts expect SMA to check in with a 98% surge in net for 2012. They are looking for 59 cents a share, up from 30 cents a year ago.
The highest estimate on the Street is at 60 cents a share. So, most do not expect any surprises.
For the fourth quarter, earnings should leap to 19 cents a share from 1 cent the year before. That could give the stock a kick higher.
SMA will report net on February 21, Thursday.
Looking ahead to 2013, analysts predict a 35% jump in profits to 80 cents a share from the anticipated 59 cents for 2012. The stock sells with a price-earnings ratio of just 13. TTD sees that as low making the stock a good value-growth play.
Net for the first quarter should jump 152% to 18 cents a share from 7 cents a year before. 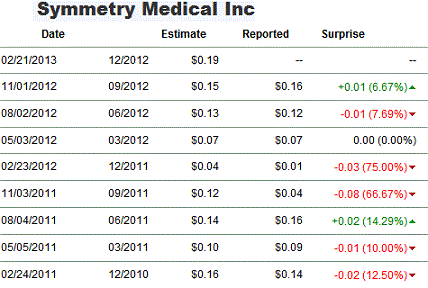
Strategy Opinion: SMA is best suited for aggressive investors. If profits should click on Thursday, one would expect the stock to push higher.
TTD is targeting the stock for a move to 15. A protective stop can be placed near 10.20.
TTD rates SMA a good intermediate-term play provided earnings remain on course.
Sponsorship: Average. A key buyer recently was 5-star rated TFS Market Neutral Fund which purchased 122,963 shares. The largest fund holder is 2-star rated Ariel Investor Fund with a 6.4% stake. It was a recent buyer of 72,474 shares.
SMA has 36.8 million shares outstanding. Institutions hold 92% of the stock.
Insider Activity: Neutral. Insiders have not been active lately. They have received options. Currently, 4 analysts follow the stock, 3 have a buy, the same as three months ago.
Stock Performance Chart with Quarterly Earnings Markers.
| TTD's Breakout Profile
Rating Symmetry Medical Inc. - (SMA) |
| TTD Check List | Bullish | Bearish | Neutral |
| Near 52-week High | YES | ||
| Volume | YES | ||
| Tick Volume | YES | ||
| Price Trend - Daily | YES | ||
| Price Trend - Long Term | YES | ||
| Price Daily Spread | YES | ||
| Base Structure | YES | ||
| Base - A-D | YES | ||
| Earnings-Quarterly | YES | ||
| Earnings-Long Term | YES | ||
| Earnings Outlook | YES | ||
| Industry Group | YES | ||
| Prior Breakout Success | YES | ||
| Fund Sponsorship | YES | ||
| Total Score | 11 | 0 | 3 |
Charts of Selected Breakout Stocks
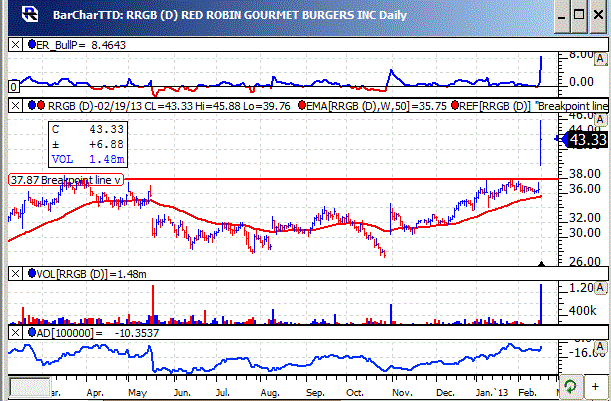
| TTD's Quality Rating of Stock - RRGB - AVERAGE |
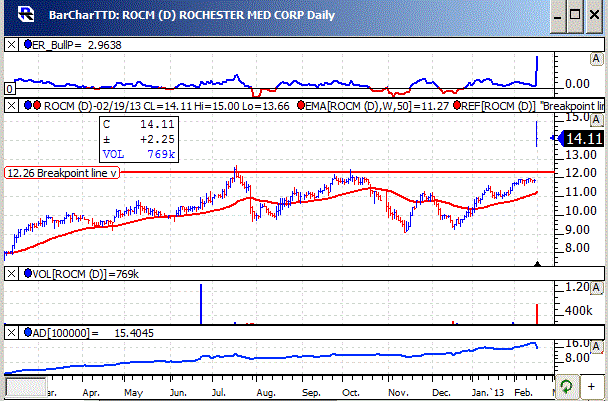
| TTD's Quality Rating of Stock - ROCM - AVERAGE |
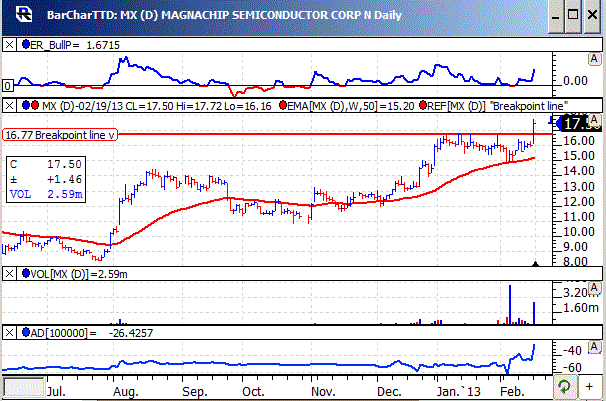
| TTD's Quality Rating of Stock - MX - AVERAGE |
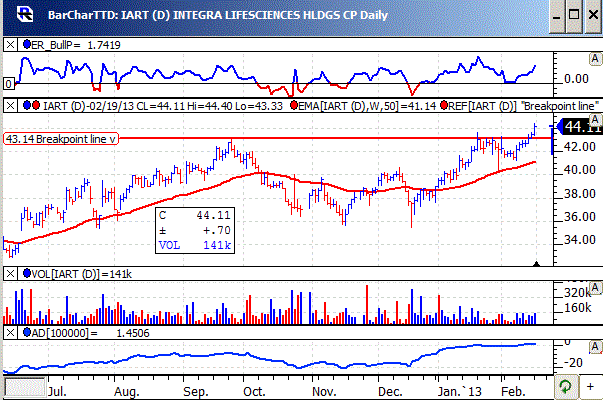
| TTD's Quality Rating of Stock - IART - AVERAGE |

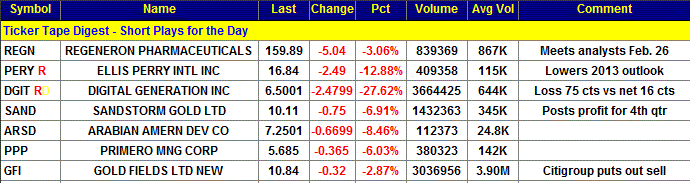
Ticker Tape Digest’s Daily List of “Stocks To Sell or Sell Short” ranks stocks well timed to be sold immediately based on daily trading. The list can be used as an alert to reduce current long-term positions.
Shorts from tape action so far today - 7
Stocks Screened - 8,300
Long-Term Environment for bears: Unfavorable.
Bear Side - Good number of shorts considering market advancing. Gold stocks continue to head lower. Bears be conservative and selective.
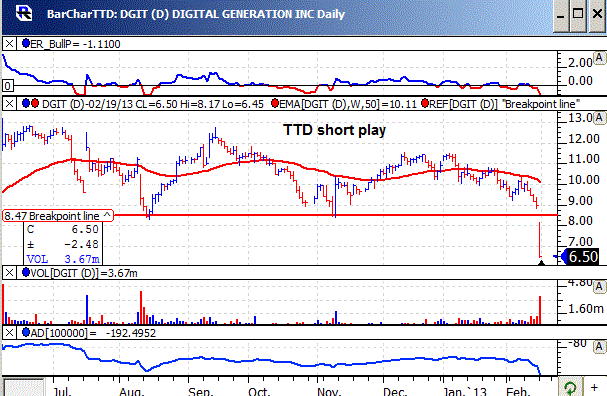
DGIT, based in Irving, Tex., provides digital technology services to broadcasters. Annual revenues: $391 million. DGIT's stock falls sharply today with heavy volume after reporting a fourth quarter loss. So far today, DGIT is trading a heavy 4.5 million shares, seven times its normal daily volume of 644,000 shares. TTD sees more on the downside. 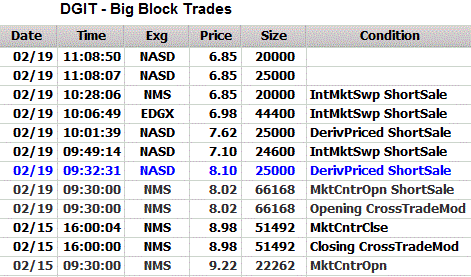
DGIT was highlighted by TTD as a short at our midsession video show on the Web Tuesday.
DGIT reported a fourth quarter loss of 75 cents a share compared with a profit of 16 cents a year ago.
The stock gapped lower in the morning. It hit an intraday low of 6.43. The stock then trended sideways through the afternoon unable to lift.
DGIT's tape action shows the recent block trades.
One can see the price for the blocks falling from $9.22 to $6.85.
A key bearish trade came in the morning when a block of 66,168 shares (duplicated) crossed the tape at $8.02. That was down from the prior block trade at $8.98. The tape showed aggressive institutional selling pressure.
DGIT provides digital technology services that enable the electronic delivery of advertisements, syndicated programs, and video news releases to traditional broadcasters, online publishers and other media outlets.
The Company also provides digital advertising campaign management solutions to media agencies and advertisers.
This year, analysts are forecasting a profit of 56 cents a share compared with a loss of $7.72 in 2012.
DGIT's daily chart shows the stock gapping lower with big volume. The TTD momentum indicator (top of chart) is slightly bearish. The accumulation-distribution line (bottom of chart) is in a sharp down trend indicating clear selling pressure even before the drop on Tuesday.
Strategy Opinion: TTD is targeting DGIT for a decline to 5 within the next few months, or sooner. A protective stop buy can be placed near 7.40.
| TTD's Quality Rating of Stock - DGIT - BELOW AVERAGE |
TTD columnist Leo Fasciocco has covered the stock market for over 20 years. His articles appear in many publications. He is also a speaker at the Intershow conferences. He has been on television and radio. He is author of many educational articles about stock investing and the book “Guide To High-Performance Investing.”

For information to subscribe to the Ticker Tape Digest Services call: B. J. Owen at 1-480-926-1680. Distributed by Corona Publishing Enterprises. Ticker Tape Digest Inc. P.O. Box 2044 Chandler, Az. 85244-2044. TTD “Professional Report” is available on the World Wide Web: $100 per month. Password needed. “TTD Professional“ Faxed is $200 per month. The TTD Daily Report is $39.95. Credit cards accepted.
(The information contained has been prepared from data deemed reliable but there is no guarantee of complete accuracy. Ticker Tape Digest Inc. is not affiliated with any broker, dealer or investment advisor. Nothing in this publication constitutes an offer, recommendation or solicitation to buy or sell any securities. Further research is advised. This report is copyrighted and no redistribution is permitted with out permission.)