Daily - Go to TTD's Chart scroller of Breakout Stocks - Tuesday, February 21, 2017
|
Daily - Go to TTD's Chart scroller of Breakout Stocks - Tuesday, February 21, 2017 |
|
Weekly - Bullish Conservative Investors - Go To TTD Long-Term Plays - Monday, February 21, 2017 |
|
|
Go to Video Show - "How to Make Money With Breakout Stocks |
|---|

By Leo Fasciocco -- TTD
Ticker Tape Digest presents its daily stock market report containing stocks to go long as breakout trades, quick trades, or bargain trades. We also feature stocks under Significant Accumulation that are poised to breakout.
|
Ticker Tape Digest's Daily schedule guide for TTD subscribers 1. Pre-market - check Breakout Watch List and Quick Trades. 2. Morning - (11:30 - 12 A.M.) - check breakout stocks tape and breakout chart slide show. 3. Midday (1 P.M.) check TTD Midsession Report and see market video show. 4. After close (4 P.M.) check final TTD Report for day. Trading Strategies Bullish Aggressive Investors Bullish - "Breakout Stocks" - ideally suited for bull markets and special situation stocks. Potential for large returns. (See Performance) Aggressive Investor Bullish- "Quick Trade Stocks" -ideally suited for entry into top performing issues looking for a small quick profit." (See Performance) Conservative Investors "Bargain Buy Trades for the Long Term." Ideally suited for entry into top performing big cap stocks on pullbacks within overall up trend.(See Performance) Bearish Aggressive Bearish Investors - "Breakdown Stocks" to Sell Short. Ideally suited for bear markets or market pull backs. Potential for large returns (See Performance) |
|---|
The TTD report also contains stocks to short as breakdown plays and as bargain (swing trade) shorts.
Investors should tend to try to go with a strategy that fits with the stock market's trend, unless there is a special situation play.
TTD's Breakout Stocks - Long are
most suitable for aggressive investors seeking ideal entry points into leading stocks, especially during bull markets. They can do extremely well in bull markets with gains of as much as several hundred percent. 
These stocks can also do extremely well during strong market rallies, or if they are in a industry group that is performing very well. They tend to have strong earnings outlooks and are near new-52 week, or all-time highs.
TTD Quick Trade Stocks - Long These are leading issues that have pulled back in recent days, but could move higher soon. They are most suitable for Aggressive Investors willing to trade short term. These stocks will do extremely well during market advances. They have about 74% win rate. During market rally sequences the win rate is even higher. The return is small 3% to 8% in just a few days.
TTD's Bargain Buy Trades - Long - Long Term. These are for conservative bullish Investors These long-term buys are ideally suited for entry into stocks on pull backs within overall up trend. These stocks can give a good return long-term especially during a bull market.
TTD also presents Stocks To Sell or Sell Short. These issues are suitable for aggressive investors willing to take short positions both as trades or for longer-term plays. These stocks will do very well during bear markets or market pull backs.
TTD's Bearish breakdown stocks to sell short. These issues have potential to fall sharply. They often show a technical breakdown and also some fundamental business problem such as weak earnings.
TTD's multi-media updates include a slide-show that presents charts and analysis at midsession. Some times TTD presents feature analysis on stocks and the market. TTD uses Windows Media Files. (WMV).
TTD also presents a "Breakout Watch List" that is up dated daily. This list consists of key stocks in position to breakout. A close watch of this list can put you in the stock just as it breaks out. A good idea is to study the list and be ready to move into a stock quickly as it hits its breakpoint.
TTD often suggests using stop buy orders to enter. It is very important to buy a breakout stock as close as possible to the breakpoint. The idea is to get "elbow room" if the stock should follow through to the upside. This is very important in being successful in making big money with breakout stocks.
It is also essential to have a stop loss strategy for all stocks in which positions are taken. Not every stock will work as expected. It is important for investors to "police" their portfolios and avoid getting trapped in any bad positions.
Quality rating of breakout Two key factors: 1 - Stock near all-time high in price or near a 52-week high. 2 - earnings growth current year is strong. The ideal play is a stock with an Above Average Quality Rating. The stock is near a new high and will have strong earnings. TTD's other ratings are Average and Below Average.
TTD also has special feature sections on Educational Tips on Investing.
To email Mr. Leo Fasciocco leo@tickertapedigest.com. For service, email Beverly Owen owen@tickertapedigest.com. TTD’s Tel: 1-480-926-1680.
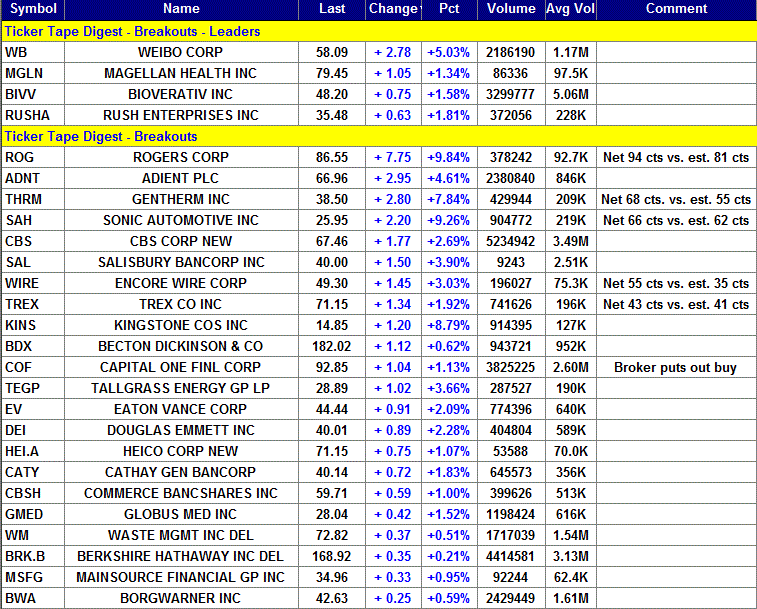
Breakout Stocks
Total Buy Breakouts so far today - 34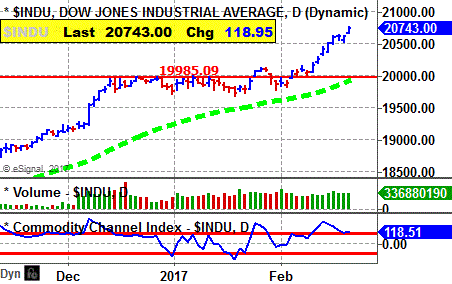
Quality of Breakouts - AVERAGE
Stocks Screened - 8,300
Bull side - Large list of breakouts Tuesday Bulls can be venturesome. Stock market holds its up trend.
(Put mouse on chart to Nasdaq)
Environment for bulls: Bullish
Stock Market Momentum
Market (Daily) - NYSE Bullish, Nasdaq Bullish
Market (Weekly) - NYSE Bullish, Nasdaq Bullish
Market (Monthly) - NYSE Bullish, Nasdaq Bullish
Ticker Tape Digest's
|
TTD's Quality Rating of Stock - MGLN - ABOVE AVERAGE |
MGLN, based in Scottsdale, Az., provides healthcare management services. Annual revenues: $4.8 billion. MGLN breaks out Tuesday from a seven-week, cup-and-handle base. The move carries the stock to a new all-time high. That is bullish. 
So far today, MGLN is trading 86,336 shares. Its average daily volume is 98,000 shares.
The stock is thinly traded. It also has a low beta of 0.70 versus 1.00 for the stock market. 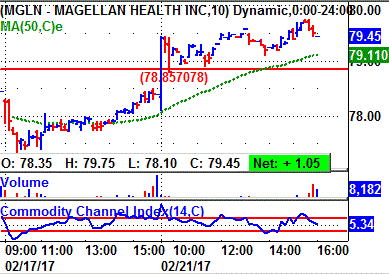
MGLN's 10 minute chart shows the stock moving higher in the morning and then pulling back to just above its breakpoint line.
The stock then worked higher in the afternoon.
Tape Action
MGLN's tape action shows the recent block trades.
One can see the price for the blocks climbing from $78.05 late on Friday to as high as $79.45 Tuesday.
One can see a key bullish trade coming late on Friday when a block of 18,858 shares (duplicated) crossed the tape at $78.40.
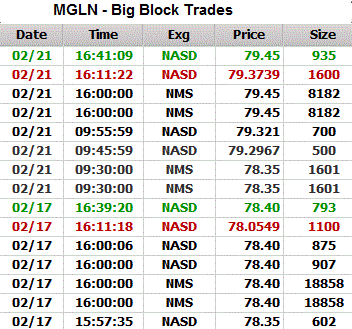 That was up from the prior block trade at $78.35 on 602 shares.
Then near the close Tuesday a block of 8,182 shares (duplicated) crossed at $79.45.
That was up from the prior block at $79.32 on 700 shares.
Business
The company's operations cover healthcare, pharmacy management and corporate.
It is focused on managing pharmacy benefits and other specialty areas of healthcare.
Its Healthcare includes management of behavioral healthcare services and employee assistance program services.
It services cover diagnostic imaging and musculoskeletal management, physical, behavioral and pharmaceutical healthcare for special populations.
It also handles clinical and financial management of pharmaceuticals paid under medical and pharmacy benefit programs.
Charts
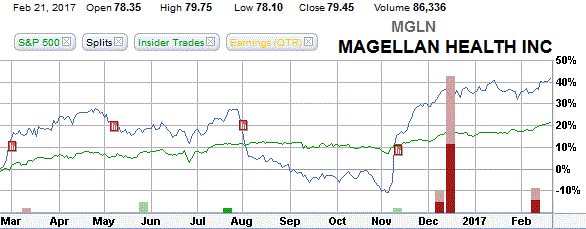
MGLN's 12-month performance chart shows the stock appreciating 42% versus a gain of 22% for the stock market.
The stock moved sharply higher after its recent earnings report. It will be reporting quarterly numbers soon.
Insiders have been recent buyers using stock options at $40 to $53 a share late last year. They were sellers $73 to $76 a share.
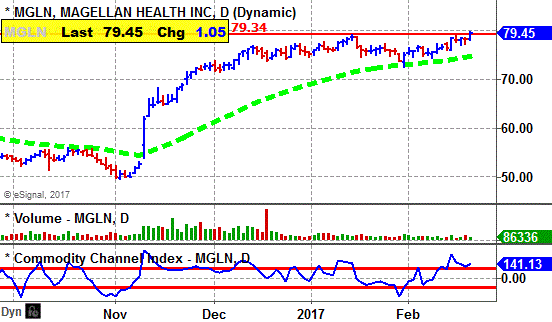
MGLN's daily chart shows the stock climbing from $50 back in November to a peak near $78 by January.
The stock then formed a base above its rising 50-day moving average line.
The breakout Tuesday clears the base.
The stock's CCI momentum indicator (bottom of chart) is solidly bullish.
Earnings Outlook
MGLN is expected to report 2016 earnings on Feb. 24 - this week.
Analysts expect a 160% surge in 2016 net to $3.15 a share from $1.21 in 2015.
Net for the fourth quarter should show a 22% increase to $1.37 a share from $1.12 the year before.
The highest estimate on the Street is at $1.44 a share. MGLN came in with a big upside surprise in earnings three out of the past four quarters.
Looking out to 2017, the Street is predicting a 36% jump in net to $4.30 a share from the anticipated $3.15 for 2016.
The stock sells with a price-earnings ratio of 25 based on 2016 estimated net. TTD sees that as attractive for value-growth investors.
Net for the first quarter of 2017 should be up 20% to 80 cents a share from 67 cents the year before.
Strategy Opinion: TTD is targeting MGLN for a move to $96 off this breakout. A protective stop can be placed near $75.
TTD rates MGLN a good intermediate-term play provided earnings meet expectations.
Suitability: Average Bulls
TTD's special research of MGLN's Prior Performance after a Breakout:
TTD's research shows that recently (see table) MGLN has scored just modest gains off a breakout. The stock has had a sharp run up the past four months. However, it has put down a good tight base.
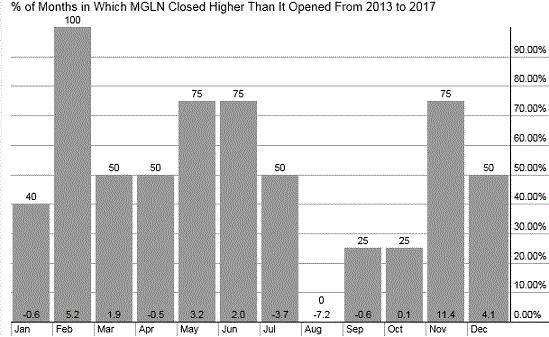
Seasonally February is MGLN's best month. That is a plus.
Stock's Prior Performance After A Breakout
|
Stock's % Change from Breakout to peak - prior to cut below 50-day M/A. |
Date of Breakout |
Break point Price |
Stocks Price Peak after Breakout - prior to cut below 50-day M/A |
Date Trade Closed |
|
3% |
1/10/2017 | 76.99 | 79.45 | Still in play |
|
13% |
2/27/2015 | 63.10 | 71.72 | 4/28/2015 |
|
2% |
2/5/2014 | 61.57 | 62.95 | 7/7/2014 |
|
9% |
6/10/2913 |
54.63 |
59.57 |
7/25/2013 |
|
10% |
9/1/2010 | 45.11 | 49.57 |
12/6/2010 |
(In actual trading, entry and exit points could vary depending on broker execution.
Also, ideal are breakouts to a new 52-week high or better, perhaps all-time highs.)
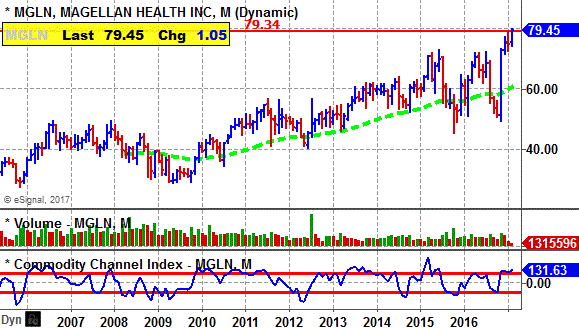
Stock's Long-term Chart
Stock's Performance Chart with Quarterly Earnings Markers vs. S&P 500
Insider Buying in Green - Insider Selling in Red
Stock's Monthly Seasonal Performance Chart - Past 5 Years
Showing % Months UP and % Change
Charts of Selected Breakout Stocks
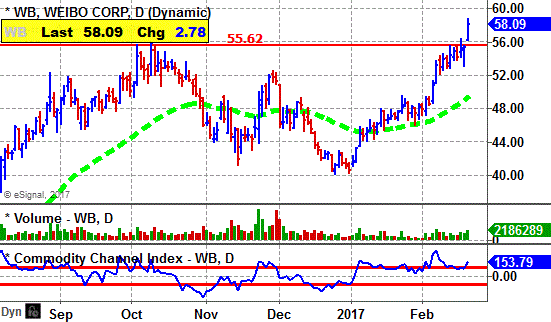
| TTD's Quality Rating of Stock - WB - ABOVE AVERAGE |
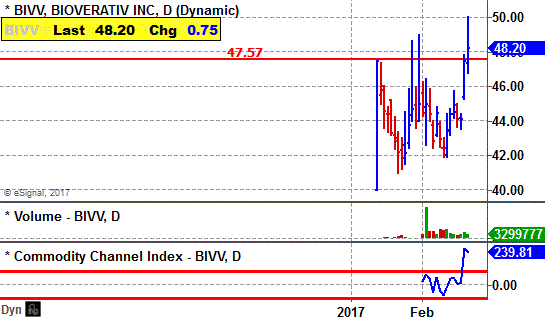
| TTD's Quality Rating of Stock - BIVV - ABOVE AVERAGE |
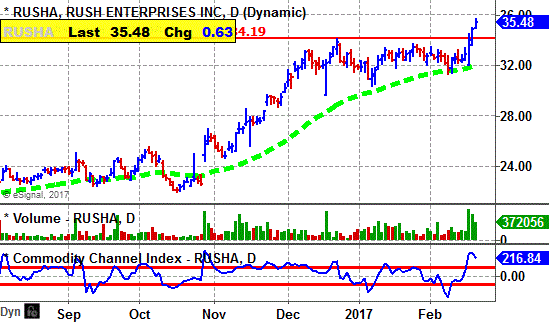
| TTD's Quality Rating of Stock -RUSHA - ABOVE AVERAGE |
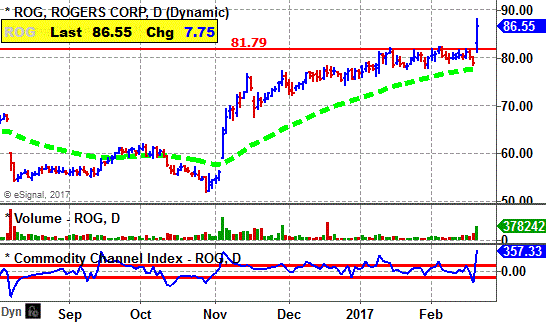
| TTD's Quality Rating of Stock - ROG - AVERAGE |

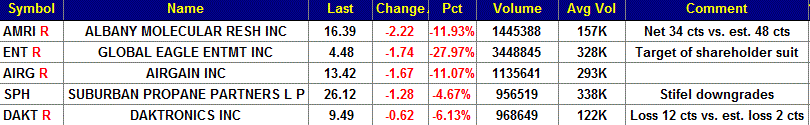
Ticker Tape Digest’s Daily List of “Stocks To Sell or Sell Short” ranks stocks well timed to be sold immediately based on daily trading. The list can be used as an alert to reduce current long-term positions.
Shorts from tape action so far today - 5
Stocks Screened - 8,300
Long-Term Environment for bears: Unfavorable.
Bear Side - Small list of shorts Tuesday as stock market rallies. Bears be conservative. Stock market holds up trend.
TTD's short from Thursday was Tripadvisor Inc. (TRIP) at 47.09. It has declined to 46.84.
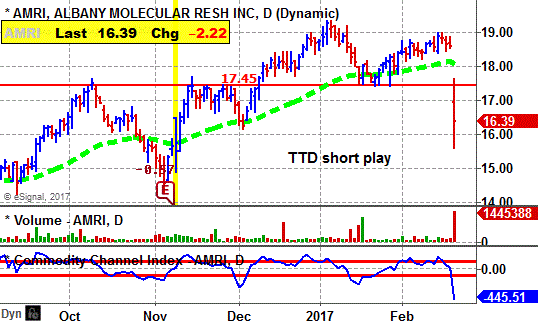
AMRI, based in Albany, N.Y., provides contract drug research in the U.S., Europe and Asia. Annual revenues: $505 million. AMRI's stock falls sharply with heavy volume Tuesday. The company reported disappointing earnings. TTD sees more on the downside. 
TTD highlighted AMRI as a short at our midsession video show on the Web Tuesday.
The company reported fourth quarter net of 34 cents a share. That was well below the consensus estimate of 48 cents a share.
It was also below the lowest estimate on the Street among three analysts. So, that is very bearish.
So far on Tuesday, AMRI is trading a heavy 1.4 million shares, seven times its average daily volume of 157,000 shares.
Tape Action
AMRI's tape action shows the recent block trades. One can see the price for the blocks falling from $18.69 in the prior session to as low as $15.63.
A key bearish trade came in the morning when a block of 11,400 shares crossed the tape at $16.67.
That was below the prior block trade at $18.61 on 22,787 shares in the prior session.
Business
AMRI provides drug discovery, development, and manufacturing services. The company operates through three segments: Discovery and Development Services , Active Pharmaceutical Ingredients and Drug Product Manufacturing.
The development group covers drug lead discovery, optimization, drug development and small-scale commercial manufacturing.
The API unit includes pilot to commercial scale manufacturing of active drugs and intermediates and high potency and controlled substance manufacturing.
The drug product manufacturing includes formulation and process development through commercial scale production of complex liquid-filled and lyophilized injectable formulas.
Earnings
Analysts were looking for net of 95 cents for 2016. However, AMRI came in with just 81 cents a share. That compared with a loss of 7 cents in 2015.
For 2017, the Street has been forecasting a profit of $1.30 a share. However, the company has now cut that forecast down to $1.08 to $1.20 a share.
Charts
AMRI's stock was acting well. The drop Tuesday comes as a surprise. The volume is heavy and the stock cuts below near-term support. The stock's CCI momentum indicator is extremely bearish.
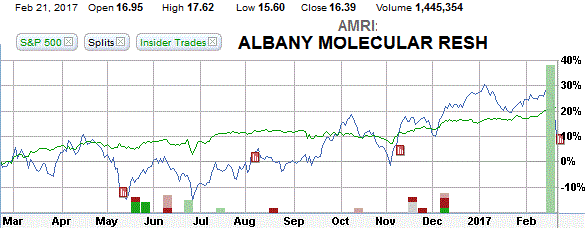
AMRI's 12-month performance chart shows the stock up 5% compared with a gain of 21% for the stock market.
Insiders were given stock options late in 2016 (see green bar on performance chart). They have not exercised them yet.
Strategy Opinion: TTD is targeting AMRI for a decline to $12.50 within the next few months, or sooner.
A protective stop buy can be placed near $17.90.
Suitability: Aggressive Bears.
| TTD's Quality Rating of Stock - AMRI - BELOW AVERAGE |
Stock Performance Chart with Quarterly Earnings Markers vs. S&P 500
Insider Buying in Green - Insider Selling in Red
TTD columnist Leo Fasciocco has covered the stock market for over 30 years. His articles appear in many publications. He is also a speaker at the Intershow conferences. He has been on television and radio. He is author of many educational articles about stock investing and the book “Guide To High-Performance Investing.”

For information to subscribe to the Ticker Tape Digest Services call: Beverly Owen at 1-480-926-1680. Distributed by Corona Publishing Enterprises. Ticker Tape Digest Inc. P.O. Box 2044 Chandler, Az. 85244-2044. TTD “Professional Report” is available on the World Wide Web: $100 per month. Password needed. “TTD Professional“ Faxed is $200 per month. The TTD Daily Report is $39.95. Credit cards accepted.
(The information contained has been prepared from data deemed reliable but there is no guarantee of complete accuracy. Ticker Tape Digest Inc. is not affiliated with any broker, dealer or investment advisor. Nothing in this publication constitutes an offer, recommendation or solicitation to buy or sell any securities. Further research is advised. This report is copyrighted and no redistribution is permitted with out permission.)