Daily - Go to TTD's Tape of Stock Charts - Wednesday, February 25, 2015
|
Daily - Go to TTD's Tape of Stock Charts - Wednesday, February 25, 2015 |
|
Weekly - Bullish Conservative Investors - Go To TTD Long-Term Plays - Monday, February 23, 2015 |
|
Go to Video Show - "How to Make Money With Breakout Stocks" |
|---|

By Leo Fasciocco -- TTD
Ticker Tape Digest presents its daily stock market report containing stocks to go long as breakout trades, quick trades, or bargain trades. We also feature stocks under Significant Accumulation that are poised to breakout.
|
Ticker Tape Digest's Daily schedule guide for TTD subscribers 1. Pre-market - check Breakout Watch List and Quick Trades. 2. Morning - (11:30 - 12 A.M.) - check breakout stocks tape and breakout chart slide show. 3. Midday (1 P.M.) check TTD Midsession Report and see market video show. 4. After close (4 P.M.) check final TTD Report for day. Trading Strategies Bullish Aggressive Investors Bullish - "Breakout Stocks" - ideally suited for bull markets and special situation stocks. Potential for large returns. (See Performance) Aggressive Investor Bullish- "Quick Trade Stocks" -ideally suited for entry into top performing issues looking for a small quick profit." (See Performance) Conservative Investors "Bargain Buy Trades for the Long Term." Ideally suited for entry into top performing big cap stocks on pullbacks within overall up trend.(See Performance) Bearish Aggressive Bearish Investors - "Breakdown Stocks" to Sell Short. Ideally suited for bear markets or market pull backs. Potential for large returns (See Performance) |
|---|
The TTD report also contains stocks to short as breakdown plays and as bargain (swing trade) shorts.
Investors should tend to try to go with a strategy that fits with the stock market's trend, unless there is a special situation play.
TTD's Breakout Stocks - Long are
most suitable for aggressive investors seeking ideal entry points into leading stocks, especially during bull markets. They can do extremely well in bull markets with gains of as much as several hundred percent. 
These stocks can also do extremely well during strong market rallies, or if they are in a industry group that is performing very well. They tend to have strong earnings outlooks and are near new-52 week, or all-time highs.
TTD Quick Trade Stocks - Long These are leading issues that have pulled back in recent days, but could move higher soon. They are most suitable for Aggressive Investors willing to trade short term. These stocks will do extremely well during market advances. They have about 74% win rate. During market rally sequences the win rate is even higher. The return is small 3% to 8% in just a few days.
TTD's Bargain Buy Trades - Long - Long Term. These are for conservative bullish Investors These long-term buys are ideally suited for entry into stocks on pull backs within overall up trend. These stocks can give a good return long-term especially during a bull market.
TTD also presents Stocks To Sell or Sell Short. These issues are suitable for aggressive investors willing to take short positions both as trades or for longer-term plays. These stocks will do very well during bear markets or market pull backs.
TTD's Bearish breakdown stocks to sell short. These issues have potential to fall sharply. They often show a technical breakdown and also some fundamental business problem such as weak earnings.
TTD's multi-media updates include a slide-show that presents charts and analysis at midsession. Some times TTD presents feature analysis on stocks and the market. TTD uses Windows Media Files. (WMV).
TTD also presents a "Breakout Watch List" that is up dated daily. This list consists of key stocks in position to breakout. A close watch of this list can put you in the stock just as it breaks out. A good idea is to study the list and be ready to move into a stock quickly as it hits its breakpoint.
TTD often suggests using stop buy orders to enter. It is very important to buy a breakout stock as close as possible to the breakpoint. The idea is to get "elbow room" if the stock should follow through to the upside. This is very important in being successful in making big money with breakout stocks.
It is also essential to have a stop loss strategy for all stocks in which positions are taken. Not every stock will work as expected. It is important for investors to "police" their portfolios and avoid getting trapped in any bad positions.
Quality rating of breakout Two key factors: 1 - Stock near all-time high in price or near a 52-week high. 2 - earnings growth current year is strong. The ideal play is a stock with an Above Average Quality Rating. The stock is near a new high and will have strong earnings. TTD's other ratings are Average and Below Average.
TTD also has special feature sections on Educational Tips on Investing.
To email Mr. Leo Fasciocco leo@tickertapedigest.com.For service, email Beverly Owen owen@tickertapedigest.com. TTD’s Tel: 1-480-926-1680.
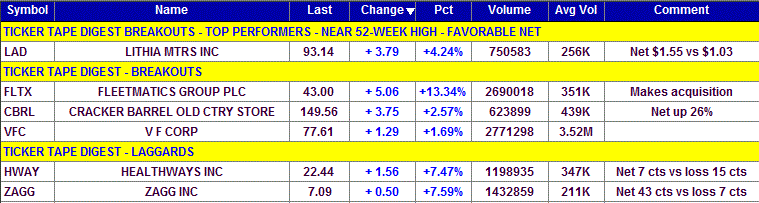
Breakout Stocks
Total Buy Breakouts so far today - 6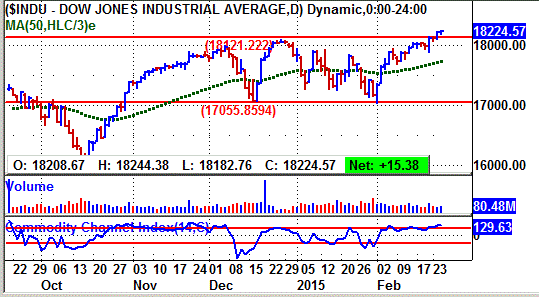
Overall Quality of Breakouts - AVERAGE
Stocks Screened - 8,300
Bull side - Selective list of breakout stocks today, but some interesting plays. Stock market holds up trend.
(Put mouse on Dow chart to see Nasdaq chart)
Long Term Environment for bulls: Favorable
Stock Market Momentum
Market (Daily) - NYSE Bullish, Nasdaq Bullish
Market (Weekly) - NYSE Bullish, Nasdaq Bullish
Market (Monthly) - NYSE Bullish, Nasdaq Bullish
Ticker Tape Digest's
|
TTD's Quality Rating of Stock - LAD - ABOVE AVERAGE |
LAD, based in Medford, Ore., sells new and used cars. Annual revenues: $4.6 billion. LAD's stock breaks out from a 10-week flat base Wednesday and nears a new all-time high. The stock's push higher was triggered by a report of strong earnings for the fourth quarter, which topped Street estimates. 
TTD highlighted LAD as a breakout at our midsession video show on the Web Wednesday.
So far today, LAD is trading a heavy 750,583 shares, triple its average daily volume e of 256,000 shares.
LAD's stock surge higher in the morning to clear its breakpoint line (see 10-minute chart).
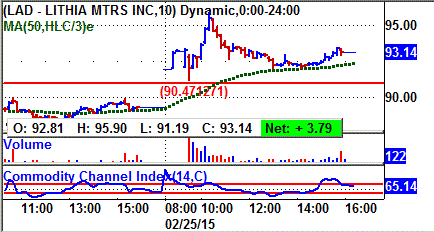 The stock reached an intraday peak of 95.90.
The stock then pulled back and lifted modestly in the final hour of trading.
LAD come in with fourth quarter net up 45% to $1.42 a share. That topped the Street consensus estimate of $1.19 a share.
It also surpassed the highest estimate by analysts of $1.24 a share.
As TTD has noted, when a company can surpass the highest estimate, the stock has the potential to move higher for the next few weeks. That is because analysts need to adjust their earnings projections.
LAD's tape action shows the recent block trades.
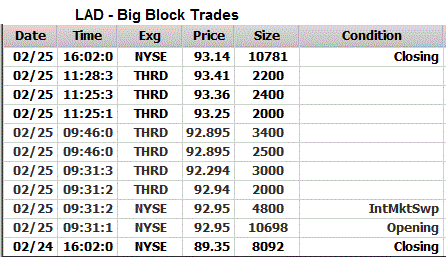 One can see the price for the blocks climbing from $89.35 in the prior session to as high as $93.41.
A key bullish trade came in the morning when a block of 10,698 shares crossed at $92.95.
That was up from the prior block at $89.35 on 8,092 shares.
LAD is an auto franchisee and retailer of used and new cars.
The company has 96 stores
LAD also provides service maintenance and financial services.
The company also exchanges vehicles with other dealers from time to time to accommodate customer demand and to balance inventory
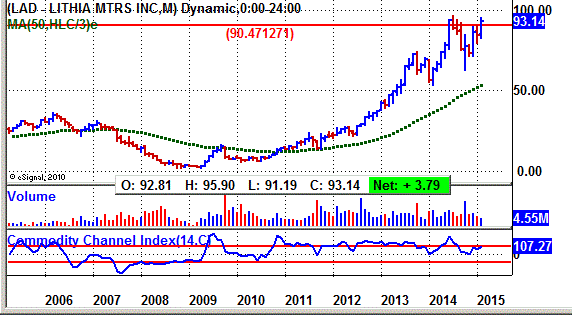
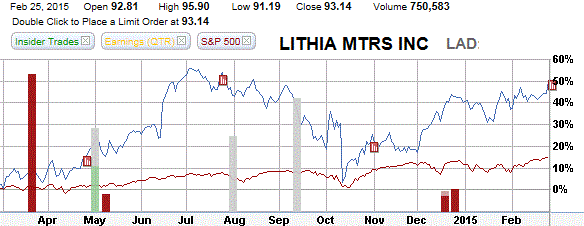
LAD's 12-month performance chart shows the stock appreciating 48% the past 12 months. That is better than the 15% gain for the S&P 500 index.
LAD's long-term chart shows the stock decline to a low of $2.10 in 2008 due to the bear market.
However, since then the stock has been driving higher. It just needs to get over 97.20 to make a new high. If it can do that, LAD could draw in more buying.
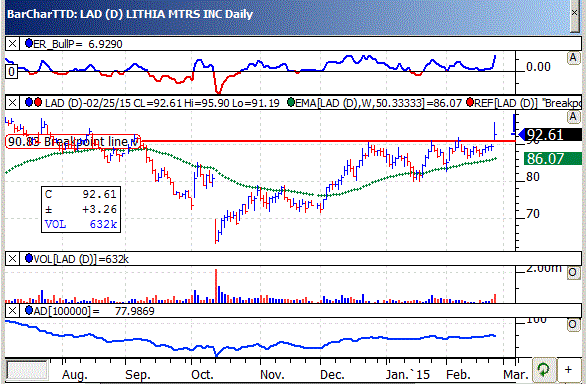
LAD's daily chart shows the stock climbing from 63 back in October to a peak near 90 by December.
The stock then put down a flat base with a "wedge" to the upside. That means the pullback after mid-January were less. That is very bullish.
The breakout Wednesday comes with a gap move, widening of the daily spread and expanding volume.
That is ideal.
LAD's TTD momentum indicator (top of chart) is strongly bullish.
The accumulation - distribution line (bottom of chart) is working higher and compliments the price action since October.
This year, analysts are forecasting a 23% increase LAD's earnings to $6.02 a share. The stock sells with a price-earnings ratio of 15. TTD sees that as attractive for value-growth investors.
Profits for the upcoming first quarter are projected to rise 19% to $1.23 a share from $1.03 a year ago. 
TTD sees good chances for an earnings upside surprise.
TTD's table shows LAD topping the Street estimate the past 12 quarters - and in some cases by a significant amount.
That is impressive.
Strategy Opinion: TTD is targeting LAD for a move to 110 off this breakout.
A protective stop can be placed near 83.
TTD rates LAD a good intermediate-term play due to its solid earnings growth outlook.
Sponsorship: Very Good. A key fund buyer recently was the Hodges Small Cap Fund, 5-star rated, which purchased 110,000 shares. It has a 1.6% stake.
Also, the 3-star rated Goldman Sachs Small Cap Value Fund was a recent purchaser of 280,918 shares. It is the second largest fund holder with a 1.7% stake.
LAD has 26.3 million shares outstanding. Institutions hold 96% of the stock and insiders 2%.
Insider Activity: Neutral. Insiders were light sellers in December at $79 to $83. They were buyers using stock options at $7.87.
Currently, nine analysts follow the stock, 8 have a buy, down from 10 three months ago. Furey Research Partners put out a buy in January.
LAD has a book value of $23.90
Stock Performance Chart with Quarterly Earnings Markers.
| TTD's Breakout Profile
Rating Lithia Motors Inc. - (LAD) |
| TTD Check List | Bullish | Bearish | Neutral |
| Near 52-week High | YES | ||
| Volume | YES | ||
| Tick Volume | YES | ||
| Price Trend - Daily | YES | ||
| Price Trend - Long Term | YES | ||
| Price Daily Spread | YES | ||
| Base Structure | YES | ||
| Base - A-D | YES | ||
| Earnings-Quarterly | YES | ||
| Earnings-Long Term | YES | ||
| Earnings Outlook | YES | ||
| Industry Group | YES | ||
| Prior Breakout Success | YES | ||
| Fund Sponsorship | YES | ||
| Total Score | 13 | 0 | 1 |
Charts of Selected Breakout Stocks
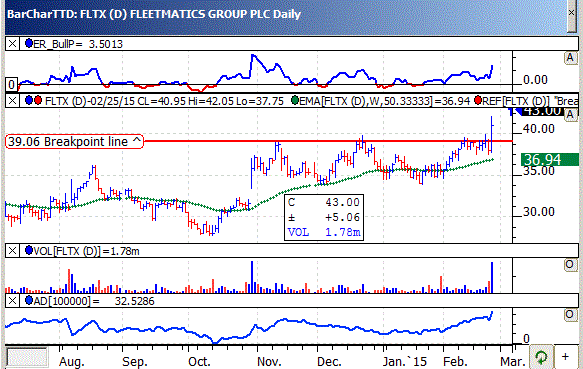
| TTD's Quality Rating of Stock - FLTX - AVERAGE |
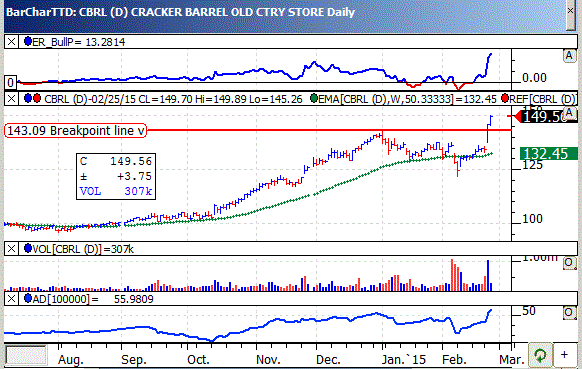
| TTD's Quality Rating of Stock - CBRL - AVERAGE |
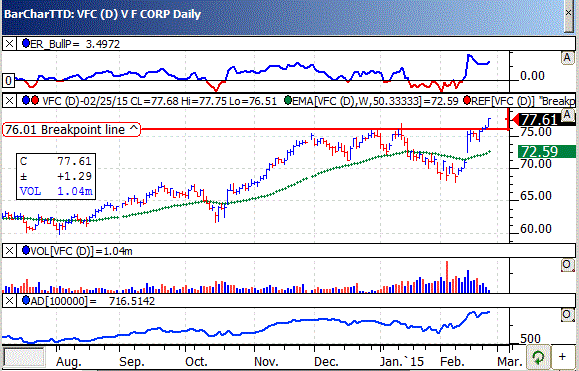
| TTD's Quality Rating of Stock - VFC - AVERAGE |
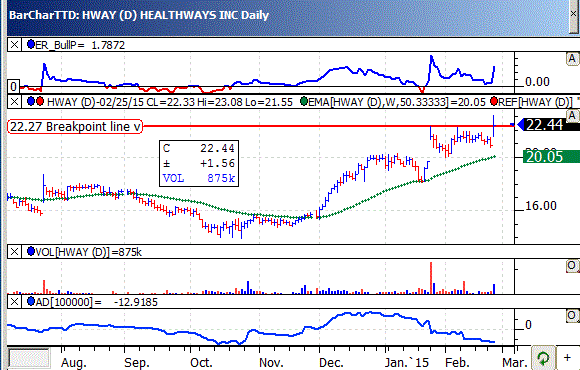
| TTD's Quality Rating of Stock - HWAY - BELOW AVERAGE |

Ticker Tape Digest’s Daily List of “Stocks To Sell or Sell Short” ranks stocks well timed to be sold immediately based on daily trading. The list can be used as an alert to reduce current long-term positions.
Shorts from tape action so far today - 3
Stocks Screened - 8,300
Long-Term Environment for bears: Unfavorable.
Bear Side - Small list of shorts today. Stock market holds up trend. Bears remain conservative.
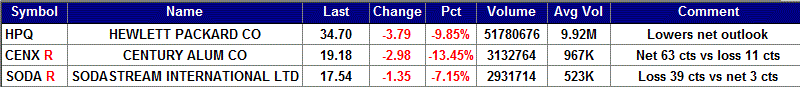
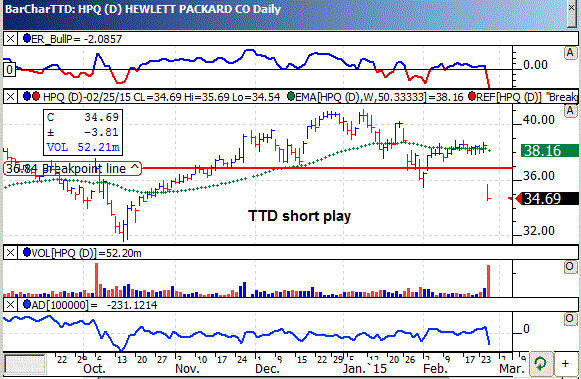
HPQ, based in Palo Alto, Ca., makes computers and printers along with other computing products. Annual revenues: $111.5 billion. HPQ's stock falls sharply today after the company made a disappointing earnings forecast. 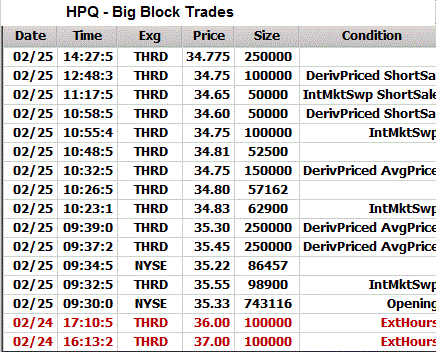
So far today, HPQ is trading a heavy 58.6 million shares, six times its average daily volume of 9.9 million shares.
TTD highlighted HPQ as a short at our midsession video show on the Web Wednesday.
HPQ's stock fell sharply in the morning. It hit a low in the morning of 34.54. The stock then trended mostly sideways into the afternoon.
Then late in the day, HPQ weakened further falling to an intraday low of 34.41.
HPQ's tape action shows the recent block trades.
One can see the price for the blocks falling from $37 in the prior session to as low as $34.60.
A key bearish trade came in the morning when a massive block of 743,116 shares crossed the tape at $35.33.
That was down from the prior block at $36 on 100,000 shares.
HPQ said earnings for the second quarter would be 84 to 88 cents a share. The Street was looking for 95 cents a share.
For the year, the company projected net at $3.53 to $3.73. The Street was projecting $3.95 a share.
HPQ makes computing and imaging products for business and home. Its major businesses include imaging and printing Systems, computers and information technology services
HPQ's daily chart shows the stock gapping lower on big volume and cutting below technical support. The stock's TTD momentum indicator (top of chart) is now strongly bearish.
Strategy Opinion: TTD is targeting HPQ for a decline to 29 within the next few months, or sooner. A protective stop buy can be placed near 35.90.
| TTD's Quality Rating of Stock - HPQ - AVERAGE |
TTD columnist Leo Fasciocco has covered the stock market for over 20 years. His articles appear in many publications. He is also a speaker at the Intershow conferences. He has been on television and radio. He is author of many educational articles about stock investing and the book “Guide To High-Performance Investing.”

For information to subscribe to the Ticker Tape Digest Services call: Beverly Owen at 1-480-926-1680. Distributed by Corona Publishing Enterprises. Ticker Tape Digest Inc. P.O. Box 2044 Chandler, Az. 85244-2044. TTD “Professional Report” is available on the World Wide Web: $100 per month. Password needed. “TTD Professional“ Faxed is $200 per month. The TTD
Daily Report is $39.95. Credit cards accepted.
(The information contained has been prepared from data deemed reliable but there is no guarantee of complete accuracy. Ticker Tape Digest Inc. is not affiliated with any broker, dealer or investment advisor. Nothing in this publication constitutes an offer, recommendation or solicitation to buy or sell any securities. Further research is advised. This report is copyrighted and no redistribution is permitted with out permission.)
