Daily - Go to TTD's Tape of Stock Charts - Wednesday. February 26, 2014
|
Daily - Go to TTD's Tape of Stock Charts - Wednesday. February 26, 2014 |
|
Weekly - Bullish Conservative Investors - Go To TTD Long-Term Plays - Monday, February 24, 2013 |
|
Go to Video Show - "How to Make Money With Breakout Stocks" |
|---|

By Leo Fasciocco -- TTD
Ticker Tape Digest presents its daily stock market report containing stocks to go long as breakout trades, quick trades, or bargain trades. We also feature stocks under Significant Accumulation that are poised to breakout.
|
Ticker Tape Digest's Daily schedule guide for TTD subscribers 1. Pre-market - check Breakout Watch List and Quick Trades. 2. Morning - (11:30 - 12 A.M.) - check breakout stocks tape and breakout chart slide show. 3. Midday (1 P.M.) check TTD Midsession Report and see market video show. 4. After close (4 P.M.) check final TTD Report for day. Trading Strategies Bullish Aggressive Investors Bullish - "Breakout Stocks" - ideally suited for bull markets and special situation stocks. Potential for large returns. (See Performance) Aggressive Investor Bullish- "Quick Trade Stocks" -ideally suited for entry into top performing issues looking for a small quick profit." (See Performance) Conservative Investors "Bargain Buy Trades for the Long Term." Ideally suited for entry into top performing big cap stocks on pullbacks within overall up trend.(See Performance) Bearish Aggressive Bearish Investors - "Breakdown Stocks" to Sell Short. Ideally suited for bear markets or market pull backs. Potential for large returns (See Performance) |
|---|
The TTD report also contains stocks to short as breakdown plays and as bargain (swing trade) shorts.
Investors should tend to try to go with a strategy that fits with the stock market's trend, unless there is a special situation play.
TTD's Breakout Stocks - Long are most suitable for aggressive investors seeking ideal entry points into leading stocks, especially during bull markets. They can do extremely well in bull markets with gains of as much as several hundred percent.
These stocks can also do extremely well during strong market
rallies, or if they are in a industry group that is performing very well. They tend to have strong earnings outlooks and are near new-52 week, or all-time highs. 
TTD Quick Trade Stocks - Long These are leading issues that have pulled back in recent days, but could move higher soon. They are most suitable for Aggressive Investors willing to trade short term. These stocks will do extremely well during market advances. They have about 74% win rate. During market rally sequences the win rate is even higher. The return is small 3% to 8% in just a few days.
TTD's Bargain Buy Trades - Long - Long Term. These are for conservative bullish Investors These long-term buys are ideally suited for entry into stocks on pull backs within overall up trend. These stocks can give a good return long-term especially during a bull market.
TTD also presents Stocks To Sell or Sell Short. These issues are suitable for aggressive investors willing to take short positions both as trades or for longer-term plays. These stocks will do very well during bear markets or market pull backs.
TTD's Bearish breakdown stocks to sell short. These issues have potential to fall sharply. They often show a technical breakdown and also some fundamental business problem such as weak earnings.
TTD's multi-media updates include a slide-show that presents charts and analysis at midsession. Some times TTD presents feature analysis on stocks and the market. TTD uses Windows Media Files. (WMV).
TTD also presents a "Breakout Watch List" that is up dated daily. This list consists of key stocks in position to breakout. A close watch of this list can put you in the stock just as it breaks out. A good idea is to study the list and be ready to move into a stock quickly as it hits its breakpoint.
TTD often suggests using stop buy orders to enter. It is very important to buy a breakout stock as close as possible to the breakpoint. The idea is to get "elbow room" if the stock should follow through to the upside. This is very important in being successful in making big money with breakout stocks.
It is also essential to have a stop loss strategy for all stocks in which positions are taken. Not every stock will work as expected. It is important for investors to "police" their portfolios and avoid getting trapped in any bad positions.
Quality rating of breakout Two key factors: 1 - Stock near all-time in price or near a 52-week high. 2 - earnings growth current year is strong. The ideal play is a stock with an Above Average Quality Rating. The stock is near a new high and will have strong earnings. TTD's other ratings are Average and Below Average.
TTD also has special feature sections on Educational Tips on Investing.
To email Mr. Leo Fasciocco leo@tickertapedigest.com.For service, email Beverly Owen owen@tickertapedigest.com. TTD’s Tel: 1-480-926-1680.
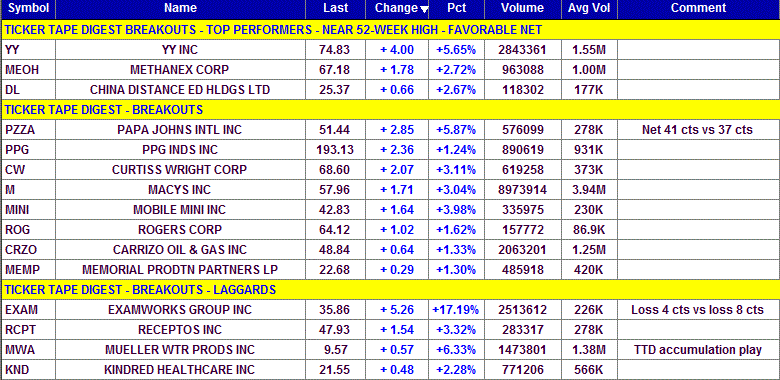
Breakout Stocks
Total Buy Breakouts so far today - 15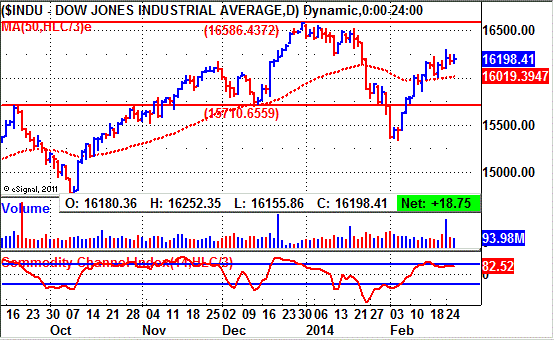
Overall Quality of Breakouts - AVERAGE
Stocks Screened - 8,300
Bull side - Breakout list large with some good looking plays, especially Chinese stocks. Stock market rallying but looking like its loosing its pep. Bulls be selective.
(Put mouse on Dow chart to see Nasdaq chart)
Long Term Environment for bulls: Favorable
Stock Market Momentum
Market (Daily) - NYSE Bearish, Nasdaq Bullish
Market (Weekly) - NYSE Bullish, Nasdaq Bullish
Market (Monthly) - NYSE Bearish, Nasdaq Bullish
Ticker Tape Digest's
|
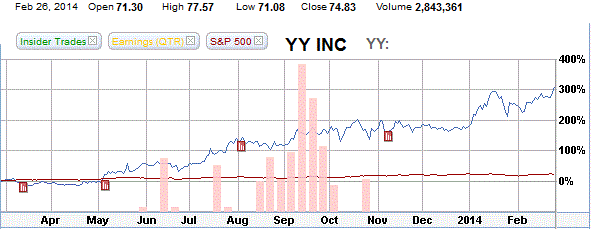
TTD's Quality Rating of Stock - YY - ABOVE AVERAGE |
YY, based in China, operates a social internet platform. Annual revenues: $1.5 billion. YY's stock, a leader, breaks out today from a 7-week flat base. The move carries the stock to a new all-time high. It came public in late 2012. So far today, YY is trading a heavy 2.8 million shares, about double its average daily volume of 1.6 million shares. 
YY is a leader among the strong Chinese internet stocks. TTD highlighted YY as a breakout at our midsession video show on the Web. The stock was also featured back in January on TTD.
The stock pushed higher in the morning and cut across its breakpoint line. In the early afternoon, it fell back but held above the breakpoint line. 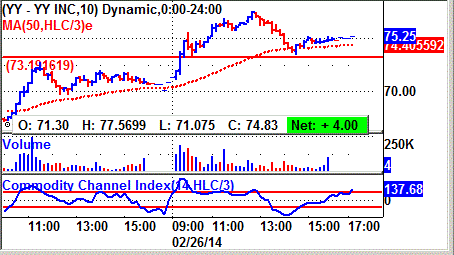
In the late afternoon, it pushed a bit higher. (see 10-minute chart)
TTD's clip of the tape shows YY's recent big block trades.
One can see the price for the blocks advancing from $70.83 in the prior session to as high as $76.91 Wednesday.
A key bullish trade came in the morning when a block of 11,795 shares (duplicated) crossed the tape at $71.30.
That was up from the prior block at $70.83. The tape action then showed aggressive institutional buying in the following block trades. 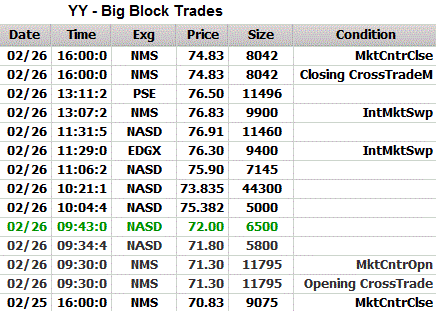
YY did show some profit taking near the close when a block of 8,042 shares (duplicated) crossed the tape at $74.83. That was down from the prior block at $76.50.
YY provides online group activities through voice, text and video.
The company's Platform consists of YY Client, the YY.com and Duowan.com web portals, Mobile YY and Web-based YY.
YY is based in Guangzhou, China.
YY's 12-month performance chart shows the stock soaring 305% versus a 21% gain for the S&P 500 index.
YY is one of the strongest performing stocks in the market.
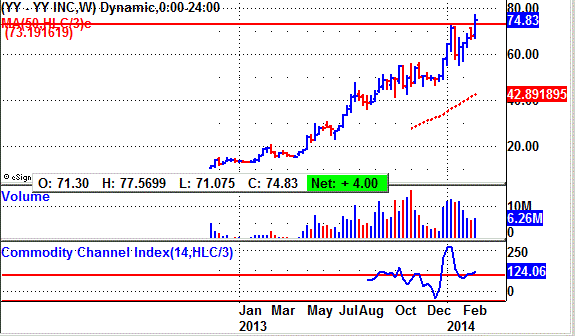
YY's long-term chart shows the stock coming public in late 2012 and trading around $11. The stock has moved up steadily making a sevenfold move.
It has had five breakout sequences that have worked. That is impressive. This would be the sixth. So, the stock has made multi-stage bases.
YY's daily chart shows the stock advancing from 32 back in July to around 73 by January.. 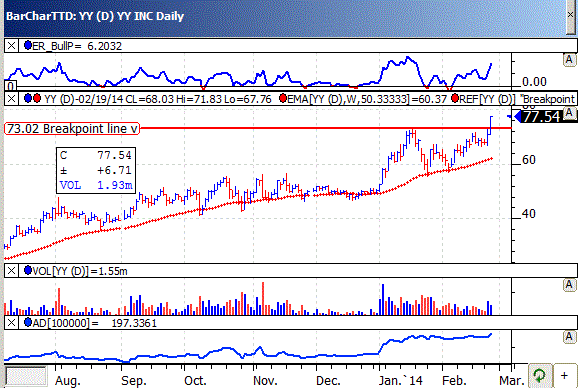
The stock then set up its base above its rising 50-day moving average line. That is bullish showing the stock is still in an up trend.
The breakout and the prior session's move comes with good buying. Today's push shows a widening of the daily trading spread, which is bullish.
The stock's TTD momentum indicator (top of chart) is strongly bullish.
The accumulation - distribution line (bottom of chart) compliments the price action and has broken out to the upside.
YY's earnings outlook is strong.
The company will report 2013 earnings on Tuesday, March 4.
For 2013, analysts are forecasting a 431% surge in profits to$1.54 a share from 29 cents a year ago. Analysts have been raising their estimates.
The stock sells with a price-earnings ratio of 50 based on 2013 net.. TTD sees that as reasonable.
Going out to 2014, Wall Street looks for a 58% gain in net to $2.44 a share from the anticipated $1.54 for 2013. The Street has been raising its estimates. Based on 2014 net, the stock has a p/e ratio of 31.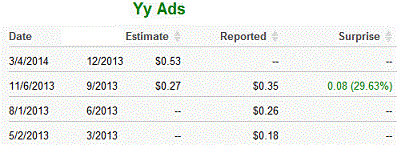
Strategy Opinion: In our prior report of January TTD was targeting YY for a move to 70 off a breakout. It hit that. Now, TTD is targeting YY for a push to 90 off this breakout. A protective stop can be placed near 72 giving it some room.
A protective stop can be placed near 54.
TTD rates YY an excellent intermediate-term play provided earnings remain on course.
Sponsorship: Very Good. The largest fund holder and a key buyer recently was American Century Intl. Discovery Fund with a 0.30% stake. The two-star rated fund was a recent buyer of 56,260 shares.
The largest fund buyer recently was the Laudus Intl. MarketMasters Fund, 4-star rated, which purchased 57,600 shares as a new position.
YY has 55.2 million shares outstanding.
Insider Activity: Not available. Currently, 4 analysts follow the stock, all 4 have a strong buy, up from 3 three months ago.
Stock Performance Chart with Quarterly Earnings Markers.
| TTD's Breakout Profile
Rating YY Inc. - (YY) |
| TTD Check List | Bullish | Bearish | Neutral |
| Near 52-week High | YES | ||
| Volume | YES | ||
| Tick Volume | YES | ||
| Price Trend - Daily | YES | ||
| Price Trend - Long Term | YES | ||
| Price Daily Spread | YES | ||
| Base Structure | YES | ||
| Base - A-D | YES | ||
| Earnings-Quarterly | YES | ||
| Earnings-Long Term | YES | ||
| Earnings Outlook | YES | ||
| Industry Group | YES | ||
| Prior Breakout Success | YES | ||
| Fund Sponsorship | YES | ||
| Total Score | 14 | 0 | 0 |
Charts of Selected Breakout Stocks
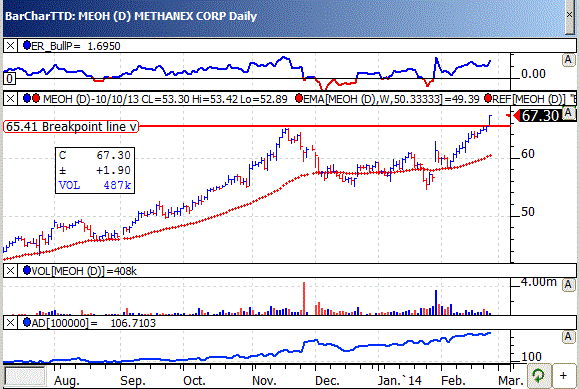
| TTD's Quality Rating of Stock - MEOH - ABOVE AVERAGE |
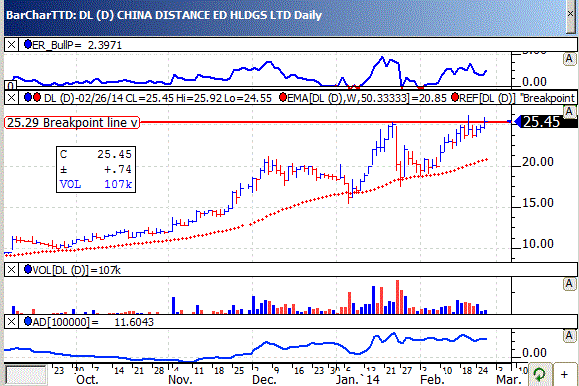
| TTD's Quality Rating of Stock - DL - ABOVE AVERAGE |
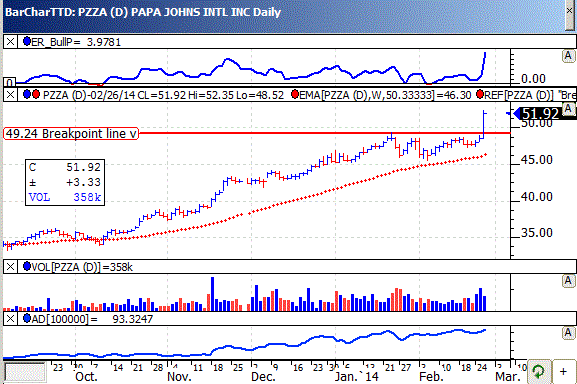
| TTD's Quality Rating of Stock - PZZA - AVERAGE |
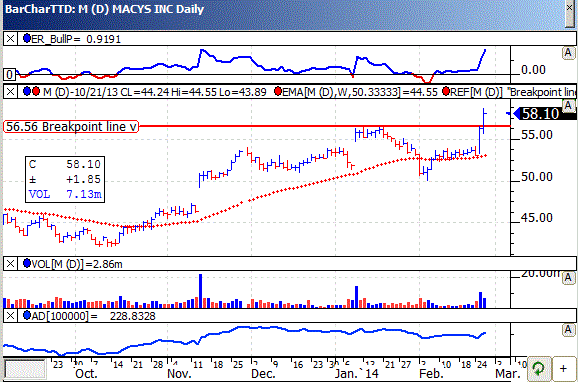
| TTD's Quality Rating of Stock - M - AVERAGE |

Ticker Tape Digest’s Daily List of “Stocks To Sell or Sell Short” ranks stocks well timed to be sold immediately based on daily trading. The list can be used as an alert to reduce current long-term positions.
Shorts from tape action so far today - 7
Stocks Screened - 8,300
Long-Term Environment for bears: Unfavorable.
Bear Side - Short list expands today with some interesting short plays. Bears be venture some. Stock market continues to rally across trading range but momentum is slowing.
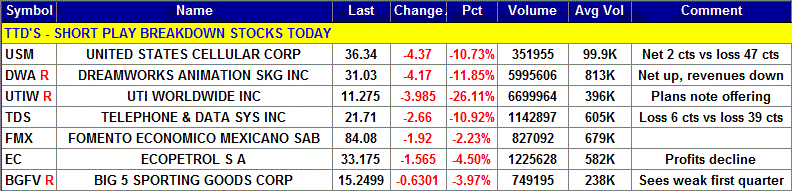
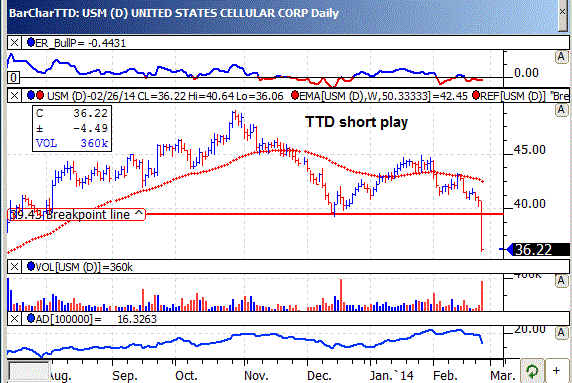
USM, based in Chicago, is a wireless telecom service provider. Annual revenues: $4.1 billion. USM's stock falls sharply today after the company reported a wider than expected loss for the fourth quarter. So far today, USM is trading a heavy 466,673 shares, four times its average daily volume of 100,000 shares. TTD sees more on the downside. 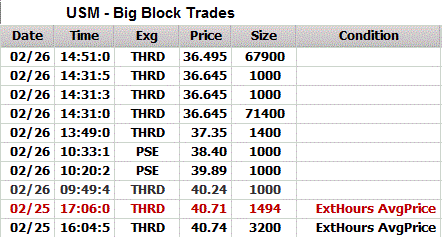
TTD highlighted USM as a short at our midsession video show on the Web Wednesday.
USM cam in with a fourth quarter loss equal to $1,85 a share. That was more than the Street's expectations of a loss of 80 cents a share.
The stock fell steadily in the morning. It hit an intraday low of 36.06 in the late afternoon. It lifted slightly in the final half hour to trim some of its loss.
USM's tape shows the recent block trades.
One can see the price for the blocks falling from $40.74 in the prior session to as low as $36.64.
A key bearish trade came in the morning when a block of 1,000 shares crossed the tape at $40.24. That was down from the prior block at $40.71 on 1,494 shares.
Then in the afternoon a massive block of 71,400 shares crossed at $36.64. That was down sharply from the prior block at $37.35 on 1,400 shares. It showed an urgency of institutional selling.
The company provides wireless voice and data services to 5.8 million customers in five geographic market areas in 26 states.
USM operates in one reportable segment, wireless operations, and all of its wireless operating markets are in the United States. The Company offers enhanced multimedia services, including Digital Radio, Mobile TV and 3D Gaming, over its 4G LTE and 3G networks.
Analysts are forecasting a loss of 30 cents a share for 2014. That compares with a profit of 36 cents the year before. For the upcoming first quarter, the Street expects a loss of 14 cents a share.
s daily chart shows the stock cutting below key technical support with big volume. The stock's accumulation - distribution line (bottom of chart) has turned lower showing significant selling.
Strategy Opinion: TTD is targeting USM for a decline to 31 within the next few months, or sooner. A protective stop buy can be placed near 37.70.
| TTD's Quality Rating of Stock - USM - BELOW AVERAGE |
TTD columnist Leo Fasciocco has covered the stock market for over 20 years. His articles appear in many publications. He is also a speaker at the Intershow conferences. He has been on television and radio. He is author of many educational articles about stock investing and the book “Guide To High-Performance Investing.”

For information to subscribe to the Ticker Tape Digest Services call: B. J. Owen at 1-480-926-1680. Distributed by Corona Publishing Enterprises. Ticker Tape Digest Inc. P.O. Box 2044 Chandler, Az. 85244-2044. TTD “Professional Report” is available on the World Wide Web: $100 per month. Password needed. “TTD Professional“ Faxed is $200 per month. The TTD Daily Report is $39.95. Credit cards accepted.
(The information contained has been prepared from data deemed reliable but there is no guarantee of complete accuracy. Ticker Tape Digest Inc. is not affiliated with any broker, dealer or investment advisor. Nothing in this publication constitutes an offer, recommendation or solicitation to buy or sell any securities. Further research is advised. This report is copyrighted and no redistribution is permitted with out permission.)