Daily - Go to TTD's Tape of Stock Charts - Thursday, March 15
|
Daily - Go to TTD's Tape of Stock Charts - Thursday, March 15 |
|
Weekly - Bullish Conservative Investors - Go To TTD Long-Term Plays - Monday, March 12 |
|
Go to Video Show - "How to Make Money With Breakout Stocks" |
|---|

By Leo Fasciocco -- TTD
Ticker Tape Digest presents its daily stock market report containing stocks to go long as breakout trades, quick trades, or bargain trades. We also feature stocks under Significant Accumulation that are poised to breakout.
|
Ticker Tape Digest's Daily schedule guide for TTD subscribers 1. Pre-market - check Breakout Watch List and Quick Trades. 2. Morning - (11:30 - 12 A.M.) - check breakout stocks tape and breakout chart slide show. 3. Midday (1 P.M.) check TTD Midsession Report and see market video show. 4. After close (4 P.M.) check final TTD Report for day. Trading Strategies Bullish Aggressive Investors Bullish - "Breakout Stocks" - ideally suited for bull markets and special situation stocks. Potential for large returns. (See Performance) Aggressive Investor Bullish- "Quick Trade Stocks" -ideally suited for entry into top performing issues looking for a small quick profit." (See Performance) Conservative Investors "Bargain Buy Trades for the Long Term." Ideally suited for entry into top performing big cap stocks on pullbacks within overall up trend.(See Performance) Bearish Aggressive Bearish Investors - "Breakdown Stocks" to Sell Short. Ideally suited for bear markets or market pull backs. Potential for large returns (See Performance) |
|---|
The TTD report also contains stocks to short as breakdown plays and as bargain (swing trade) shorts.
Investors should tend to try to go with a strategy that fits with the stock market's trend, unless there is a special situation play.
TTD's Breakout Stocks - Long are
most suitable for aggressive investors seeking ideal entry points into leading stocks, especially during bull markets. They can do extremely well in bull markets with gains of as much as several hundred percent.
These stocks can also do extremely well during strong market rallies, or if they are in a industry group that is performing very well. They tend to have strong earnings outlooks and are near new-52 week, or all-time highs.
TTD Quick Trade Stocks - Long These are leading issues that have pulled back in recent days, but could move higher soon. They are most suitable for Aggressive Investors willing to trade short term. These stocks will do extremely well during market advances. They have about 74% win rate. During market rally sequences the win rate is even higher. The return is small 3% to 8% in just a few days.
TTD's Bargain Buy Trades - Long - Long Term. These are for conservative bullish Investors These long-term buys are ideally suited for entry into stocks on pull backs within overall up trend. These stocks can give a good return long-term especially during a bull market.
TTD also presents Stocks To Sell or Sell Short. These issues are suitable for aggressive investors willing to take short positions both as trades or for longer-term plays. These stocks will do very well during bear markets or market pull backs.
TTD's Bearish breakdown stocks to sell short. These issues have potential to fall sharply. They often show a technical breakdown and also some fundamental business problem such as weak earnings.
TTD's multi-media updates include a slide-show that presents charts and analysis at midsession. Some times TTD presents feature analysis on stocks and the market. TTD uses Windows Media Files. (WMV).
TTD also presents a "Breakout Watch List" that is up dated daily. This list consists of key stocks in position to breakout. A close watch of this list can put you in the stock just as it breaks out. A good idea is to study the list and be ready to move into a stock quickly as it hits its breakpoint.
TTD often suggests using stop buy orders to enter. It is very important to buy a breakout stock as close as possible to the breakpoint. The idea is to get "elbow room" if the stock should follow through to the upside. This is very important in being successful in making big money with breakout stocks.
It is also essential to have a stop loss strategy for all stocks in which positions are taken. Not every stock will work as expected. It is important for investors to "police" their portfolios and avoid getting trapped in any bad positions.
Quality rating of breakout Two key factors: 1 - Stock near all-time in price or near a 52-week high. 2 - earnings growth current year is strong. The ideal play is a stock with an Above Average Quality Rating. The stock is near a new high and will have strong earnings. TTD's other ratings are Average and Below Average.
TTD also has special feature sections on Educational Tips on Investing.
To email Mr. Leo Fasciocco leo@tickertapedigest.com.For service, email Beverly Owen owen@tickertapedigest.com. TTD’s Tel: 1-480-926-1680.

Ticker Tape Digest's Midsession Stock Market Video Show(Posted 12:30 to 1 p.m. NYSE Time) Go to TTD Stock Market Show For - March 15Go to Shows for Latest Week: Monday
-
Tuesday
-
Wednesday
-
Thursday
-
Friday
|
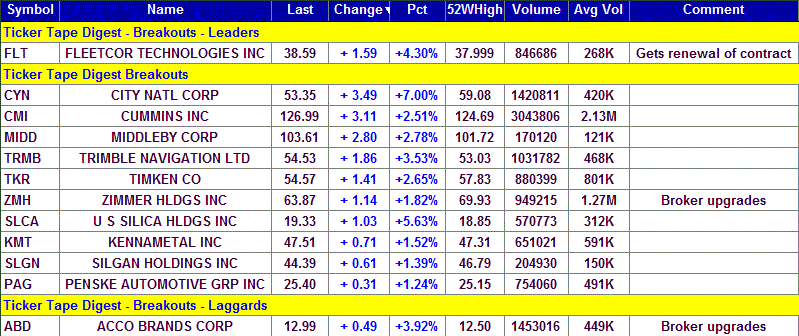
Breakout Stocks
Total Buy Breakouts so far today - 12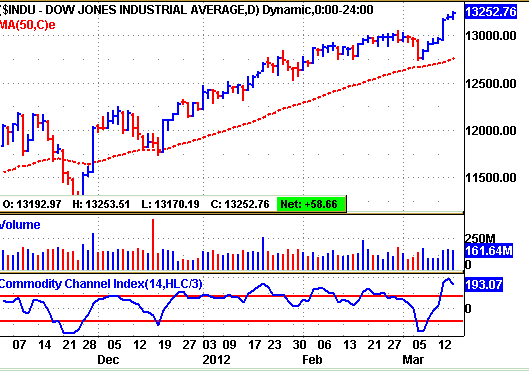
Overall Quality of Breakouts - Average
Stocks Screened - 8,300
Bull side - Good number of breakouts with most just average plays. Bulls can be venturesome. Stock market holds in up trend with momentum still bullish.
(Put mouse on Dow chart to see Nasdaq chart)
Long Term Environment for bulls: Neutral
Market (Daily) - NYSE Bullish, Nasdaq Bullish
Market (Weekly) - NYSE Bullish, Nasdaq Bullish
Market (Monthly) - NYSE Bullish, Nasdaq Bullish
Ticker Tape Digest's
|
TTD's Quality Rating of Stock - FLT - ABOVE AVERAGE |
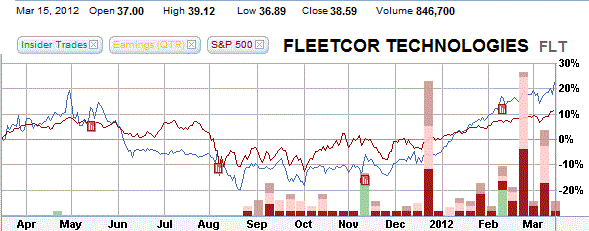
FLT, based in Norcross, Ga., provides specialized payment products and services to businesses, commercial fleets, oil companies, petroleum marketers and government entities in 18 countries. Annual revenues: $520 million. FLT's stock breaks out today from a six-week flat base. The move carries the stock to a new all-time high. FLT came public back in late 2010. so far today FLT is trading a heavy 847,956 shares, more than double its normal daily volume of 258,000 shares. 
TTD highlighted FLT as a breakout at our midsession video show on the Web Thursday.
FLT's stock rose steadily in the morning after the company said it had renewed a major partner contract. 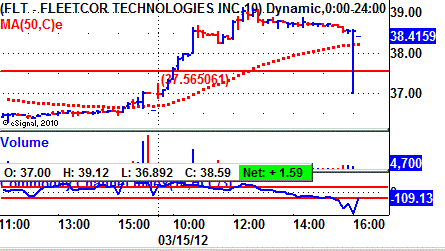
The stock peaked around noon at 39.12. It then trended sideways the rest of the day.
TTD's clip of the tape shows FLT's recent big block trades.
One can see the price for the blocks climbing from $37 on Wednesday to a peak of $38.59.
A key bullish trade came in the morning when a block of 5,000 shares crossed the tape at $38.50. That was up sharply from the prior block at $37.
There was bearish block near the clsoe at 37 on 8,100 shares, but that was followed by a bullish block of 14,587 shares at 38.59. 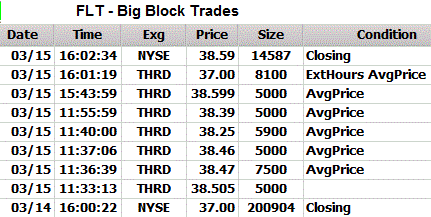
FLT operates in two segments: North American and International.
The company provides its payment products and services in a range to create customized payment solutions for its customers and partners.
It also uses third-party networks to deliver its payment programs and services in order to broaden its card acceptance and use.
To support its payment products, the company also provides a range of services, such as issuing and processing, as well as specialized information services that provide its customers with value-added functionality and data. In December 2011, it acquired AllStar Business Solutions Limited from The Arval Group.
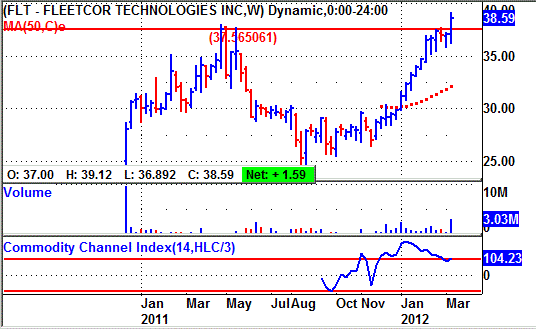
FLT's 12-month performance chart shows the stock appreciating 22% versus a 12% gain for the S&P 500 index. The red bars on the chart show a steady flow of insider selling in recent months.
FLT's long-term chart shows the stock climbing from around 30 in late 2010 to a peak of 37 in early 2010. The stock then declined to 24 by mid-2010. It has since staged a strong rebound and hit a new high. The new high could attract more buying on Friday.
FLT's daily chart shows the stock advamcing from a breakout at 32 to 37 where it put down a well-formed flat base.
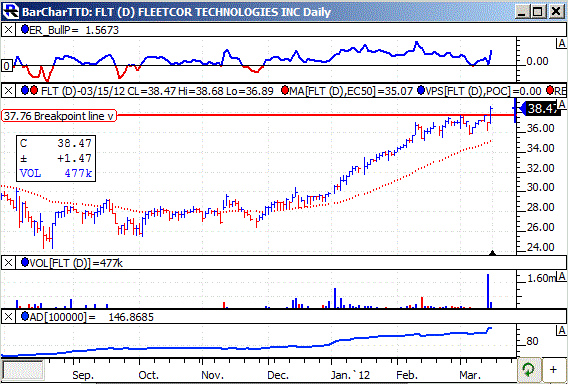
The breakout today is ideal coming with a widening of the sprea (range from high to low) and strong volume.
The stock's TTD momentum indcator (top of chart) has been bullish for the past four months. It has gotten even stronger over the past few sessions.
The accumulation - distribution line (bottom of chart) is in a strong up trend and has hit a new peak. That shows that there is very strong underlying buying in the stock.
This year, analysts are forecasting a 22% jump in profits to $2.44 a share from $1.99 a year ago. The stock sells with a price-earnings ratio of just 15. TTD sees that as low making the stock attractive to value investors.
Another fundamental plus is that earnings for the first quarter should jump 32% to 58 cents a share from 44 cents a year ago.
The highest estimate on the Street is at 67 cents a share. TTD sees very good chances for an upside surprise. The past three quarters, FLT topped the consensus estimate by 4 cents a share, 6 cents and 4 cents.
Going out to the second quarter, analysts look for a 21% gain in net to 62 cents a share from 51 cents the year before. 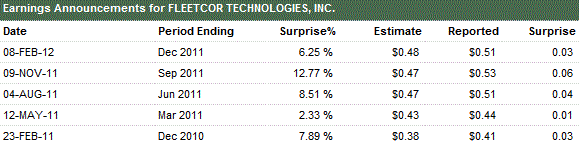
Strategy Opinion: TTD is targeting FLT for a move to 47 off this breakout. A protective stop can be placed near 36 which is tight. TTD rates FLT a good intermeidate-term play with a low valuation that could attract value investors.
Sponsorship: Very Good. The largest fund holder is 4-star rated Lord Abbett Small Cap Value Fund with a 1.6% stake. It has held its position steady. A key buyer recently was 4-star rated Lord Abbett Value Opportunities Fund which purchased 141,900 shares. FLT has 82.2 million shares outstanding. Institutions hold 73% of the stock.
Insider Activity: Extremely Bearish. Insiders have been buyers using stock options at about $2.31 a share. They turned around and sold at about $36 to $37 a share. Five analysts follow the stock, 3 have a buy, the same as three months ago.
Stock Performance Chart with Quarterly Earnings Markers
Insider Activity - Buying in Green - Selling in Red
| TTD's Breakout Profile
Rating Fleetcor Technologies Inc. - (FLT) |
| TTD Check List | Bullish | Bearish | Neutral |
| Near 52-week High | YES | ||
| Volume | YES | ||
| Tick Volume | YES | ||
| Price Trend - Daily | YES | ||
| Price Trend - Long Term | YES | ||
| Price Daily Spread | YES | ||
| Base Structure | YES | ||
| Base - A-D | YES | ||
| Earnings-Quarterly | YES | ||
| Earnings-Long Term | YES | ||
| Earnings Outlook | YES | ||
| Industry Group | YES | ||
| Prior Breakout Success | YES | ||
| Fund Sponsorship | YES | ||
| Total Score | 14 | 0 | 0 |
Charts of Selected Breakout Stocks
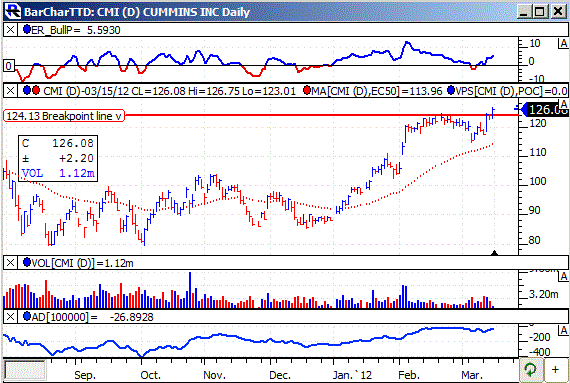
| TTD's Quality Rating of Stock - CMI - AVERAGE |
| TTD's Quality Rating of Stock - MIDD - AVERAGE |

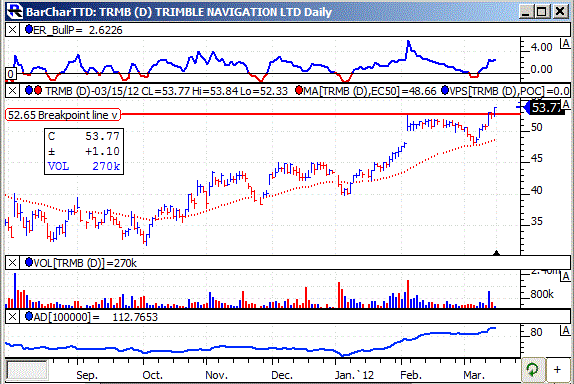
| TTD's Quality Rating of Stock - TRMB - AVERAGE |
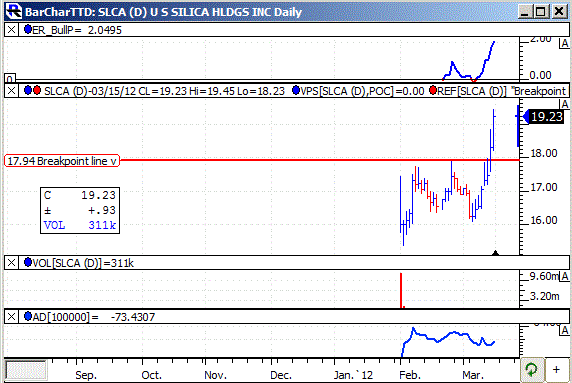
| TTD's Quality Rating of Stock - SLCA - AVERAGE |

Ticker Tape Digest’s Daily List of “Stocks To Sell or Sell Short” ranks stocks well timed to be sold immediately based on daily trading. The list can be used as an alert to reduce current long-term positions.
Shorts from tape action so far today - 2
Stocks Screened - 8,300
Long-Term Environment for bears: Unfavorable.
Bear Side - Only two short plays today. Stock market pushes higher. Bears be conservative and selective. TTD's short play from Wednesday was Sterling Construction Co. (STRL) at $8.84. The stock is at $8.81 so far today.
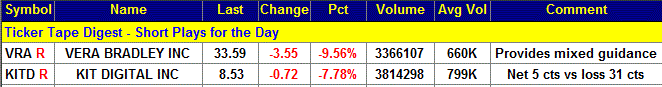
VRA, based in Fort Wayne, Ind., makes clothes and accessories for women. Annual revenues: $435 million. VRA's stock falls sharply today in heavy trading. The decline was linked to a forecast of fiscal first quarter (April 30) net that was below Wall Street estimates. So far today VRA is trading a heavy 3.9 million shares, six times its normal daily volume of 660,000 shares. 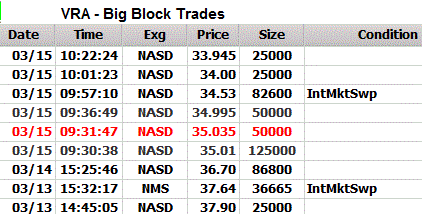
VRA said earnings for the fiscal first quarter would be 27 to 29 cents a share. That was below the consensus estimate of 32 cents a share. The year before the company earned 28 cents a share.
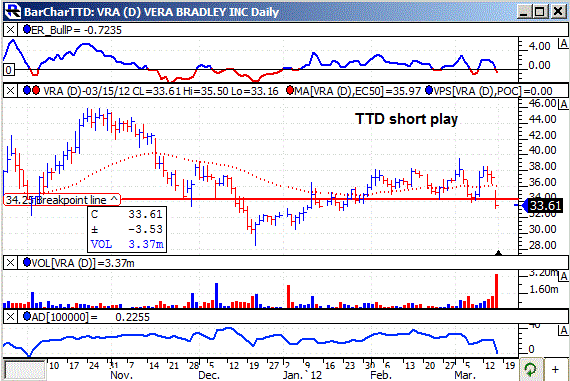
The stock took the news very bearishly and fell sharply in the morning. It hit an intraday low of $33.16. The stock then trended sideways the rest of the day.
VRA's tape action shows the price for the big block trades declining from $37.90 to $33.94. A key bearish trade came in the morning when a block of 125,000 shares crossed the tape at $35.01. That was down from the prior block at $36.70.
The tape action showed heavy institutional selling pressure.
VRA makes clothes, handbags, accessories, and travel and leisure items.
It sells to 3,300 independent retailers, most in the U.S. It also has 35 full-price stores, its four outlet stores, verabradley.com, and its annual outlet sale in Fort Wayne, Indiana. I
Analysts are forecasting a 19% gain in net for the fiscal year ending January of 2013 to $1.70 a share from $1.43 a year ago.
Strategy Opinion: TTD sees VRA as a trading short with a downside target of 28. A protective stop buy can be placed near 34.80.
| TTD's Quality Rating of Stock - VRA - AVERAGE |
TTD columnist Leo Fasciocco has covered the stock market for over 20 years. His articles appear in many publications. He is also a speaker at the Intershow conferences. He has been on television and radio. He is author of many educational articles about stock investing and the book “Guide To High-Performance Investing.”

For information to subscribe to the Ticker Tape Digest Services call: B. J. Owen at 1-480-926-1680. Distributed by Corona Publishing Enterprises. Ticker Tape Digest Inc. P.O. Box 2044 Chandler, Az. 85244-2044. TTD “Professional Report” is available on the World Wide Web: $100 per month. Password needed. “TTD Professional“ Faxed is $200 per month. The TTD Daily Report is $39.95. Credit cards accepted.
(The information contained has been prepared from data deemed reliable but there is no guarantee of complete accuracy. Ticker Tape Digest Inc. is not affiliated with any broker, dealer or investment advisor. Nothing in this publication constitutes an offer, recommendation or solicitation to buy or sell any securities. Further research is advised. This report is copyrighted and no redistribution is permitted with out permission.)