Daily - Go to TTD's Chart scroller of Breakout Stocks - Monday, March 27, 2017
|
Daily - Go to TTD's Chart scroller of Breakout Stocks - Monday, March 27, 2017 |
|
Weekly - Bullish Conservative Investors - Go To TTD Long-Term Plays - Monday, March 20, 2017 |
|
|
Go to Video Show - "How to Make Money With Breakout Stocks |
|---|

By Leo Fasciocco -- TTD
Ticker Tape Digest presents its daily stock market report containing stocks to go long as breakout trades, quick trades, or bargain trades. We also feature stocks under Significant Accumulation that are poised to breakout.
|
Ticker Tape Digest's Daily schedule guide for TTD subscribers 1. Pre-market - check Breakout Watch List and Quick Trades. 2. Morning - (11:30 - 12 A.M.) - check breakout stocks tape and breakout chart slide show. 3. Midday (1 P.M.) check TTD Midsession Report and see market video show. 4. After close (4 P.M.) check final TTD Report for day. Trading Strategies Bullish Aggressive Investors Bullish - "Breakout Stocks" - ideally suited for bull markets and special situation stocks. Potential for large returns. (See Performance) Aggressive Investor Bullish- "Quick Trade Stocks" -ideally suited for entry into top performing issues looking for a small quick profit." (See Performance) Conservative Investors "Bargain Buy Trades for the Long Term." Ideally suited for entry into top performing big cap stocks on pullbacks within overall up trend.(See Performance) Bearish Aggressive Bearish Investors - "Breakdown Stocks" to Sell Short. Ideally suited for bear markets or market pull backs. Potential for large returns (See Performance) |
|---|
The TTD report also contains stocks to short as breakdown plays and as bargain (swing trade) shorts.
Investors should tend to try to go with a strategy that fits with the stock market's trend, unless there is a special situation play.
TTD's Breakout Stocks - Long are
most suitable for aggressive investors seeking ideal entry points into leading stocks, especially during bull markets. They can do extremely well in bull markets with gains of as much as several hundred percent. 
These stocks can also do extremely well during strong market rallies, or if they are in a industry group that is performing very well. They tend to have strong earnings outlooks and are near new-52 week, or all-time highs.
TTD Quick Trade Stocks - Long These are leading issues that have pulled back in recent days, but could move higher soon. They are most suitable for Aggressive Investors willing to trade short term. These stocks will do extremely well during market advances. They have about 74% win rate. During market rally sequences the win rate is even higher. The return is small 3% to 8% in just a few days.
TTD's Bargain Buy Trades - Long - Long Term. These are for conservative bullish Investors These long-term buys are ideally suited for entry into stocks on pull backs within overall up trend. These stocks can give a good return long-term especially during a bull market.
TTD also presents Stocks To Sell or Sell Short. These issues are suitable for aggressive investors willing to take short positions both as trades or for longer-term plays. These stocks will do very well during bear markets or market pull backs.
TTD's Bearish breakdown stocks to sell short. These issues have potential to fall sharply. They often show a technical breakdown and also some fundamental business problem such as weak earnings.
TTD's multi-media updates include a slide-show that presents charts and analysis at midsession. Some times TTD presents feature analysis on stocks and the market. TTD uses Windows Media Files. (WMV).
TTD also presents a "Breakout Watch List" that is up dated daily. This list consists of key stocks in position to breakout. A close watch of this list can put you in the stock just as it breaks out. A good idea is to study the list and be ready to move into a stock quickly as it hits its breakpoint.
TTD often suggests using stop buy orders to enter. It is very important to buy a breakout stock as close as possible to the breakpoint. The idea is to get "elbow room" if the stock should follow through to the upside. This is very important in being successful in making big money with breakout stocks.
It is also essential to have a stop loss strategy for all stocks in which positions are taken. Not every stock will work as expected. It is important for investors to "police" their portfolios and avoid getting trapped in any bad positions.
Quality rating of breakout Two key factors: 1 - Stock near all-time high in price or near a 52-week high. 2 - earnings growth current year is strong. The ideal play is a stock with an Above Average Quality Rating. The stock is near a new high and will have strong earnings. TTD's other ratings are Average and Below Average.
TTD also has special feature sections on Educational Tips on Investing.
To email Mr. Leo Fasciocco leo@tickertapedigest.com. For service, email Beverly Owen owen@tickertapedigest.com. TTD’s Tel: 1-480-926-1680.
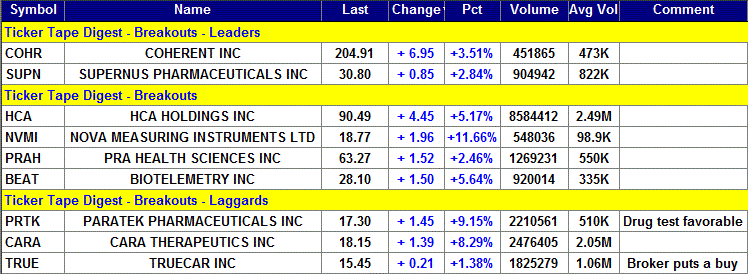
TTD's Breakout Stocks
Stock Market Overview
Total Buy Breakouts so far today - 9
Quality of Breakouts - Average
Stocks Screened - 8,300
Bull side - Breakout list small but there are several good looking plays. Bulls can be venturesome.
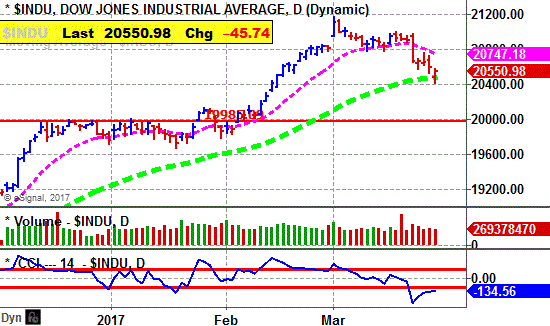
Stock market is in an overall trading range as the rally from November of last year has expired.
Monday - March 27, 2017
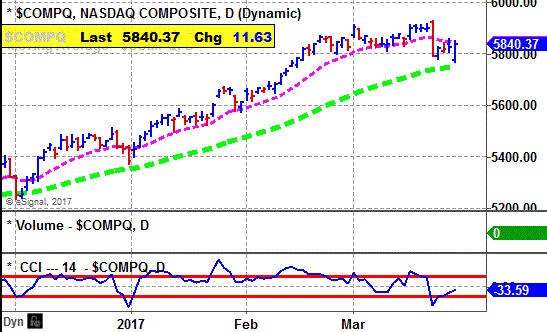
Stock Market Momentum
|
Market (Daily) |
Market (Weekly) |
Market (Monthly) |
|
Dow - Bearish |
Dow -Bearish |
Dow Bullish, |
|
Nasdaq - Bullish |
Nasdaq - Bearish |
Nasdaq Bullish |
|
S&P 500 - Bearish |
S&P 500 - Bearish |
S&P 500 - Bullish |
Ticker Tape Digest's
|
TTD's Quality Rating of Stock - COHR - ABOVE AVERAGE |
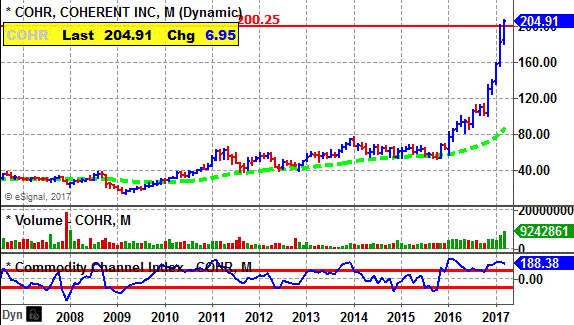
COHR, based in Santa Clara, Ca., makes laser and their components. Annual revenues: $1 billion. COHR's stock breaks out Monday from an eight-week cup-and-handle base. The moves carries the stock to a new all-time high. That is bullish. 
So far today, COHR is trading 736,986 shares. Its average daily volume is 473,000 shares.
TTD highlighted COHR last week as a stock poised to breakout. It does just that Monday.
COHR's stock fell in the morning. However, it quickly turned and rallied steadily breaking through its key resistance line in the morning.
The stock reached an intraday high of 207.01. It closed near its high for the session. That is bullish. 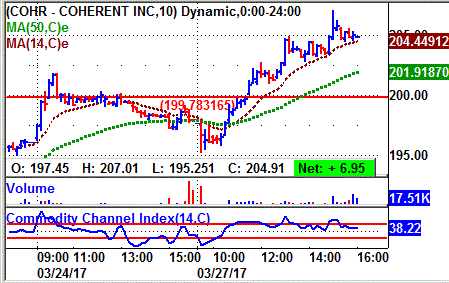
Tape Action
COHR's tape action shows the recent block trades.
One can see the price for the blocks climbing from $196.12 in the prior session to as high as $204.91.
A bullish trade came late in the prior session when a block of 36,370 shares (duplicated) crossed the tape at $197.96.
That was up from the prior block at $196.12 on 8,048 shares.
The near the close Monday a block of 10,797 shares (duplicated) crossed at $204.91.
That was up sharply from the prior trade at $196.49 on 17,500 shares.
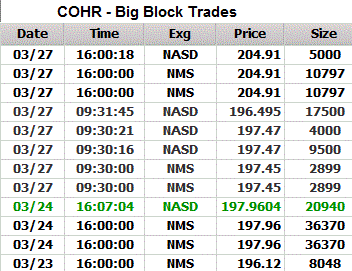
The big institutional buying at the final bell Monday is very bullish.
Business
COHR makes lasers and related accessories for a range of scientific, commercial and industrial applications.
It operates through two segments: Specialty lasers and systems and commercial lasers.
It makes lasers for the microelectronics, scientific research and government programs, and original equipment manufacturer components and instrumentation markets.
Charts
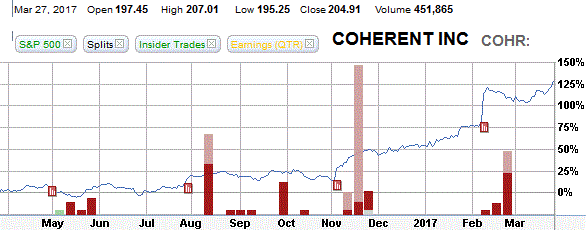
COHR's 12-month performance chart shows the stock appreciating 126% the past 12 months versus a 13% gain for the stock market.
Insiders were recent buyers using stock options. The price was not disclosed. Insiders were sellers most recently from $129 to $194 a share.
COHR's long-term chart shows the stock reaching a peak of $65.50 in 2011. The stock then went into a long-term basing pattern.
The stock broke out in late 2015 and has since surged to an all-time high of $207.01 set Monday. 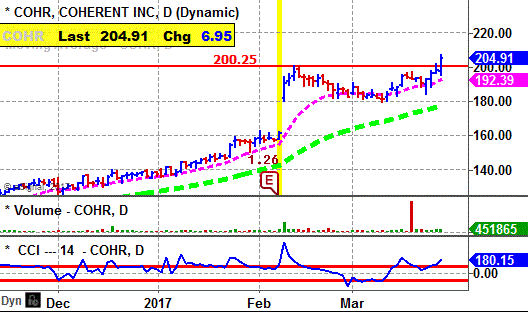
COHR's daily chart shows the stock climbing from $130 back in December to a peak near $200 by February.
The stock formed a cup-and-handle base.
The breakout looks solid coming with a widening of the daily spread.
That shows ease of price movement through the resistance point.
Also, there was a good pick up in volume.
The stock's CCI momentum indicator is solidly bullish.
Earnings Outlook
This fiscal year ending in September, analysts are forecasting a 132% surge in net to $9.58 a share from $4.12 a year before.
Analysts have recently raised their year earnings forecast significantly in recent days. Two analysts rate the stock.
The stock has a price-earnings ratio of 20. TTD sees that as attractive for value-growth investors.
Going out to fiscal 2018 ending in September, net is expected to climb 21% to $11.63 a share from the anticipated $9.58 this fiscal year.
Profits for the next two quarters will be extremely strong. That should be the key drive for the stock.
Net for the upcoming fiscal second quarter ending in March is expected to surge 190% to $2.55 a share from the 88 cents the year before. Analysts recently lifted their quarterly estimate greatly.
Looking out to the fiscal third quarter ending in June, the Street expects a 170% leap in net to $2.43 a share from the 90 cents the year before.
Strategy Opinion: TTD is targeting COHR for a move to $240. A protective stop can be placed near $194.
TTD rates COHR a good intermediate-term play provided earnings meet expectations.
Suitability: Average Bulls.
TTD's special research of COHR's Stock's Prior Performance after a Breakout:
TTD's research shows that recently (see table) COHR has racked up some big gains after its breakouts. That is impressive.
The stock has moved higher 6 out of the past 7 earnings reports where there was a significant change. It had a big gain off its last earnings report.
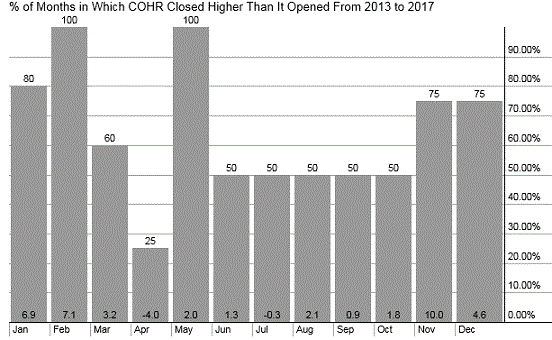
COHR's seasonal chart shows March being a good month. However, April is one of its worst. So, one must be watchful.
Stock's Prior Performance After A Breakout
|
Stock's % Change from Breakout to peak - prior to cut below 50-day M/A. |
Date of Breakout |
Break point Price |
Stocks Price Peak after Breakout - prior to cut below 50-day M/A |
Date Trade Closed |
|
40% |
1/9/2017 | 140.83 | 197.19 | Still in play |
|
72% |
11/3/2016 | 114.43 | 197.19 | Still in play |
|
12% |
7/27/2016 | 98.93 | 111.45 | 8/19/2016 |
|
36% |
1/28/2016 | 69.77 | 95.42 | 4/28/2016 |
|
20% |
10/15/2013 | 62.95 | 75.89 | 1/21/2014 |
|
13% |
1/10/2013 | 52.91 | 59.99 | 2/15/2013 |
(In actual trading, entry and exit points could vary depending on broker execution.
Also, ideal are breakouts to a new 52-week high or better, perhaps all-time highs.)
Stock's Long-term Chart
Stock's Performance Chart with Quarterly Earnings Markers vs. S&P 500
Insider Buying in Green - Insider Selling in Red
Stock's Monthly Seasonal Performance Chart - Past 5 Years
Showing % Months UP and % Change
Charts of Selected Breakout Stocks
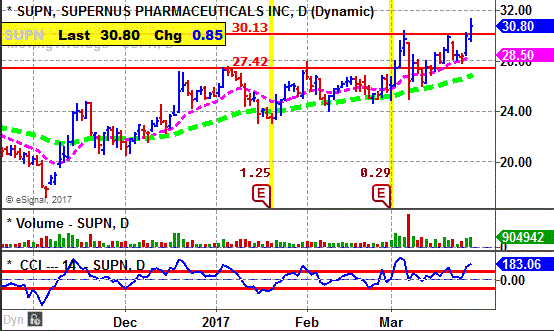
| TTD's Quality Rating of Stock - SUPN - ABOVE AVERAGE |
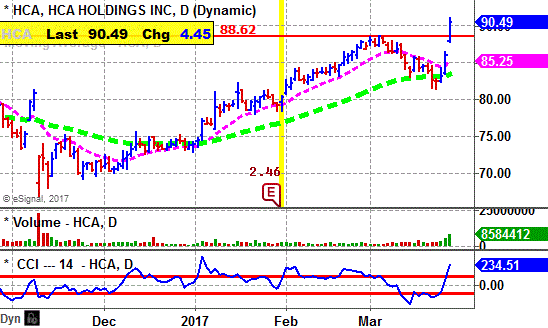
| TTD's Quality Rating of Stock - HCA - AVERAGE |
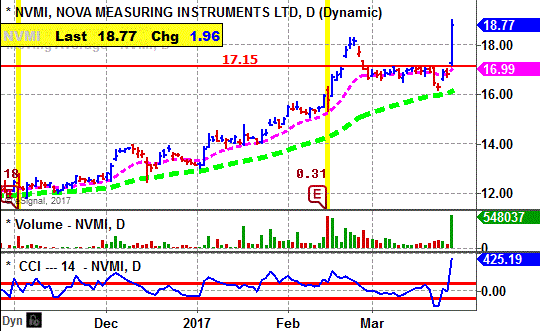
| TTD's Quality Rating of Stock -NVMI - AVERAGE |
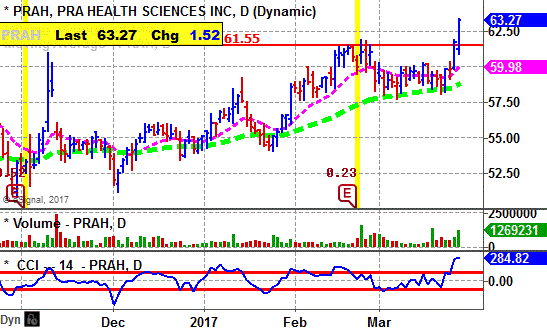
| TTD's Quality Rating of Stock - PRAH - AVERAGE |

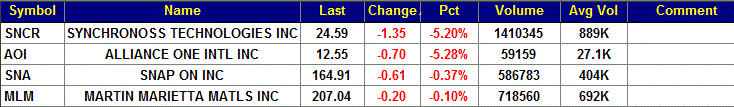
Ticker Tape Digest’s Daily List of “Stocks To Sell or Sell Short” ranks stocks well timed to be sold immediately based on daily trading. The list can be used as an alert to reduce current long-term positions.
Shorts from tape action so far today - 4
Stocks Screened - 8,300
Long-Term Environment for bears: Unfavorable.
Bear Side - Small list of breakdown stocks Monday. Stock market in consolidation after a recent advance.
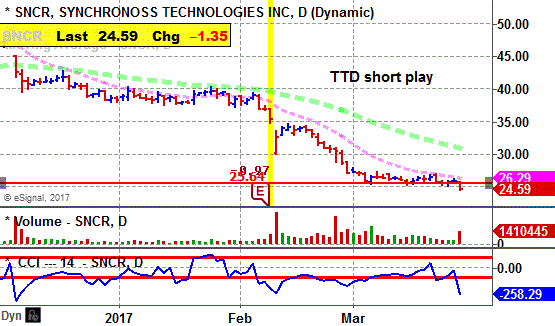
SNCR, based in Bridgewater, N.J., a provider of cloud solutions and software, falls sharply Monday and undercuts key technical support. TTD sees more on the downside. So far today, SNCR is trading a heavy 1.4 million shares. Its average daily volume is 889,000 shares. 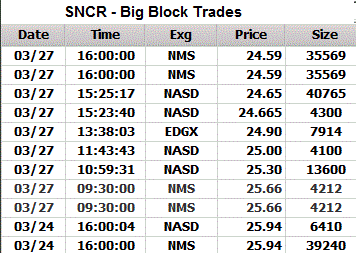
SNCR's stock moved lower through the morning.
The in the early afternoon SNCR cut below its key technical support.
The stock touched an intraday low of $24.46.
Tape Action
SNCR's tape action shows the recent block trades.
One can see the price for the blocks falling from $25.94 in the prior session to as low as $24.59.
A key bearish trade came in the morning when a block of 4,212 shares (duplicated) crossed the tape at $25.66.
That ws down from the prior block trade at $25.94 on 6,410 shares.
Business
SNCR provides technologies and services for the mobile transformation of business. The Company's sells personal cloud, secure-mobility, identity management and scalable messaging platforms and solutions.
The company operates around the world.
Earnings: This year, analysts are forecasting a 180% surge in profits to $1.99 a share from 71 cents a year ago. The stock sells with a price-earnings ratio of 12.
However, earnings for the upcoming first quarter are expected to drop 23% to 27 cents a share from 35 cents the year before.
The company fell short by 2 cents a share in its previous quarter from what analysts were forecasting.
Charts: SNCR's daily chart shows the stock trending lower from $45 back in December down to around $26 by March. The stock formed a bottom pattern. However, Monday it cuts below key technical support with expanding volume.
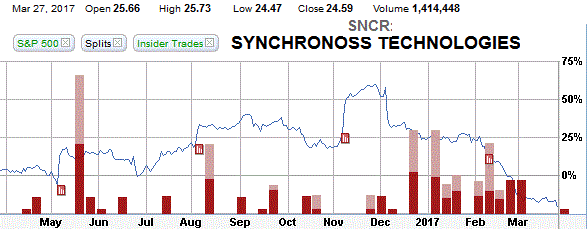
SNCR's 12-month performance chart shows the stock declining 8% versus a 15% gain for the stock market. It fell sharply after its prior earnings report.
Insiders were recent buyers using stock toptions at $22 to $31 a share. They were sellers at $25 to $39 a share recently.
Strategy Opinion: TTD is targeting SNCR for a decline to $20 within the next few months or sooner. A protective stop buy can be placed near $26.
Suitability: Aggressive Bears.
| TTD's Quality Rating of Stock - SNCR - AVERAGE |
Stock Performance Chart with Quarterly Earnings Markers vs. S&P 500
Insider Buying in Green - Insider Selling in Red
TTD columnist Leo Fasciocco has covered the stock market for over 30 years. His articles appear in many publications. He is also a speaker at the Intershow conferences. He has been on television and radio. He is author of many educational articles about stock investing and the book “Guide To High-Performance Investing.”

For information to subscribe to the Ticker Tape Digest Services call: Beverly Owen at 1-480-926-1680. Distributed by Corona Publishing Enterprises. Ticker Tape Digest Inc. P.O. Box 2044 Chandler, Az. 85244-2044. TTD “Professional Report” is available on the World Wide Web: $100 per month. Password needed. “TTD Professional“ Faxed is $200 per month. The TTD Daily Report is $39.95. Credit cards accepted.
(The information contained has been prepared from data deemed reliable but there is no guarantee of complete accuracy. Ticker Tape Digest Inc. is not affiliated with any broker, dealer or investment advisor. Nothing in this publication constitutes an offer, recommendation or solicitation to buy or sell any securities. Further research is advised. This report is copyrighted and no redistribution is permitted with out permission.)