|
Weekly - Bullish Conservative Investors - Go To TTD Long-Term Plays - Monday, March 28 |
|
Go to Video Show - "How to Make Money With Breakout Stocks" Go to Video Show -TTD Performance 2008 Long and Short |
|---|

By Leo Fasciocco -- TTD
Ticker Tape Digest presents its daily stock market report containing stocks to go long as breakout trades, quick trades, or bargain trades. We also feature stocks under  Significant Accumulation that are poised to breakout.
|
Ticker Tape Digest's Trading Strategies Overview and Performance Bullish Aggressive Investors Bullish - "Breakout Stocks" - ideally suited for bull markets and special situation stocks. Potential for large returns. Aggressive Investor Bullish- "Quick Trade Stocks" -ideally suited for entry into top performing issues looking for a small quick profit." Conservative Investors "Bargain Buy Trades for the Long Term." Ideally suited for entry into top performing big cap stocks on pullbacks within overall up trend. Bearish Aggressive Bearish Investors - "Breakdown Stocks" to Sell Short. Ideally suited for bear markets or market pull backs. Potential for large returns |
|---|
The TTD report also contains stocks to short as breakdown plays and as bargain (swing trade) shorts.
Investors should tend to try to go with a strategy that fits with the stock market's trend, unless there is a special situation play.
1 - TTD's Breakout Stocks - Long - (Intermediate-term long plays) these are most suitable for aggressive investors seeking ideal entry points into leading stocks, especially during bull markets. They can do extremely well in bull markets with gains of as much as several hundred percent.
These stocks can also do extremely well during strong market rallies, or if they are in a industry group that is performing very well. They tend to have strong earnings outlooks and are near new-52 week, or all-time highs.
2 -TTD Quick Trade Stocks - Long - (Short-term long plays These are leading issues that have pulled back in recent days, but could move higher soon. They are most suitable for Aggressive Investors willing to trade short term. These stocks will do extremely well during market advances. They have about 74% win rate. During market rally sequences the win rate is even higher. The return is small 3% to 8% in just a few days.
3 - TTD's Bargain Buy Trades - Long - (Long Term long plays. These are for conservative bullish Investors These long-term buys are ideally suited for entry into stocks on pull backs within overall up trend. These stocks can give a good return long-term especially during a bull market.
TTD also presents Stocks To Sell or Sell Short. These issues are suitable for aggressive investors willing to take short positions both as trades or for longer-term plays. These stocks will do very well during bear markets or market pull backs.
4 - TTD's Bearish breakdown stocks to sell short. These issues have potential to fall sharply. They often show a technical breakdown and also some fundamental business problem such as weak earnings.
TTD's multi-media updates include a slide-show that presents charts and analysis at midsession. Some times TTD presents feature analysis on stocks and the market. TTD uses Windows Media Files. (WMV).
TTD also presents a "Breakout Watch List" that is up dated daily. This list consists of key stocks in position to breakout. A close watch of this list can put you in the stock just as it breaks out. A good idea is to study the list and be ready to move into a stock quickly as it hits its breakpoint.
TTD often suggests using stop buy orders to enter. It is very important to buy a breakout stock as close as possible to the breakpoint. The idea is to get "elbow room" if the stock should follow through to the upside. This is very important in being successful in making big money with breakout stocks.
It is also essential to have a stop loss strategy for all stocks in which positions are taken. Not every stock will work as expected. It is important for investors to "police" their portfolios and avoid getting trapped in any bad positions.
Quality rating of breakout Two key factors: 1 - Stock near all-time in price or near a 52-week high. 2 - earnings growth current year is strong. The ideal play is a stock with an Above Average Quality Rating. The stock is near a new high and will have strong earnings. TTD's other ratings are Average and Below Average.
TTD also has special feature sections on Educational Tips on Investing.
To email Mr. Leo Fasciocco leo@tickertapedigest.com.For service, email Beverly Owen owen@tickertapedigest.com. TTD’s Tel: 1-480-926-1680.
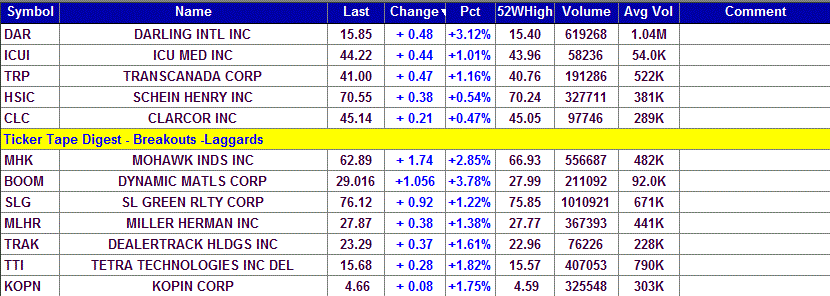
Total Buy Breakouts so far today - 33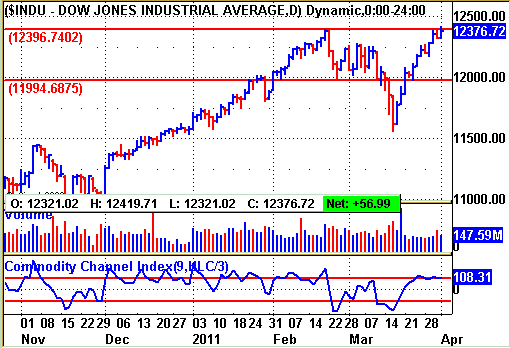
Overall Quality of Breakouts - ABOVE AVERAGE
Stocks Screened - 8,300
Bull side - Large number of breakouts today as stock market continues to push higher. The market has rallied back into its prior trading range and is now at a resistance point. Bulls be selective. Earnings and annual meetings coming up. (Put mouse on Dow chart to see Nasdaq chart)
Long Term Environment for bulls: Neutral
Market (Daily) - NYSE Bullish, Nasdaq Bullish
Market (Weekly) - NYSE Bullish, Nasdaq Bullish
Market (Monthly) - NYSE Bullish, Nasdaq Bullish
Ticker Tape Digest's
(See Top Performing Breakout Stocks for 2011 - Updated March 25)

|
TTD's Quality Rating of Stock - SMCI - ABOVE AVERAGE |
SMCI, based in San Jose, Ca., makes energy-efficient, application optimized server solutions based on the x86 architecture. Annual revenues: $840 million. Today, TTD gets many breakouts. One that is acting very well is SMCI which clears an 8-week flat base. So far today, SMCI is trading 313,070 shares, double its normal daily volume of 155,000 shares. 
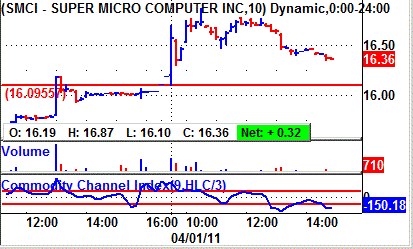
TTD highlighted SMCI as a breakout at our midsession show on the Web Friday.
TTD's 10-minute chart of SMCI shows the stock gapping higher in the morning on strong volume.
The stock held nicely over its breakpoint through most of the day. Late in the session it gave some ground on light volume.
TTD's clip of the tape shows the recent block trades. SMCI is a small cap play. So, the block trades are small.
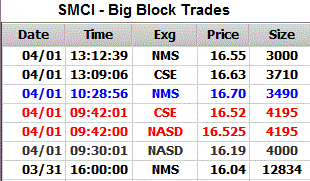 One can see the price for the blocks climbing from $16.04 to a peak of $16.70.
A key bullish trade came in the morning when 4,000 shares crossed the tape at $16.19. That was up from the prior trade at $16.04.
SMCI's solutions include a range of rack mount and blade server systems, as well as components.
The company makes serverboards, chassis and server systems.
The server building block solutions provide benefits across many environments, including data center deployment, high-performance computing, high-end workstations, storage networks and standalone server installations.
The company sells its server systems and components to original equipment manufacturers.
SMCI's 6-month performance chart shows the stock appreciating 58% versus an 18% gain for the S&P 500 index.
SMCI came public in early 2007 and traded around 10. The stock took off in 2009 and early 2010 soaring to 19. However, it fell last year back to 9. It ha since turned higher. 
SMCI's daily chart shows the stock climbing from 9 to a peak of 16 in February. It then put down a base with two shakeouts to the downside.
The stock moved higher on Thursday and today clears the base.
The stock's TTD momentum indicator (top of chart) is bullish.
The accumulation - distribution line (bottom of chart) is starting to work higher. It was knocked down in October.
This fiscal year ending in June analysts forecast a 42% increase in net to 95 cents a share from 67 cents a year ago. The stock sells with a price-earnings ratio of 18. TTD sees that as a low valuation given the earnings growth rate.
Going out to fiscal 2012 ending in June, the Street projects a 26% gain in net to $1.20 a share from the anticipated 95 cents this year.
Net for the fiscal third quarter ending in March should rise 33% and then in the fourth quarter 42%. So, SMCI is poised to show an acceleration in quarterly earnings growth. That is often a key driver to send a stock higher. For the March quarter net should climb to 24 cents a share from 18 cents a year ago.
The highest estimate on the Street is at 26 cents a share. TTD sees chances for an upside surprise. The prior quarter SMCI topped the consensus estimate by 6 cents a share.
Strategy Opinion TTD is targeting SMCI for a move to 20.50. A protective stop can be placed at 15. TTD rates SMCI a good intermediate-term play.
Sponsorship: Good. The largest fund holder is 4-star rated Fidelity Low-Priced Stock Fund with a big 6.2% stake. It has held its position steady. A key buyer recently was 3-star rated Fidelity Advisor Small Cap Growth Fund which picked up 20,600 shares. It has a 3% stake. SMCI has 37.8 million shares outstanding.
Insider Activity: Neutral. Insiders were buyers using stock options they turned around and sold. The latest selling was at $15.11. Five analysts follow the stock, 3 have a buy, up from one three months ago.

Stock Performance Chart with Quarterly Earnings Markers.

|
TTD's Breakout Profile
Rating |
| TTD Check List | Bullish | Bearish | Neutral |
| Near 52-week High | YES | ||
| Volume | YES | ||
| Tick Volume | YES | ||
| Price Trend - Daily | YES | ||
| Price Trend - Long Term | YES | ||
| Price Daily Spread | YES | ||
| Base Structure | YES | ||
| Base - A-D | YES | ||
| Earnings-Quarterly | YES | ||
| Earnings-Long Term | YES | ||
| Earnings Outlook | YES | ||
| Industry Group | YES | ||
| Prior Breakout Success | YES | ||
| Fund Sponsorship | YES | ||
| Total Score | 13 | 0 | 1 |
Charts of Selected Breakout Stocks
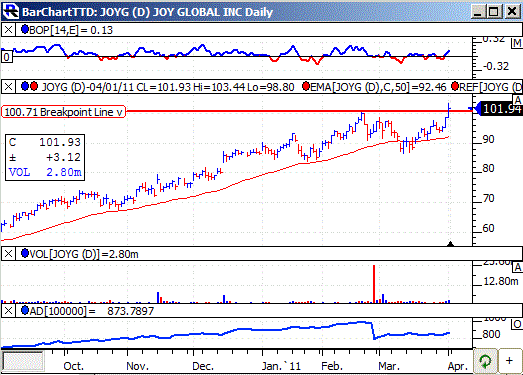
| TTD's Quality Rating of Stock - JOYG - ABOVE AVERAGE |
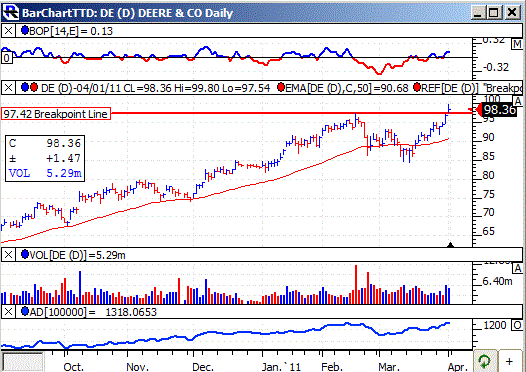
| TTD's Quality Rating of Stock - DE - ABOVE AVERAGE |
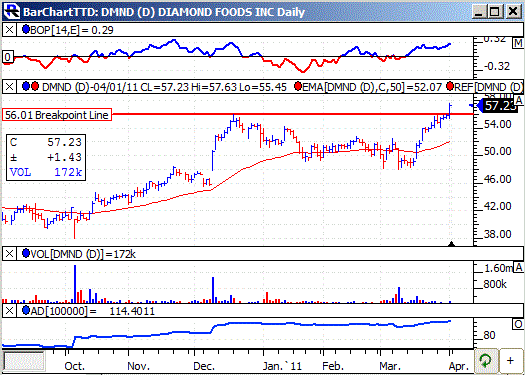
| TTD's Quality Rating of Stock - DMND - ABOVE AVERAGE |
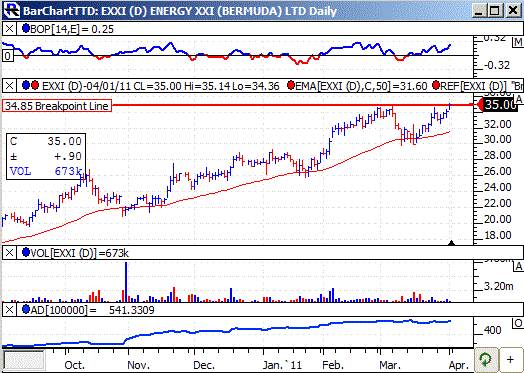
| TTD's Quality Rating of Stock - EXXI - ABOVE AVERAGE |

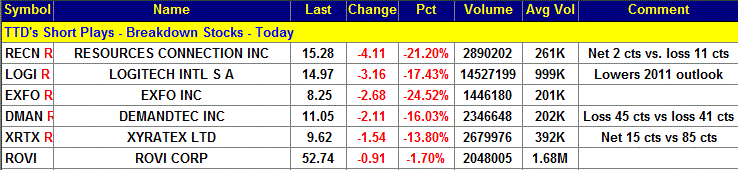
Ticker Tape Digest’s Daily List of “Stocks To Sell or Sell Short” ranks stocks well timed to be sold immediately based on daily trading. The list can be used as an alert to reduce current long-term positions.
Shorts from tape action so far today - 6.
Stocks Screened - 8,300
Long-Term Environment for bears: Unfavorable.
Bear Side - Just a few breakdown stocks today as stock is up slightly. Bears be patient and watchful. TTD's short play from Thursday was Toll Brothers Inc. (TOL) - 19.88, down 0.28. Today it has declined to 19.74 and is working well for bears.
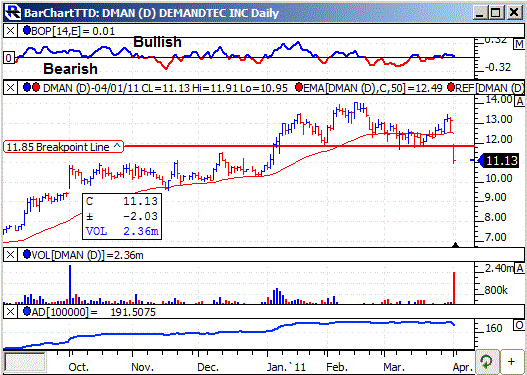
DMAN, based in San Carlos, Ca., produces software for retailers and consumer products companies. Annual revenues: $80 million. DMAN's stock falls sharply today after the company reports a larger quarterly loss. So far today, volume is running at 2.6 million shares 13 times its normal daily volume of 202,000 shares. TTD sees more on the downside. 
DMAN reported a loss for the fourth quarter of 45 cents a share versus a loss of 41 cents a year ago.
DMAN gapped lower in the morning. It touched an intraday low of 10.95 in the morning. The stock then trended sideways the rest of the day unable to rally.
TTD's clip of the tape shows the big block trades so far today. One can see the price of the block trades falling from $11.62 to as low as $11.25.
A key bearish trade came when a block of 70,000 shares crossed at $11.25. That was down from the prior block trade at $11.55. The tape action showed heavy institutional selling pressure.
DMAN's software provides retailers and consumer products companies with pricing, promotion, and other strategic decisions in order to achieve their revenue, profitability and sales volume objectives. The firm's customers include Advance Auto Parts, Best Buy, Circle K Stores, Delhaize America, Giant-Carlisle, H-E-B Grocery Co., Monoprix and Safeway, as well as more than 100 consumer products companies.
Strategy Opinion: TTD is targeting DMAN for a decline to $8.20 within the next few months or sooner. A protective stop buy can be placed at 12.10.
| TTD's Quality Rating of Stock - DMAN - BELOW AVERAGE |
TTD columnist Leo Fasciocco has covered the stock market for over 20 years. His articles appear in many publications. He is also a speaker at the Intershow conferences. He has been on television and radio. He is author of many educational articles about stock investing and the book “Guide To High-Performance Investing.”

For information to subscribe to the Ticker Tape Digest Services call: B. J. Owen at 1-480-926-1680. Distributed by Corona Publishing Enterprises. Ticker Tape Digest Inc. P.O. Box 2044 Chandler, Az. 85244-2044. TTD “Professional Report” is available on the World Wide Web: $100 per month. Password needed. “TTD Professional“ Faxed is $200 per month. The TTD Daily Report is $39.95. Credit cards accepted.
(The information contained has been prepared from data deemed reliable but there is no guarantee of complete accuracy. Ticker Tape Digest Inc. is not affiliated with any broker, dealer or investment advisor. Nothing in this publication constitutes an offer, recommendation or solicitation to buy or sell any securities. Further research is advised. This report is copyrighted and no redistribution is permitted with out permission.)
Copyright - 2011 - Ticker Tape Digest - Corona Publishing Enterprises
