Daily - Go to TTD's Tape of Stock Charts - Wednesday, April 13
|
Daily - Go to TTD's Tape of Stock Charts - Wednesday, April 13 |
|
Weekly - Bullish Conservative Investors - Go To TTD Long-Term Plays - Monday, April 11 |
|
Go to Video Show - "How to Make Money With Breakout Stocks" Go to Video Show -TTD Performance 2008 Long and Short |
|---|

By Leo Fasciocco -- TTD
Ticker Tape Digest presents its daily stock market report containing stocks to go long as breakout trades, quick trades, or bargain trades. We also feature stocks under  Significant Accumulation that are poised to breakout.
|
Ticker Tape Digest's Trading Strategies Overview and Performance Bullish Aggressive Investors Bullish - "Breakout Stocks" - ideally suited for bull markets and special situation stocks. Potential for large returns. Aggressive Investor Bullish- "Quick Trade Stocks" -ideally suited for entry into top performing issues looking for a small quick profit." Conservative Investors "Bargain Buy Trades for the Long Term." Ideally suited for entry into top performing big cap stocks on pullbacks within overall up trend. Bearish Aggressive Bearish Investors - "Breakdown Stocks" to Sell Short. Ideally suited for bear markets or market pull backs. Potential for large returns |
|---|
The TTD report also contains stocks to short as breakdown plays and as bargain (swing trade) shorts.
Investors should tend to try to go with a strategy that fits with the stock market's trend, unless there is a special situation play.
1 - TTD's Breakout Stocks - Long - (Intermediate-term long plays) these are most suitable for aggressive investors seeking ideal entry points into leading stocks, especially during bull markets. They can do extremely well in bull markets with gains of as much as several hundred percent.
These stocks can also do extremely well during strong market rallies, or if they are in a industry group that is performing very well. They tend to have strong earnings outlooks and are near new-52 week, or all-time highs.
2 -TTD Quick Trade Stocks - Long - (Short-term long plays These are leading issues that have pulled back in recent days, but could move higher soon. They are most suitable for Aggressive Investors willing to trade short term. These stocks will do extremely well during market advances. They have about 74% win rate. During market rally sequences the win rate is even higher. The return is small 3% to 8% in just a few days.
3 - TTD's Bargain Buy Trades - Long - (Long Term long plays. These are for conservative bullish Investors These long-term buys are ideally suited for entry into stocks on pull backs within overall up trend. These stocks can give a good return long-term especially during a bull market.
TTD also presents Stocks To Sell or Sell Short. These issues are suitable for aggressive investors willing to take short positions both as trades or for longer-term plays. These stocks will do very well during bear markets or market pull backs.
4 - TTD's Bearish breakdown stocks to sell short. These issues have potential to fall sharply. They often show a technical breakdown and also some fundamental business problem such as weak earnings.
TTD's multi-media updates include a slide-show that presents charts and analysis at midsession. Some times TTD presents feature analysis on stocks and the market. TTD uses Windows Media Files. (WMV).
TTD also presents a "Breakout Watch List" that is up dated daily. This list consists of key stocks in position to breakout. A close watch of this list can put you in the stock just as it breaks out. A good idea is to study the list and be ready to move into a stock quickly as it hits its breakpoint.
TTD often suggests using stop buy orders to enter. It is very important to buy a breakout stock as close as possible to the breakpoint. The idea is to get "elbow room" if the stock should follow through to the upside. This is very important in being successful in making big money with breakout stocks.
It is also essential to have a stop loss strategy for all stocks in which positions are taken. Not every stock will work as expected. It is important for investors to "police" their portfolios and avoid getting trapped in any bad positions.
Quality rating of breakout Two key factors: 1 - Stock near all-time in price or near a 52-week high. 2 - earnings growth current year is strong. The ideal play is a stock with an Above Average Quality Rating. The stock is near a new high and will have strong earnings. TTD's other ratings are Average and Below Average.
TTD also has special feature sections on Educational Tips on Investing.
To email Mr. Leo Fasciocco leo@tickertapedigest.com.For service, email Beverly Owen owen@tickertapedigest.com. TTD’s Tel: 1-480-926-1680.
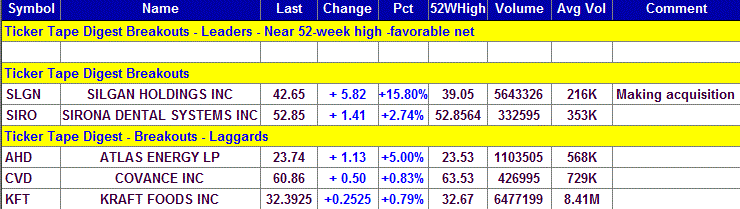
Breakout Stocks
Total Buy Breakouts so far today - 5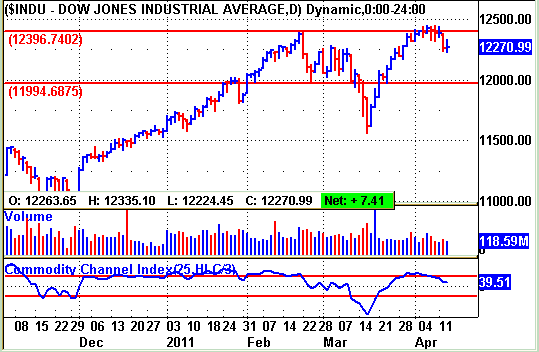
Overall Quality of Breakouts - Below Average
Stocks Screened - 8,300
Bull side - Breakout list small as stock rallies for small gain, with Nasdaq doing the best. Bulls be selective. Stock market is now in a trading range.
(Put mouse on Dow chart to see Nasdaq chart)
Long Term Environment for bulls: Neutral
Market (Daily) - NYSE Bearish, Nasdaq Bearish
Market (Weekly) - NYSE Bearish, Nasdaq Bullish
Market (Monthly) - NYSE Bullish, Nasdaq Bullish
Ticker Tape Digest's
(See Top Performing Breakout Stocks for 2011)
|
TTD's Quality Rating of Stock - AHD - BELOW AVERAGE |
AHD, based in Moon Township, Pa., provides natural gas gathering, processing and treating services. Annual revenues: $935 million. AHD breaks out today from a five-week flat base. The move carries the stock to a 52-week high. The company is a turnaround play. So far today, AHD is trading a heavy 1.6 million shares, triple its normal daily volume of 568,000 shares. 

AHD was formed after Chevron acquired Atlas Energy Inc. for $4.3 billion in February. .
Atlas Energy L.P. was a resulting firm after the merger. The deal provided Atlas Energy Inc. shareholders with cash of $38.25 and units of Atlas Energy L.P.
TTD highlighted AHD as a breakout at our midsession video show on the Web on Wednesday.
AHD's 10-minute chart shows the stock spiking higher in the morning with strong volume.
The stock then trended sideways and then gave some ground late in the day.
TTD's clip shows the recent big block trades in AHD. 
TTD's clip shows heavy accumulation late on Tuesday and early Wednesday.
A big block of 428,393 shares crossed in the morning and then on Wednesday morning a block of 405,799 shares both at the same price of $22.61. That was up from the prior block trade that crossed at $21.56 on 272,000 shares.
AHD is a provider of natural gas gathering, processing and treating services. The company operates natural gas processing plants and natural gas gathering pipelines.
AHD's business is conducted in the midstream segment of the natural gas industry through two reportable segments: Mid-Continent and Appalachia.
The Mid-Continent segment operates gas plants and systems which gathers gas from wells and central delivery points and delivers the natural gas to the firm's processing and treating plants, as well as third-party pipelines.
The Appalachia segment owns and operates natural gas gathering systems in the Appalachian Basin located in Pennsylvania. Atlas Energy, L.P. is headquartered in Moon Township, Pennsylvania
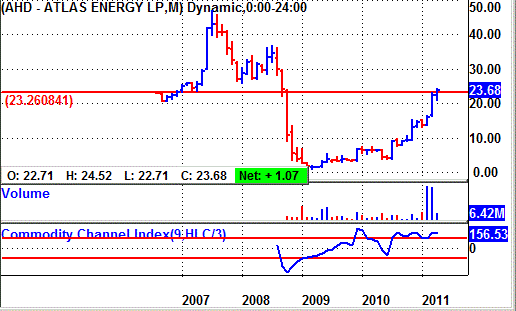
AHD's 12-month performance chart shows the stock appreciating a sensational 260% versus a 15% gain for the S&P 500 index.
AHD's long-term chart shows the stock coming public in 2006 and trading around 23. The stock climbed to a peak of 47 in 2007. It was then pulled lower during the bear market falling to as low as 77 cents. Ouch! The stock has since made a strong comeback.
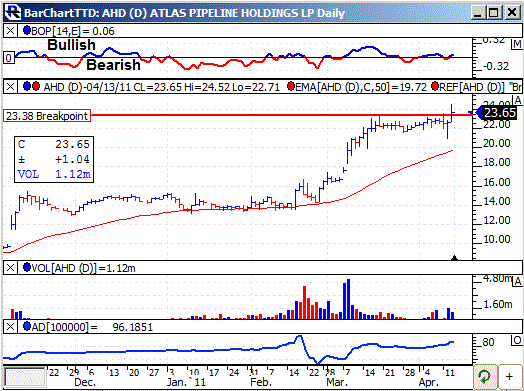
AHD's daily chart shows the stock breaking out from a base in February at 16. The stock moved up to 23. Today, it breaks out from a smaller base and resumes its up trend. The 5-week base was set up well and above a rising 50-day moving average line.
The stock's TTD momentum indicator (top of chart) is slightly bullish.
The accumulation - distribution line (bottom of chart) is now in a strong up trend and is bullish.
AHD is a powerful turnaround play.
This year, analysts forecast a profit of $1.38 a share compared with a loss of 15 cents a share a year ago. The stock sells with a price-earnings ratio of 16. TTD sees that as attractive to value investors.
Next year, the Street projects a 55% surge in net to $2.15 a share from the anticipated $1.38 for 2011.
Net for the upcoming first quarter should come in at 13 cents a share compared with a loss of 5 cents a share a year ago. Looking out to the second quarter net should hit 30 cents a share compared with a loss of 4 cents a share a year ago.
Strategy Opinion: TTD is targeting AHD for a move to 30. A protective stop can be placed near 21. TTD rates AHD a good intermediate-term play provided earnings meet expectations.
Sponsorship: Good. The largest fund holder is Fidelity Advisor Small Cap Fund with a big 8.8% stake. The 4-star rated fund was a recent seller of 100,000 shares. A key buyer recently was 3-star rated Empiric Core Equity Fund which added 32,000 shares. AHD has 51.2 million shares outstanding.
Insider Activity: Neutral. Not much activity. Three analysts follow the stock, one has a buy, up from none three months ago.
Stock Performance Chart with Quarterly Earnings Markers.

| TTD's Breakout Profile
Rating Atlas Energy L.P. - (AHD) |
| TTD Check List | Bullish | Bearish | Neutral |
| Near 52-week High | YES | ||
| Volume | YES | ||
| Tick Volume | YES | ||
| Price Trend - Daily | YES | ||
| Price Trend - Long Term | YES | ||
| Price Daily Spread | YES | ||
| Base Structure | YES | ||
| Base - A-D | YES | ||
| Earnings-Quarterly | YES | ||
| Earnings-Long Term | YES | ||
| Earnings Outlook | YES | ||
| Industry Group | YES | ||
| Prior Breakout Success | YES | ||
| Fund Sponsorship | YES | ||
| Total Score | 12 | 1 | 1 |
Charts of Selected Breakout Stocks
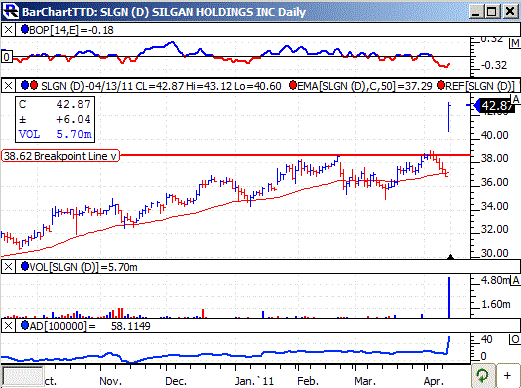
| TTD's Quality Rating of Stock - SLGN - AVERAGE |
| TTD's Quality Rating of Stock - SIRO - AVERAGE |

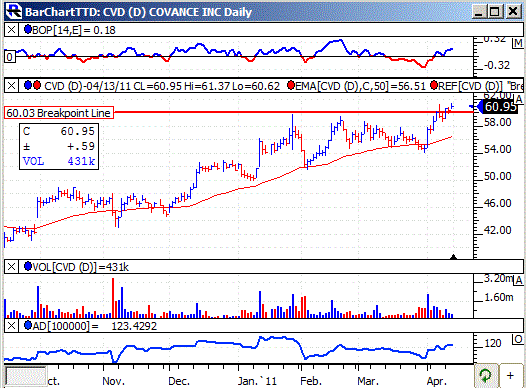
| TTD's Quality Rating of Stock - CVD - BELOW AVERAGE |
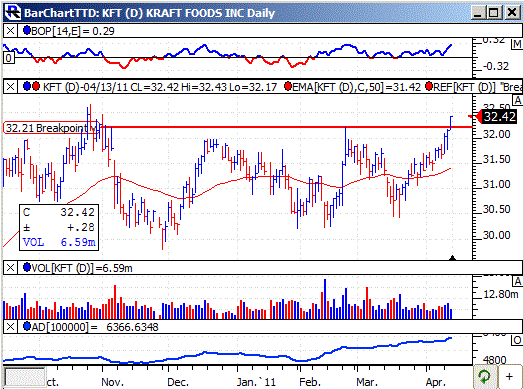
| TTD's Quality Rating of Stock - KFT - BELOW AVERAGE |

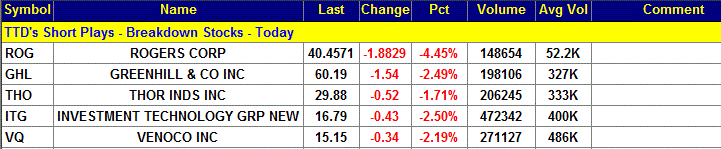
Ticker Tape Digest’s Daily List of “Stocks To Sell or Sell Short” ranks stocks well timed to be sold immediately based on daily trading. The list can be used as an alert to reduce current long-term positions.
Shorts from tape action so far today - 5
Stocks Screened - 8,300
Long-Term Environment for bears: Unfavorable.
Bear Side - Small number of breakdown stocks as stock market rallies to erase today's loss. Bears remain selective.
THO, based in Jackson Center, Ohio, produces recreational vehicles and buses. Annual revenues: $2.5 billion. THO's stock breaks below key technical support today. The stock has been weak the past several sessions. The company will show a significant slowdown in earnings growth. So far today, THO is trading 297,256 shares. Its average daily volume is 333,000 shares. TTD sees more on the downside. 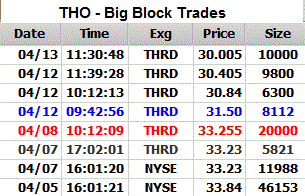
THO's stock rose in the morning hitting a peak of 30.77. However, it then worked lower the rest of the morning sinking to as low as 29.84. It then trended sideways in the afternoon.
TTD's clip of the tape shows the recent big block trades.
One can see the price for the blocks declining from $33.84 to as low as $30. The tape shows heavy selling pressure. A key bearish block came on Tuesday when 6,300 shares crossed the tape at $30.84. That was down from the prior block trade at $31.50.
THO has a beta of 2.05 versus 1.00 for the stock market. So, THO tends to be twice as volatile as the stock market.
THO makes recreational vehicles and small and mid-size buses in the United States and Canada. The company also makes axles and suspension systems.
This fiscal year ending in July analysts forecast a 3% rise in net to $2.10 a share from $2.04 a year ago.
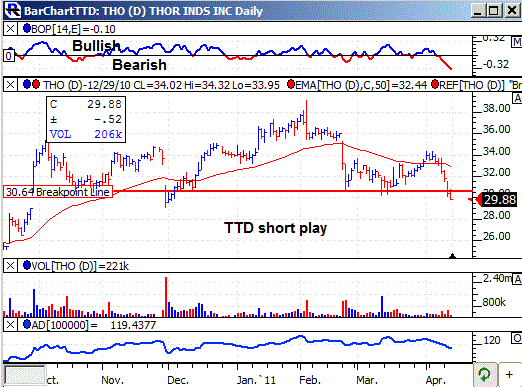
THO's daily chart shows the stock cutting below key support from a pattern that has the look of a head-and-shoulder top. The stock's TTD momentum indicator (top of chart) is very bearish. The accumulation - distribution line (bottom of chart) is now in a down trend showing clear selling pressure.
Strategy Opinion: TTD is targeting THO for a decline to 25 within the next few months, or sooner. A protective stop buy can be placed near 32. TTD sees THO as a trading short.
| TTD's Quality Rating of Stock - THO - AVERAGE |
TTD columnist Leo Fasciocco has covered the stock market for over 20 years. His articles appear in many publications. He is also a speaker at the Intershow conferences. He has been on television and radio. He is author of many educational articles about stock investing and the book “Guide To High-Performance Investing.”

For information to subscribe to the Ticker Tape Digest Services call: B. J. Owen at 1-480-926-1680. Distributed by Corona Publishing Enterprises. Ticker Tape Digest Inc. P.O. Box 2044 Chandler, Az. 85244-2044. TTD “Professional Report” is available on the World Wide Web: $100 per month. Password needed. “TTD Professional“ Faxed is $200 per month. The TTD Daily Report is $39.95. Credit cards accepted.
(The information contained has been prepared from data deemed reliable but there is no guarantee of complete accuracy. Ticker Tape Digest Inc. is not affiliated with any broker, dealer or investment advisor. Nothing in this publication constitutes an offer, recommendation or solicitation to buy or sell any securities. Further research is advised. This report is copyrighted and no redistribution is permitted with out permission.)
