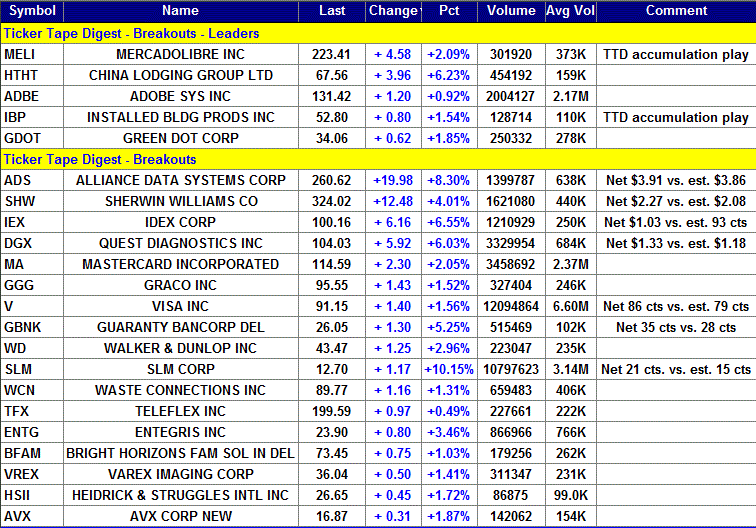
Daily - Go to TTD's Chart scroller of Breakout Stocks - Thursday, April 20, 2017
|
Daily - Go to TTD's Chart scroller of Breakout Stocks - Thursday, April 20, 2017 |
|
Weekly - Bullish Conservative Investors - Go To TTD Long-Term Plays - Monday, April 17, 2017 |
|
|
Go to Video Show - "How to Make Money With Breakout Stocks |
|---|

By Leo Fasciocco -- TTD
Ticker Tape Digest presents its daily stock market report containing stocks to go long as breakout trades, quick trades, or bargain trades. We also feature stocks under Significant Accumulation that are poised to breakout.
|
Ticker Tape Digest's Daily schedule guide for TTD subscribers 1. Pre-market - check Breakout Watch List and Quick Trades. 2. Morning - (11:30 - 12 A.M.) - check breakout stocks tape and breakout chart slide show. 3. Midday (1 P.M.) check TTD Midsession Report and see market video show. 4. After close (4 P.M.) check final TTD Report for day. Trading Strategies Bullish Aggressive Investors Bullish - "Breakout Stocks" - ideally suited for bull markets and special situation stocks. Potential for large returns. (See Performance) Aggressive Investor Bullish- "Quick Trade Stocks" -ideally suited for entry into top performing issues looking for a small quick profit." (See Performance) Conservative Investors "Bargain Buy Trades for the Long Term." Ideally suited for entry into top performing big cap stocks on pullbacks within overall up trend.(See Performance) Bearish Aggressive Bearish Investors - "Breakdown Stocks" to Sell Short. Ideally suited for bear markets or market pull backs. Potential for large returns (See Performance) |
|---|
The TTD report also contains stocks to short as breakdown plays and as bargain (swing trade) shorts.
Investors should tend to try to go with a strategy that fits with the stock market's trend, unless there is a special situation play.
TTD's Breakout Stocks - Long are
most suitable for aggressive investors seeking ideal entry points into leading stocks, especially during bull markets. They can do extremely well in bull markets with gains of as much as several hundred percent. 
These stocks can also do extremely well during strong market rallies, or if they are in a industry group that is performing very well. They tend to have strong earnings outlooks and are near new-52 week, or all-time highs.
TTD Quick Trade Stocks - Long These are leading issues that have pulled back in recent days, but could move higher soon. They are most suitable for Aggressive Investors willing to trade short term. These stocks will do extremely well during market advances. They have about 74% win rate. During market rally sequences the win rate is even higher. The return is small 3% to 8% in just a few days.
TTD's Bargain Buy Trades - Long - Long Term. These are for conservative bullish Investors These long-term buys are ideally suited for entry into stocks on pull backs within overall up trend. These stocks can give a good return long-term especially during a bull market.
TTD also presents Stocks To Sell or Sell Short. These issues are suitable for aggressive investors willing to take short positions both as trades or for longer-term plays. These stocks will do very well during bear markets or market pull backs.
TTD's Bearish breakdown stocks to sell short. These issues have potential to fall sharply. They often show a technical breakdown and also some fundamental business problem such as weak earnings.
TTD's multi-media updates include a slide-show that presents charts and analysis at midsession. Some times TTD presents feature analysis on stocks and the market. TTD uses Windows Media Files. (WMV).
TTD also presents a "Breakout Watch List" that is up dated daily. This list consists of key stocks in position to breakout. A close watch of this list can put you in the stock just as it breaks out. A good idea is to study the list and be ready to move into a stock quickly as it hits its breakpoint.
TTD often suggests using stop buy orders to enter. It is very important to buy a breakout stock as close as possible to the breakpoint. The idea is to get "elbow room" if the stock should follow through to the upside. This is very important in being successful in making big money with breakout stocks.
It is also essential to have a stop loss strategy for all stocks in which positions are taken. Not every stock will work as expected. It is important for investors to "police" their portfolios and avoid getting trapped in any bad positions.
Quality rating of breakout Two key factors: 1 - Stock near all-time high in price or near a 52-week high. 2 - earnings growth current year is strong. The ideal play is a stock with an Above Average Quality Rating. The stock is near a new high and will have strong earnings. TTD's other ratings are Average and Below Average.
TTD also has special feature sections on Educational Tips on Investing.
To email Mr. Leo Fasciocco leo@tickertapedigest.com. For service, email Beverly Owen owen@tickertapedigest.com. TTD’s Tel: 1-480-926-1680.
Thursday - April 20, 2017
TTD's Breakout Stocks
Stock Market Overview
Total Buy Breakouts so far today - 31
Quality of Breakouts - Above Average
Stocks Screened - 12,234
Bull side - Large number of breakouts Thursday as earnings reports flow in. Bulls can be venturesome.
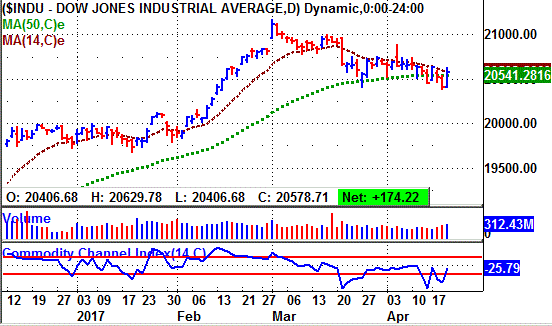
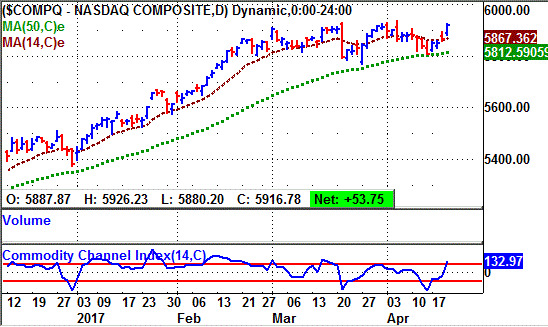
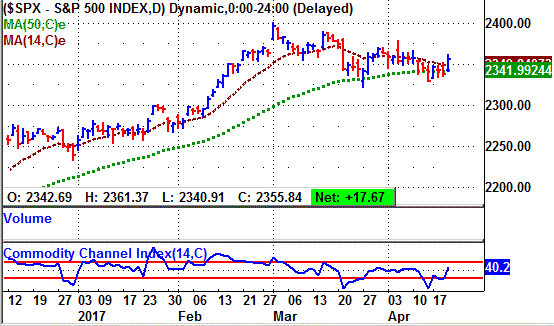
Stock market - Broad lift in market carries the S&P daily back to bullish. Dow daily still lags. Nasdaq strong.
Stock Market Momentum
(Based on 14 unit moving average)
|
Market (Daily) |
Market (Weekly) |
Market (Monthly) |
|
Dow - Bearish |
Dow - Bullish |
Dow - Bullish, |
|
Nasdaq - Bullish |
Nasdaq - Bullish |
Nasdaq - Bullish |
|
S&P 500 - Bullish |
S&P 500 - Bullish |
S&P 500 - Bullish |
Ticker Tape Digest's
|
TTD's Quality Rating of Stock - ADBE - ABOVE AVERAGE |
ADBE, based in San Jose, Ca., provides imaging software for the web and print. Annual revenues: $6.2 billion. ADBE's stock breaks out Thursday from a six-week flat base. The move carries the stock to a new all-time high. That is bullish. ADBE is a leader. 
So far today, ADBE is trading 2 million shares. Its average daily volume is 2.2 million shares.
ADBE's stock rose steadily in the morning and cleared its breakpoint line.
The stock reached an all-time high of $131.99 in the early afternoon. (see 10-minute chart) 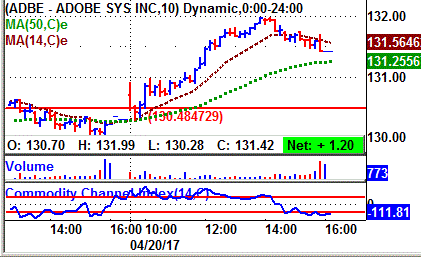
The stock reached an intraday high of $108.23 in the afternoon.
It then backed off slightly in the afternoon, but held above its breakpoint line.
Tape Action
ADBE's tape action shows the recent block trades.
One can see the price for the blocks advancing from $120.39 in the prior session to as high as $131.95 in the afternoon.
A key bullish trade came in the morning when a block of 23,955 shares (duplicated) crossed the tape at $130.70.
That was up from the prior block at $130.55 on 30,907 shares late in the prior session.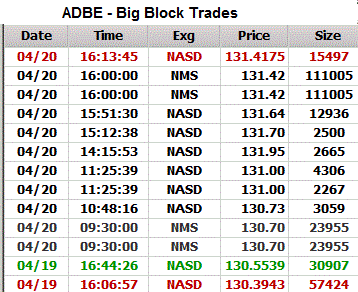
Business
ADBE provides graphic design, publishing, and imaging software for Web and print.
It offers a line of application software products for producing, distributing, and managing information.
The company license its industry-standard technologies to major hardware manufacturers, software developers, and service providers.
Charts
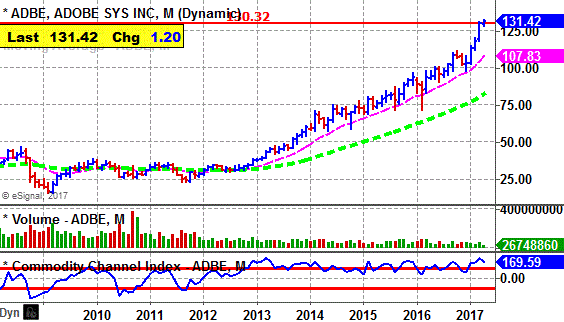
There was heavy insider selling in early 2017 at $113 to $130. (see red bars on performance chart).
Some insiders were buyers recently at $42 using stock options.
ADBE's long-term chart shows the stock reaching a peak of $48 in 2007, the top in the prior bull market.
The stock then fell back to $15.70 by early 2009 due to the following bear market.
ADBE then trend in a trading range until 2013. It broke out and has since trended steadily higher.
The stock came public back in 1986. It has gone through six 2-for-1 stock splits.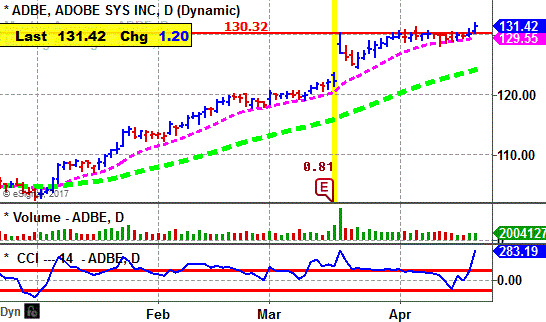
ADBE's daily chart shows the stock climbing from near $100 in January to a peak near $130.
The stock pulled back slightly and then formed its flat base well above its rising 50-day moving average line.
The breakout clears resistance.
The CCI momentum indicator is strongly bullish.
Earnings Outlook
Analysts expect net for the fiscal year ending in November 2017 to jump 28% to $3.21 a share from $2.51 a year ago.
Analysts have been raising their 2017 estimates.
The stock has a price-earnings ratio of 34. That is high but okay given the earnings growth rate this year and next and the historical price pattern.
Looking ahead to fiscal 2018 ending in November, the Street is forecasting a 27% jump in profits to $4.09 a share from the anticipated $3.21 this fiscal year.
Earnings for the upcoming fiscal second quarter ending in May should surge 39% to 77 cents a share form 55 cents the year before.
ADBE has topped the consensus estimate the past eight quarters.
Going out to the fiscal third quarter ending in August, net should advance 31% to 79 cents a share from 60 cents a year ago.
Strategy Opinion: TTD is targeting ADBE for a move to $155 on this breakout. A protective stop can be placed near $125.
TTD rates ADBE a good intermediate-term play. The stock is a leader.
Suitability: Aggressive Bulls.
TTD's special research of Stock's Prior Performance:
Probability - Breakout Success - Average. ADBE scored a good gain off its recent breakout. It has not done that well off prior breakouts.
Probability - Earnings Response - Above Average. ADBE has moved higher 10 times after its past 13 earnings reports when there was a significant move. That is impressive.
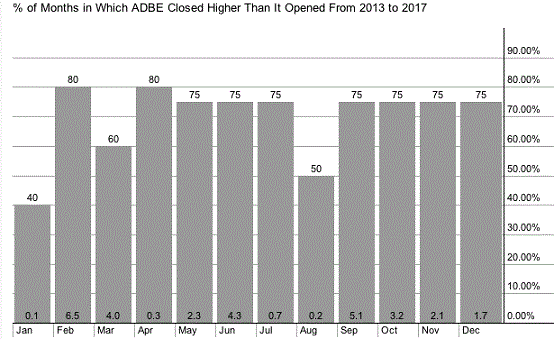
Probability: Seasonal Success - Average. ADBE has risen a modest 0.3% in the past 5 Aprils. It has climbed an average of 2.3% in May.
Stock's Prior Performance After A Breakout
|
Stock's % Change from Breakout to peak - prior to cut below 50-day M/A. |
Date of Breakout |
Break point Price |
Stocks Price Peak after Breakout - prior to cut below 50-day M/A |
Date Trade Closed |
|
19% |
1/20/2017 | 109.75 | 131.42 | Still in play |
|
4% |
8/10/2016 | 99.02 | 103.57 | 9/2/2016 |
|
2% |
5/24/2016 | 97.43 | 100.04 | 6/1/2016 |
| 8% | 10/15/2015 | 86.37 | 94.02 | 12/15/2015 |
| 8% | 6/22/2015 | 80.13 | 86.77 | 8/17/2015 |
| 12% | 2/11/2014 | 61.96 | 69.92 | 2/27/2014 |
(In actual trading, entry and exit points could vary depending on broker execution.
Also, ideal are breakouts to a new 52-week high or better, perhaps all-time highs.)
Stock's Long-term Chart
Stock's Performance Chart with Quarterly Earnings Markers vs. S&P 500
Insider Buying in Green - Insider Selling in Red

Stock's Monthly Seasonal Performance Chart - Past 5 Years
Showing % Months UP and % Change
Charts of Selected Breakout Stocks
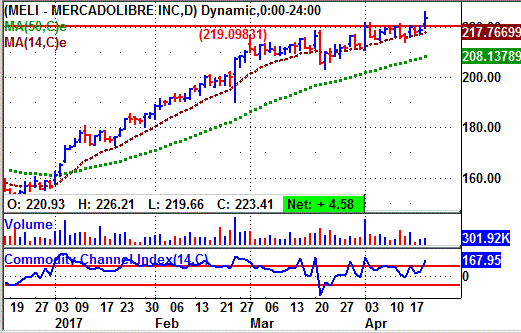
| TTD's Quality Rating of Stock - MELI - ABOVE AVERAGE |
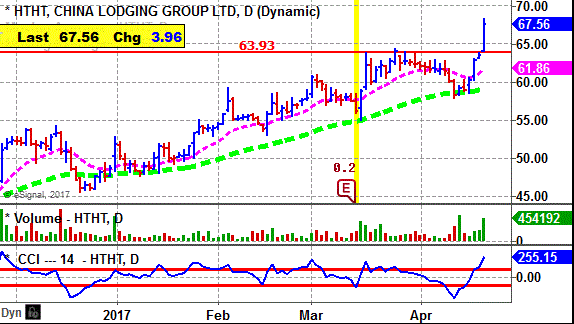
| TTD's Quality Rating of Stock - HTHT - ABOVE AVERAGE |
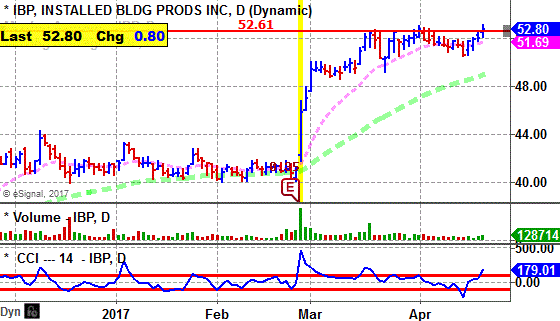
| TTD's Quality Rating of Stock - IBP - ABOVE AVERAGE |
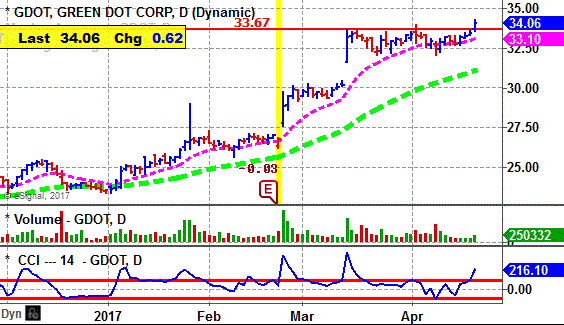
| TTD's Quality Rating of Stock - GDOT - ABOVE AVERAGE |

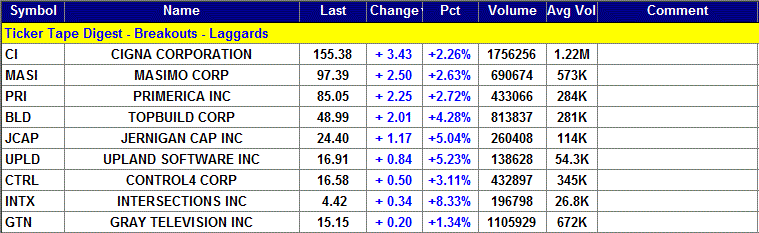
Ticker Tape Digest’s Daily List of “Stocks To Sell or Sell Short” ranks stocks well timed to be sold immediately based on daily trading. The list can be used as an alert to reduce current long-term positions.
Shorts from tape action so far today - 7
Stocks Screened - 12,234
Long-Term Environment for bears: Unfavorable.
Bear Side - Small list of breakdown stocks, but some interesting plays. Several of the shorts are showing disappointing earnings.
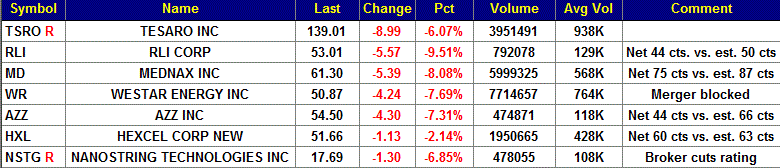
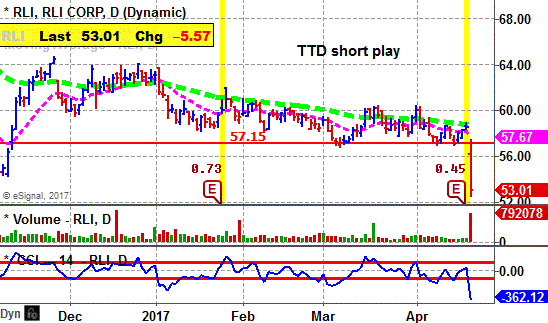
RLI, based in Peoria, Ill., is a specialty insurance company. Annual revenues: $816 million. RLI's stock falls sharply Thursday after reporting disappointing quarterly earnings. TTD sees more on the downside. 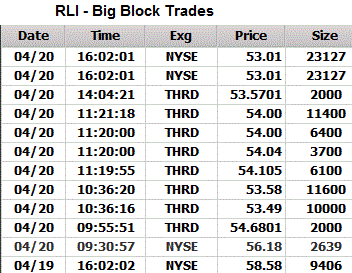
TTD highlighted RLI as a short at our midsession video show on the Web.
So tar today, RLI is trading a heavy 792,078 shares, six times its average daily volume of 129,000 shares.
RLI reported net for the first quarter of 44 cents a share. That was below the consensus estimate on the Street of 50 cents a share.
The stock fell in the morning touching an intraday low of $52.51.
It then trended mostly sideways the rest of the day.
Tape Action
One can see the price for the recent block trades falling from $58.58 in the prior session to as low as $53.49.
A key bearish trade came in the morning when a block 2,639 shares crossed the tape at $56.18.
That was down from the prior block trade at $58.58 on 9,406 shares.
Business
RLI underwrites selected property and casualty insurance through subsidiaries, as well as offers insurance coverages.
Its casualty business consists of commercial and personal umbrella, general liability, commercial transportation, professional services, small commercial, executive products, medical professional liability and other businesses.
Its property insurance covers commercial property, marine, personal, property reinsurance and crop reinsurance.
Earnings:
This year, analysts were forecasting a 1% increase in net to $2.11 a share from $2.08 the year before. That estimate should come down.
Net for the upcoming second quarter is expected to decline 7% to 57 cents a share from 61 cents the year before.
Charts:
RLI's daily chart shows the stock cutting below key technical support with a big pick up in volume.
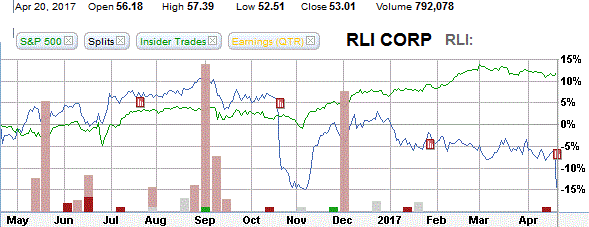
The 12-month performance chart shows RLI down 15% versus a 13% gain for the stock market.
Insiders were light buyers recently at $70 to $60 a share. They were sellers around $58 to $61 recently.
Strategy Opinion: TTD is targeting RLI for a decline to $46 within the next few months, or sooner. A protective stop buy can be placed near $55.50.
Suitability: Trading Bears.
TTD's special probability research of RLI's Prior Performance:
Probability - Earnings Response - Bearish. Stock rose 5 out of the past 12 earnings reports when there was a significant change.
Probability: Seasonal Activity -- Extremely Bearish. RLI has declined an average of 5.3% in April the past five years. April is its most bearish month. It rose an average of 2.5% in May.
| TTD's Quality Rating of Stock - RLI - BELOW AVERAGE |
Stock Performance Chart with Quarterly Earnings Markers vs. S&P 500
Insider Buying in Green - Insider Selling in Red
TTD columnist Leo Fasciocco has covered the stock market for over 30 years. His articles appear in many publications. He is also a speaker at the Intershow conferences. He has been on television and radio. He is author of many educational articles about stock investing and the book “Guide To High-Performance Investing.”

For information to subscribe to the Ticker Tape Digest Services call: Beverly Owen at 1-480-926-1680. Distributed by Corona Publishing Enterprises. Ticker Tape Digest Inc. P.O. Box 2044 Chandler, Az. 85244-2044. TTD “Professional Report” is available on the World Wide Web: $100 per month. Password needed. “TTD Professional“ Faxed is $200 per month. The TTD Daily Report is $39.95. Credit cards accepted.
(The information contained has been prepared from data deemed reliable but there is no guarantee of complete accuracy. Ticker Tape Digest Inc. is not affiliated with any broker, dealer or investment advisor. Nothing in this publication constitutes an offer, recommendation or solicitation to buy or sell any securities. Further research is advised. This report is copyrighted and no redistribution is permitted with out permission.)