Daily - Go to TTD's Chart scroller of Breakout and Leading Stocks - Thursday, April 21, 2016
|
Daily - Go to TTD's Chart scroller of Breakout and Leading Stocks - Thursday, April 21, 2016 |
|
Weekly - Bullish Conservative Investors - Go To TTD Long-Term Plays - Monday, April 18, 2016 |
|
Go to Video Show - "How to Make Money With Breakout Stocks" |
|---|

By Leo Fasciocco -- TTD
Ticker Tape Digest presents its daily stock market report containing stocks to go long as breakout trades, quick trades, or bargain trades. We also feature stocks under Significant Accumulation that are poised to breakout.
|
Ticker Tape Digest's Daily schedule guide for TTD subscribers 1. Pre-market - check Breakout Watch List and Quick Trades. 2. Morning - (11:30 - 12 A.M.) - check breakout stocks tape and breakout chart slide show. 3. Midday (1 P.M.) check TTD Midsession Report and see market video show. 4. After close (4 P.M.) check final TTD Report for day. Trading Strategies Bullish Aggressive Investors Bullish - "Breakout Stocks" - ideally suited for bull markets and special situation stocks. Potential for large returns. (See Performance) Aggressive Investor Bullish- "Quick Trade Stocks" -ideally suited for entry into top performing issues looking for a small quick profit." (See Performance) Conservative Investors "Bargain Buy Trades for the Long Term." Ideally suited for entry into top performing big cap stocks on pullbacks within overall up trend.(See Performance) Bearish Aggressive Bearish Investors - "Breakdown Stocks" to Sell Short. Ideally suited for bear markets or market pull backs. Potential for large returns (See Performance) |
|---|
The TTD report also contains stocks to short as breakdown plays and as bargain (swing trade) shorts.
Investors should tend to try to go with a strategy that fits with the stock market's trend, unless there is a special situation play.
TTD's Breakout Stocks - Long are
most suitable for aggressive investors seeking ideal entry points into leading stocks, especially during bull markets. They can do extremely well in bull markets with gains of as much as several hundred percent. 
These stocks can also do extremely well during strong market rallies, or if they are in a industry group that is performing very well. They tend to have strong earnings outlooks and are near new-52 week, or all-time highs.
TTD Quick Trade Stocks - Long These are leading issues that have pulled back in recent days, but could move higher soon. They are most suitable for Aggressive Investors willing to trade short term. These stocks will do extremely well during market advances. They have about 74% win rate. During market rally sequences the win rate is even higher. The return is small 3% to 8% in just a few days.
TTD's Bargain Buy Trades - Long - Long Term. These are for conservative bullish Investors These long-term buys are ideally suited for entry into stocks on pull backs within overall up trend. These stocks can give a good return long-term especially during a bull market.
TTD also presents Stocks To Sell or Sell Short. These issues are suitable for aggressive investors willing to take short positions both as trades or for longer-term plays. These stocks will do very well during bear markets or market pull backs.
TTD's Bearish breakdown stocks to sell short. These issues have potential to fall sharply. They often show a technical breakdown and also some fundamental business problem such as weak earnings.
TTD's multi-media updates include a slide-show that presents charts and analysis at midsession. Some times TTD presents feature analysis on stocks and the market. TTD uses Windows Media Files. (WMV).
TTD also presents a "Breakout Watch List" that is up dated daily. This list consists of key stocks in position to breakout. A close watch of this list can put you in the stock just as it breaks out. A good idea is to study the list and be ready to move into a stock quickly as it hits its breakpoint.
TTD often suggests using stop buy orders to enter. It is very important to buy a breakout stock as close as possible to the breakpoint. The idea is to get "elbow room" if the stock should follow through to the upside. This is very important in being successful in making big money with breakout stocks.
It is also essential to have a stop loss strategy for all stocks in which positions are taken. Not every stock will work as expected. It is important for investors to "police" their portfolios and avoid getting trapped in any bad positions.
Quality rating of breakout Two key factors: 1 - Stock near all-time high in price or near a 52-week high. 2 - earnings growth current year is strong. The ideal play is a stock with an Above Average Quality Rating. The stock is near a new high and will have strong earnings. TTD's other ratings are Average and Below Average.
TTD also has special feature sections on Educational Tips on Investing.
To email Mr. Leo Fasciocco leo@tickertapedigest.com.For service, email Beverly Owen owen@tickertapedigest.com. TTD’s Tel: 1-480-926-1680.
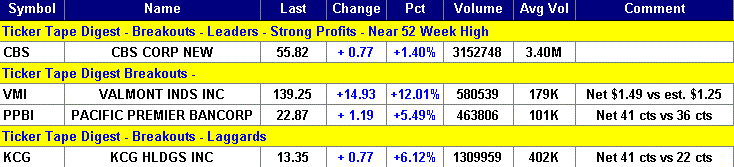
Breakout Stocks
Total Buy Breakouts so far today - 4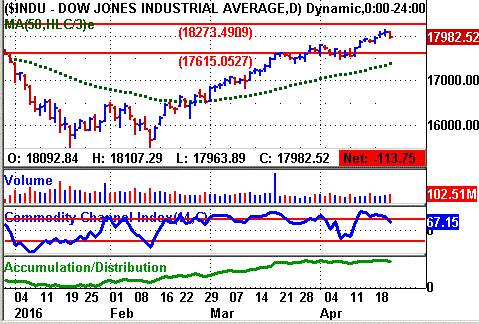
Overall Quality of Breakouts - AVERAGE
Stocks Screened - 8,300
Bull side - Small list of breakout stocks. Bulls be conservative. Stock market now pulling back after strong rally from low in February.
(Put mouse on Dow chart to see Nasdaq chart)
Long Term Environment for bulls: Neutral
Stock Market Momentum
Market (Daily) - NYSE Bearish, Nasdaq Bearish
Market (Weekly) - NYSE Bullish, Nasdaq Bullish
Market (Monthly) - NYSE Bullish, Nasdaq Bullish
Ticker Tape Digest's
|
TTD's Quality Rating of Stock - CBS - ABOVE AVERAGE |
CBS, based in New York, is a media firm operating in the entertainment, cable network, publishing, and local broadcasting sectors. Annual revenues: $13.9 billion. CBS's stock pushes higher Thursday to clear a six-week flat base. 
So far today, CBS is trading 3.2 million shares. Its average daily volume is 3.4 million shares. 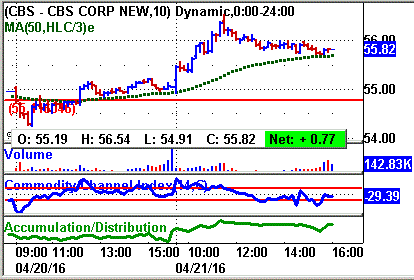
CBS's 10-minute chart shows the stock clearing its breakpoint line in the morning.
The stock then rallied to an intraday peak of 56.54 in the morning.
CBS then backed off slightly and trended mostly sideways into the final bell.
CBS's tape action shows the recent block trades.
One can see the price for the blocks climbing from $54.90 in the prior session to as high as $56.25 Thursday.
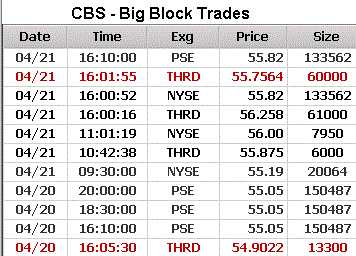 A key bullish trade came late in the prior session when a massive block of 150,487 shares crossed the tape near the close at $55.05.
That was up from the prior block at $54.90 on 13,300 shares.
CBS's entertainment segment distributes news and public affairs broadcasts, and sports and entertainment programming/
It also operates online content networks for information and entertainment; and produces motion pictures.
The cable networks segment offers subscription program services, such as original series, theatrical feature films, documentaries, boxing and other sports programming.
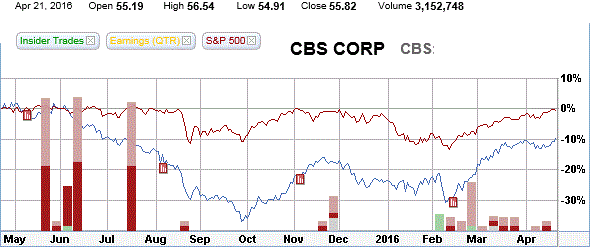
CBS's 12-month performance chart shows the stock flat compared with a 10% decline in the stock market.
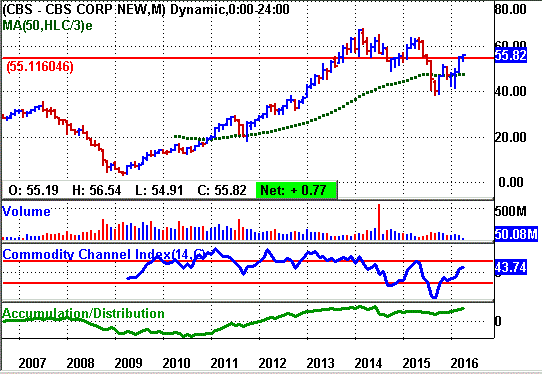
CBS's long-term chart shows the stock reaching a peak of 35.75 in 2007, the top in the prior bull market.
The stock then fell back to $3.08 in 2009 due to the bear market. Afterwards, CBS rose steadily reaching a peak of 68.10 in early 2014. Afterwards the sock worked lower down to 40, but has now turned back up with a nice rally.
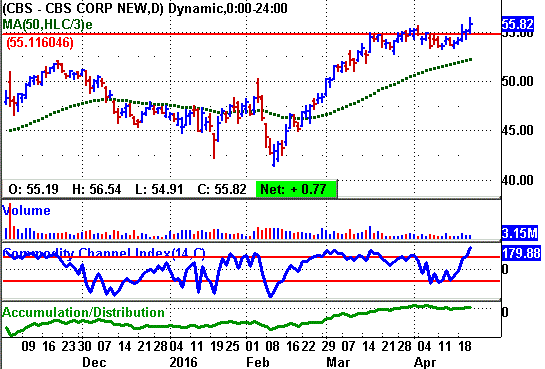
CBS's daily chart shows the stock climbing from 43 in February to a peak near 55 by mid-March.
The stock then put down a flat base above its rising 50-day moving average line.
The breakout Thursday clears the bas nicely.
CBS's CCI momentum indicator (bottom of chart) is solidly bullish.
The accumulation - distribution line (bottom of chart) compliments the price action.
This year analysts are forecasting a 21% increase in CBS's net to $4 a share from $3.31 a year ago.
The stock sells with a price-earnings ratio of 13. TTD sees that as low given the earnings growth rate.
Looking out to 2017, analysts predict a 10% rise in net to $4.42 a share from the $4 anticipated for this year. 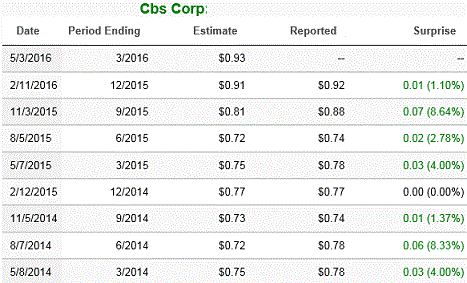
Net for the upcoming first quarter should increase 19% to 93 cents a share from 78 cents a year before.
The highest estimate on the Street for the quarter is at 96 cents a share.
CBS tends to top its quarterly net forecast. (see table)
Net for the second quarter is projected to increase 20% to 89 cents a share from 74 cents the year before.
Strategy Opinion: TTD is targeting CBS for a move to 65 off this breakout. A protective stop can be placed near 52.
TTD rates CBS an average intermediate-term play.
Sponsorship: Excellent. The largest fund buyer recently was the 4-star rated Artisan Mid Cap Investor Fund which purchased 1.8 million shares as a new position. It has a 0.4% stake.
The largest fund holder is the 4-star rated VA CollegeAmerica Growth Fund of America 529F with a 2% stake. It was a recent purchaser of 975,000 shares.
CBS has 417 million shares outstanding. Institutions hold 86% of the stock and insiders 3%.
Insider Activity: Bearish. Insiders were recent buyers using stock options at $29 a share. They were sellers at $50 to $52.
Currently, 36 analysts follow the stock, 27 have a buy, up from 24 three months ago. RBC put out an outperform on April 8.
CBS has a book value of $12.02 a share.
Stock Performance Chart with Quarterly Earnings Markers.
| TTD's Breakout Profile
Rating CBS Corp. - (CBS) |
| TTD Check List | Bullish | Bearish | Neutral |
| Near 52-week High | YES | ||
| Volume | YES | ||
| Tick Volume | YES | ||
| Price Trend - Daily | YES | ||
| Price Trend - Long Term | YES | ||
| Price Daily Spread | YES | ||
| Base Structure | YES | ||
| Base - A-D | YES | ||
| Earnings-Quarterly | YES | ||
| Earnings-Long Term | YES | ||
| Earnings Outlook | YES | ||
| Industry Group | YES | ||
| Prior Breakout Success | YES | ||
| Fund Sponsorship | YES | ||
| Total Score | 12 | 0 | 2 |
Charts of Selected Breakout Stocks
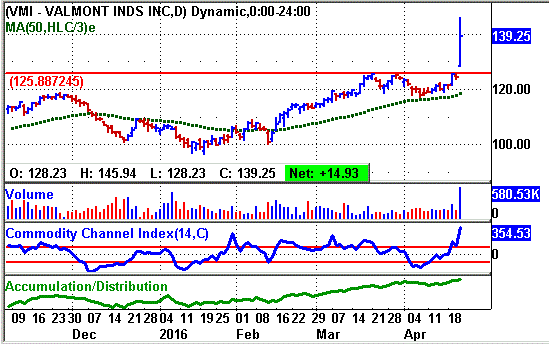
| TTD's Quality Rating of Stock - VMI - AVERAGE |
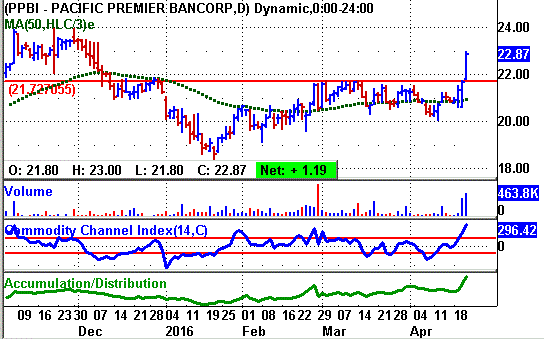
| TTD's Quality Rating of Stock - PPBI - AVERAGE |
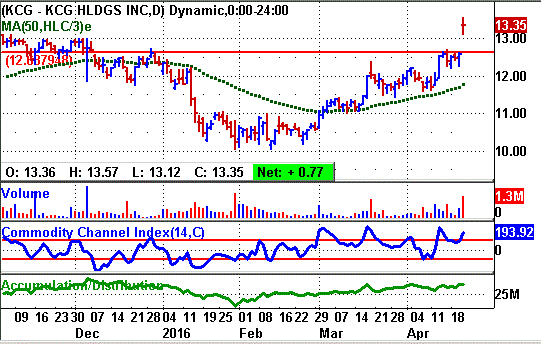
| TTD's Quality Rating of Stock - KCG - BELOW AVERAGE |

Ticker Tape Digest’s Daily List of “Stocks To Sell or Sell Short” ranks stocks well timed to be sold immediately based on daily trading. The list can be used as an alert to reduce current long-term positions.
Shorts from tape action so far today - 6
Stocks Screened - 8,300
Long-Term Environment for bears: Neutral.
Bear Side - Small list of breakdown stocks Thursday, but some interesting plays for aggressive bears.
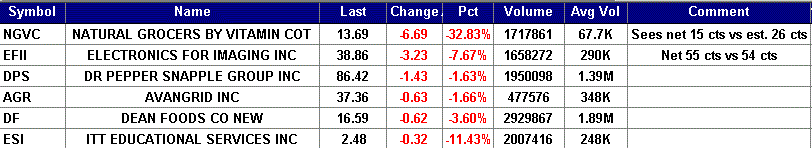
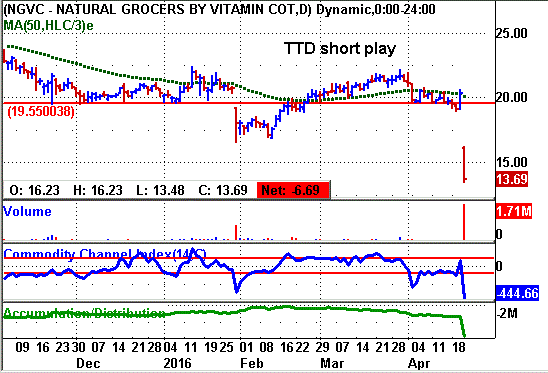
NGVC, based in Lakewood, Co., operates stores selling natural and organic groceries and dietary supplements in the U.S. Annual revenues: $647 million. NGVC's stock falls sharply after a disappointing earnings forecast. TTD sees more on the downside even though the stock appears extended now. 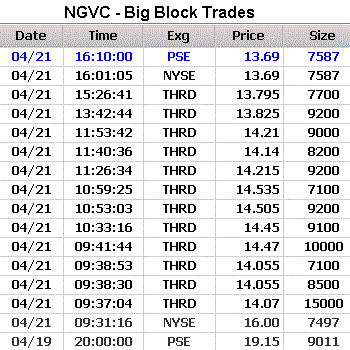
TTD highlighted NGVC as a short at our midsession video show on the Web Thursday.
So far today, NGVC is trading a heavy 1.7 million shares, 25 times its average daily volume.
The company said it expects to report net for the fiscal second quarter ended March 30 and that net will be about 15 cents a share. That is well below the consensus estimate on the Street of 26 cents a share.
The news sent the stock tumbling.
NGVC fell to 13.82 in the morning. It then trended sideways through the rest of the day until near the close when it touched its intraday low of 13.48.
NGVC's tape action shows the recent block trades.
One can see the price for the blocks falling from $19.15 in the prior session to as low as $13.69 near the close.
A key bearish trade came in the morning when a block of 7,497 shares crossed the tape at $16.
That was down sharply from the prior block trade at $19.15 on 9,011 shares.
NGVC sells natural and organic grocery products, bulk food and private label products, dry, frozen, and canned groceries; meat and seafood products.
It also sells provide private label dietary supplements; cosmetics, skin care, hair care, fragrance and personal care products.
The Street had been forecasting a 10% increase in NGVC's net this year. However, that will come down sharply.
NGVC's daily chart shows the gap drop on big volume. The stock is obviously extended to the downside. However, TTD expects a possible minor consolidation and then more on the downside.
Strategy Opinion: TTD is targeting NGVC for a decline to 10.30 within the next few months, or sooner. A protective stop buy can be placed near 14.90.
| TTD's Quality Rating of Stock - NGVC - BELOW AVERAGE |
TTD columnist Leo Fasciocco has covered the stock market for over 20 years. His articles appear in many publications. He is also a speaker at the Intershow conferences. He has been on television and radio. He is author of many educational articles about stock investing and the book “Guide To High-Performance Investing.”

For information to subscribe to the Ticker Tape Digest Services call: Beverly Owen at 1-480-926-1680. Distributed by Corona Publishing Enterprises. Ticker Tape Digest Inc. P.O. Box 2044 Chandler, Az. 85244-2044. TTD “Professional Report” is available on the World Wide Web: $100 per month. Password needed. “TTD Professional“ Faxed is $200 per month. The TTD Daily Report is $39.95. Credit cards accepted.
(The information contained has been prepared from data deemed reliable but there is no guarantee of complete accuracy. Ticker Tape Digest Inc. is not affiliated with any broker, dealer or investment advisor. Nothing in this publication constitutes an offer, recommendation or solicitation to buy or sell any securities. Further research is advised. This report is copyrighted and no redistribution is permitted with out permission.)