Daily - Go to TTD's Tape of Stock Charts - Thursday. April 24, 2014
|
Daily - Go to TTD's Tape of Stock Charts - Thursday. April 24, 2014 |
|
Weekly - Bullish Conservative Investors - Go To TTD Long-Term Plays - Monday, April 21, 2013 |
|
Go to Video Show - "How to Make Money With Breakout Stocks" |
|---|

By Leo Fasciocco -- TTD
Ticker Tape Digest presents its daily stock market report containing stocks to go long as breakout trades, quick trades, or bargain trades. We also feature stocks under Significant Accumulation that are poised to breakout.
|
Ticker Tape Digest's Daily schedule guide for TTD subscribers 1. Pre-market - check Breakout Watch List and Quick Trades. 2. Morning - (11:30 - 12 A.M.) - check breakout stocks tape and breakout chart slide show. 3. Midday (1 P.M.) check TTD Midsession Report and see market video show. 4. After close (4 P.M.) check final TTD Report for day. Trading Strategies Bullish Aggressive Investors Bullish - "Breakout Stocks" - ideally suited for bull markets and special situation stocks. Potential for large returns. (See Performance) Aggressive Investor Bullish- "Quick Trade Stocks" -ideally suited for entry into top performing issues looking for a small quick profit." (See Performance) Conservative Investors "Bargain Buy Trades for the Long Term." Ideally suited for entry into top performing big cap stocks on pullbacks within overall up trend.(See Performance) Bearish Aggressive Bearish Investors - "Breakdown Stocks" to Sell Short. Ideally suited for bear markets or market pull backs. Potential for large returns (See Performance) |
|---|
The TTD report also contains stocks to short as breakdown plays and as bargain (swing trade) shorts.
Investors should tend to try to go with a strategy that fits with the stock market's trend, unless there is a special situation play.
TTD's Breakout Stocks - Long are most suitable for aggressive investors seeking ideal entry points into leading stocks, especially during bull markets. They can do extremely well in bull markets with gains of as much as several hundred percent.
These stocks can also do extremely well during strong market
rallies, or if they are in a industry group that is performing very well. They tend to have strong earnings outlooks and are near new-52 week, or all-time highs. 
TTD Quick Trade Stocks - Long These are leading issues that have pulled back in recent days, but could move higher soon. They are most suitable for Aggressive Investors willing to trade short term. These stocks will do extremely well during market advances. They have about 74% win rate. During market rally sequences the win rate is even higher. The return is small 3% to 8% in just a few days.
TTD's Bargain Buy Trades - Long - Long Term. These are for conservative bullish Investors These long-term buys are ideally suited for entry into stocks on pull backs within overall up trend. These stocks can give a good return long-term especially during a bull market.
TTD also presents Stocks To Sell or Sell Short. These issues are suitable for aggressive investors willing to take short positions both as trades or for longer-term plays. These stocks will do very well during bear markets or market pull backs.
TTD's Bearish breakdown stocks to sell short. These issues have potential to fall sharply. They often show a technical breakdown and also some fundamental business problem such as weak earnings.
TTD's multi-media updates include a slide-show that presents charts and analysis at midsession. Some times TTD presents feature analysis on stocks and the market. TTD uses Windows Media Files. (WMV).
TTD also presents a "Breakout Watch List" that is up dated daily. This list consists of key stocks in position to breakout. A close watch of this list can put you in the stock just as it breaks out. A good idea is to study the list and be ready to move into a stock quickly as it hits its breakpoint.
TTD often suggests using stop buy orders to enter. It is very important to buy a breakout stock as close as possible to the breakpoint. The idea is to get "elbow room" if the stock should follow through to the upside. This is very important in being successful in making big money with breakout stocks.
It is also essential to have a stop loss strategy for all stocks in which positions are taken. Not every stock will work as expected. It is important for investors to "police" their portfolios and avoid getting trapped in any bad positions.
Quality rating of breakout Two key factors: 1 - Stock near all-time in price or near a 52-week high. 2 - earnings growth current year is strong. The ideal play is a stock with an Above Average Quality Rating. The stock is near a new high and will have strong earnings. TTD's other ratings are Average and Below Average.
TTD also has special feature sections on Educational Tips on Investing.
To email Mr. Leo Fasciocco leo@tickertapedigest.com.For service, email Beverly Owen owen@tickertapedigest.com. TTD’s Tel: 1-480-926-1680.
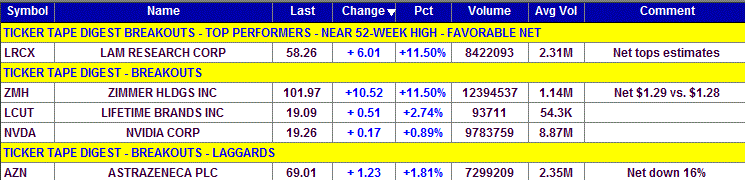
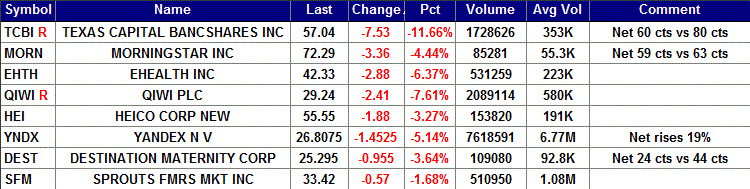
Breakout Stocks
Total Buy Breakouts so far today - 5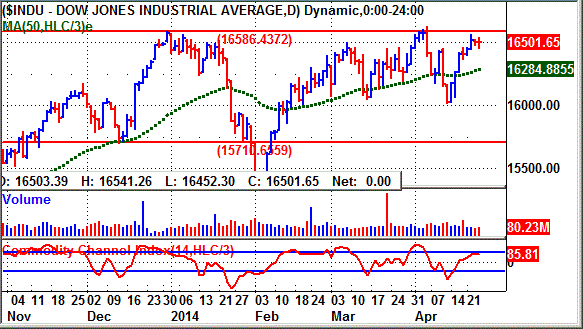
Overall Quality of Breakouts - AVERAGE
Stocks Screened - 8,300
Bull side - Small list of breakouts today. Bulls be conservative. Stock market holds in up trend within a trading range. Earnings to continue to impact market.
(Put mouse on Dow chart to see Nasdaq chart)
Long Term Environment for bulls: Favorable
Stock Market Momentum
Market (Daily) - NYSE Bullish, Nasdaq Bullish
Market (Weekly) - NYSE Bullish, Nasdaq Bullish
Market (Monthly) - NYSE Bullish, Nasdaq Bearish
Ticker Tape Digest's
|
TTD's Quality Rating of Stock - LRCX - ABOVE AVERAGE |
LRCX, based in Freemont, Ca., makes semiconductor processing equipment. Annual revenues: $3.7 billion. LRCX's stock breaks out today from a 15-week flat base. The move was triggered by better-than-expected quarterly earnings. So far today LRCX is trading 8.4 million shares, four times its average daily volume of 2.3 million shares. 
LRCX came in with earnings for the fiscal third quarter ending in March of $1.26 a share. That topped the consensus estimate on the Street of $1.16 a share. The stock responded very bullishly to the news.
LRCX's stock pushed higher in the morning and cleared its breakpoint. However, it did drift back a bit to slightly undercut it (see 10-minute chart). 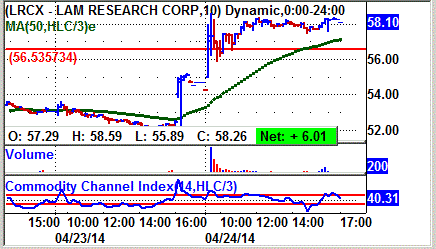
The stock then rallied again and moved comfortably above the breakpoint. It trended sideways through the afternoon.
LRCX's tape action is shown by the recent block trades.
One can see the price for the blocks climbing from $52.50 in the prior session to as high as $58.26 Thursday.
A key bullish trade came when a block of 85,901 shares crossed the tape at $57.29.
That was up sharply from the prior block at $52.50 on 82,814 shares. . 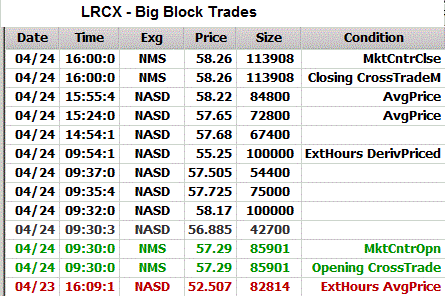
A key bullish trade came near the close Thursday.
That was when a block of 113,908 shares (duplicated) crossed the tape at $58.26.
That was up from the prior block at $58.22.
So, the tape showed very aggressive institutional buying.
LRCX produces semiconductor processing equipment used in the fabrication of integrated circuits.
The company is a leading supplier of front-end wafer processing equipment to the worldwide semiconductor industry.
LRCX's products are used selectively to etch away portions of various films to create an integrated circuit.
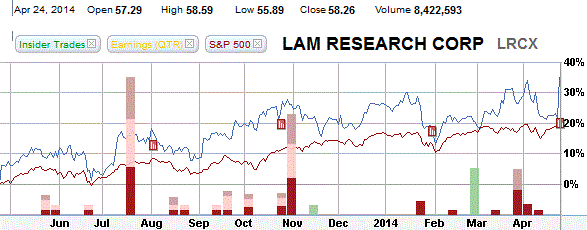
LRCX's 12-month performance chart shows the stock appreciating 35% versus a 20% gain for the S&P 500 index.
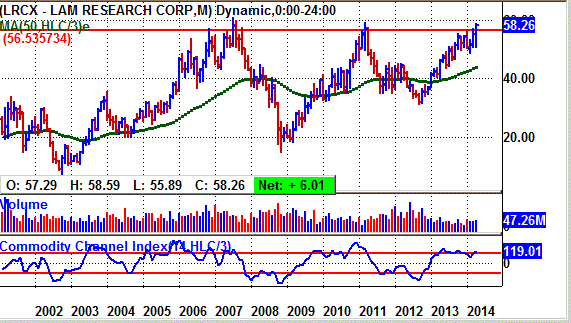
LRCX's long-term chart shows the stock climbing from $6.63 in 2002 to a peak of 60.82 in 2007, the peak in the prior bull market.
The stock then fell back to 14.72 in 2008 due to the bear market. It has since made a steady recovery. It is in position to make a new all-time high. It needs to hurdle 60.82. If it can do that it could draw in more buying. 
LRCX's daily chart shows the stock advancing from 47 back in September to a peak near 55 by January.
The stock then put down a cup-and handle type base. The breakout came in early April.
However, it did not have a follow through. The stock faded back.
Today, however, it clears the base as volume picks up.
The TTD momentum indicator (top of chart) is strongly bullish.
The accumulation - distribution line (bottom of chart) showed good buying the past few months.
Analysts are forecasting an 86% surge in LRCX's earnings for the fiscal year ending in June of 2014.
They look for net of $4.15 a share, up from $2.22 a year ago.
The stock sells with a price-earnings ratio of 13. TTD sees that as reasonable.
Looking out to fiscal 2015 ending in June, the Street is projecting net to rise 13% to $4.69 a share from the anticipated $4.15 for fiscal 2014.
For the upcoming fiscal fourth quarter ending in June, LRCX's profits should climb 32% to $1.06 a share from 89 cents a year ago. The highest estimate on the Street is at $1.26 a share. 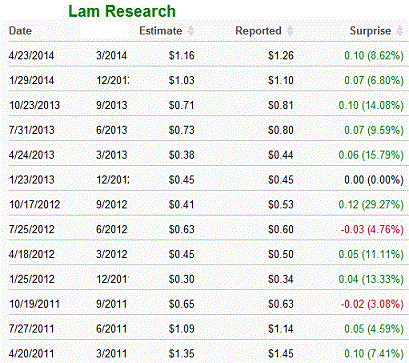
TTD sees chances for an upside earnings surprise. The prior five quarters, LRCX topped the consensus estimate by 10 cents a share to 6 cents. That is impressive.
Going out to the fiscal first quarter of 2015 ending in September, earnings should climb 23% to 99 cents a share from 81 cents a year ago.
Profits are projected to climb 13% in fiscal 2015 to $4.69 a share from the anticipated 4.15 in fiscal 2014.
Strategy Opinion: LRCX has a lot going for it near-term, especially the fact the semiconductor sector is acting strong.
TTD is targeting LRCX for a move to 70 off this breakout. A protective stop can be placed near 54, which is tight.
TTD rates LRCX a good intermediate-term play.
Sponsorship: Very Good. The largest fund holder is 4-star rated Artisan Mid Cap Value Investor Fund with a 3.3% stake. It has held its position steady.
A large fund buyer recently was the 5-star rated JPMorgan US Equity Inst. Fund which purchased 382,242 shares. It has a 0.75% stake.
LRCX has 162.3 million shares outstanding. Institutions hold 97% of the stock.
Insider Activity: Slightly Bearish. Insiders have been modest sellers the past month at around $56 to $58.
Currently, 15 analysts follow the stock, 13 have a buy, down from 11 three months ago.
Stock Performance Chart with Quarterly Earnings Markers.
| TTD's Breakout Profile
Rating Lam Research Corp. - (LRCX) |
| TTD Check List | Bullish | Bearish | Neutral |
| Near 52-week High | YES | ||
| Volume | YES | ||
| Tick Volume | YES | ||
| Price Trend - Daily | YES | ||
| Price Trend - Long Term | YES | ||
| Price Daily Spread | YES | ||
| Base Structure | YES | ||
| Base - A-D | YES | ||
| Earnings-Quarterly | YES | ||
| Earnings-Long Term | YES | ||
| Earnings Outlook | YES | ||
| Industry Group | YES | ||
| Prior Breakout Success | YES | ||
| Fund Sponsorship | YES | ||
| Total Score | 13 | 0 | 1 |
Charts of Selected Breakout Stocks
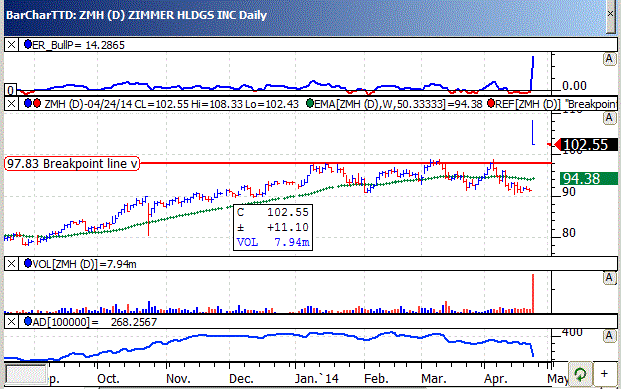
| TTD's Quality Rating of Stock - ZMH - AVERAGE |
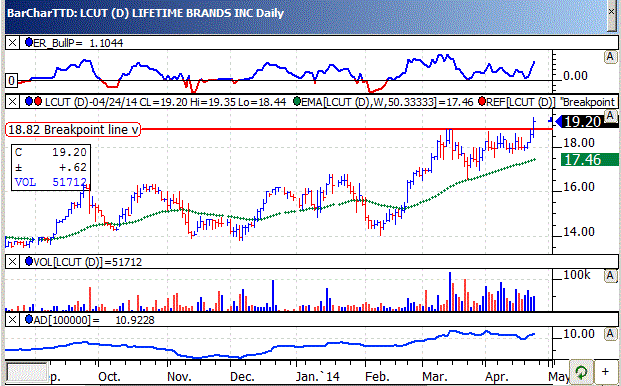
| TTD's Quality Rating of Stock - LCUT- AVERAGE |
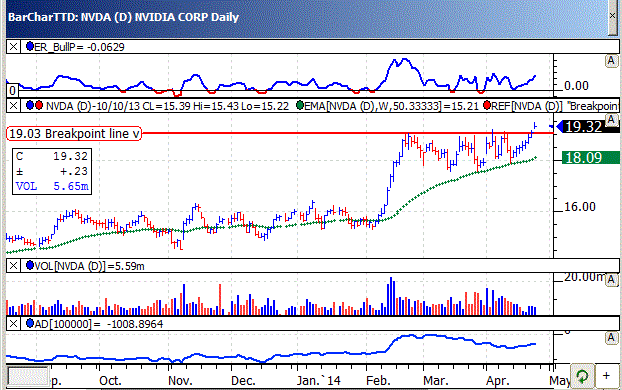
| TTD's Quality Rating of Stock - NVDA - AVERAGE |
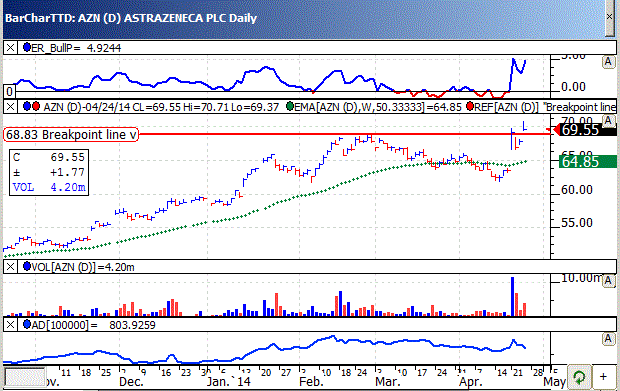
| TTD's Quality Rating of Stock - AZN - BELOW AVERAGE |

Ticker Tape Digest’s Daily List of “Stocks To Sell or Sell Short” ranks stocks well timed to be sold immediately based on daily trading. The list can be used as an alert to reduce current long-term positions.
Shorts from tape action so far today - 8
Stocks Screened - 8,300
Long-Term Environment for bears: Unfavorable.
Bear Side - Short list expands. Stock market is mixed in a low volatile session. Bears remain conservative.
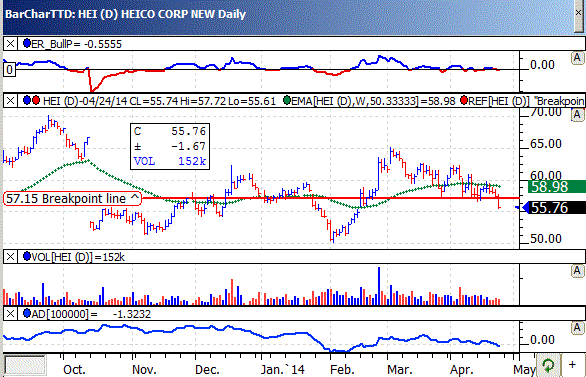
HEI, based in Hollywood, Fla., makes jet engines and aircraft parts. Annual revenues: $1.1 billion. HEI's stock falls sharply today undercutting key technical support. So far today, HEI is trading 231,041 shares. Its average daily volume is 191,000 shares. TTD sees more on the downside. 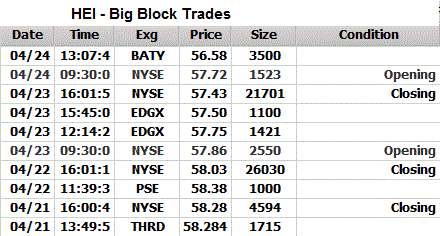
TTD highlighted HEI as a short at our midsession video show on the Web Thursday.
HEI' stock declined in the morning, trended sideways later and then in the afternoon continued to head South.
The stock's tape action shows the recent block trades.
One can see a very bearish block crossing late on Wednesday when 26,030 shares crossed at $58.03.
That was down sharply from the prior block at $58.38.
Then later in the session a block of 3,500 shares crossed the tape at $56.58. That was down sharply from the prior block at $57.72.
So, the tape showed heavy and aggressive institutional selling pressure.
HEI 's customers include a majority of the world's airlines and airmotives as well as numerous defense and space contractors and military agencies worldwide. It also provides products and sevices to the telecommunications, electronics and medical equipment manufacturers.
HEI's quarterly earnings growth is expected to slow. Net for the fiscal second quarter ending in April should rise 16%, but then in the fiscal third quarter ending in July rise just 5%. Overall, the Street is forecasting a 15% gain in HEI's earnings for the fiscal year ending in October of 2014.
HEI's daily chart shows the stock cutting below support. The accumulation - distribution line (bottom of chart) is now trending lower.
Strategy Opinion: TTD is targeting HEI for a decline to 49. We consider it a trading short. A protective stop buy can be placed near 57.30.
| TTD's Quality Rating of Stock - HEI - BELOW AVERAGE |
TTD columnist Leo Fasciocco has covered the stock market for over 20 years. His articles appear in many publications. He is also a speaker at the Intershow conferences. He has been on television and radio. He is author of many educational articles about stock investing and the book “Guide To High-Performance Investing.”

For information to subscribe to the Ticker Tape Digest Services call: B. J. Owen at 1-480-926-1680. Distributed by Corona Publishing Enterprises. Ticker Tape Digest Inc. P.O. Box 2044 Chandler, Az. 85244-2044. TTD “Professional Report” is available on the World Wide Web: $100 per month. Password needed. “TTD Professional“ Faxed is $200 per month. The TTD Daily Report is $39.95. Credit cards accepted.
(The information contained has been prepared from data deemed reliable but there is no guarantee of complete accuracy. Ticker Tape Digest Inc. is not affiliated with any broker, dealer or investment advisor. Nothing in this publication constitutes an offer, recommendation or solicitation to buy or sell any securities. Further research is advised. This report is copyrighted and no redistribution is permitted with out permission.)