|
Weekly - Bullish Investors Go To TTD Bargain Setups - Feature - Monday, May 3 |
Weekly - Bullish Conservative Investors - Go To TTD Long-Term Plays - Monday, May 3 |
|
Go to Video Show - "How to Make Money With Breakout Stocks" Go to Video Show -TTD Performance 2008 Long and Short |
|---|

By Leo Fasciocco -- TTD
Ticker Tape Digest presents its daily stock market report containing stocks to go long as breakout trades, quick trades, or bargain trades. We also feature stocks under  Significant Accumulation that are poised to breakout.
|
Ticker Tape Digest's Trading Strategies Overview and Performance Bullish Aggressive Investors Bullish - "Breakout Stocks" - ideally suited for bull markets and special situation stocks. Potential for large returns. Aggressive Investor Bullish- "Quick Trade Stocks" -ideally suited for entry into top performing issues looking for a small quick profit." Conservative Investors "Bargain Buy Trades" (swing trades). Ideally suited for entry into stocks on pullbacks within overall up trend. Good for trading range markets Bearish Aggressive Bearish Investors - "Breakdown Stocks" to Sell Short. Ideally suited for bear markets or market pull backs. Potential for large returns Conservative Bearish Investors (swing traders). "Bargain Bearish Plays" to Sell Short. Ideally suited for trading range markets with overall market down trend. |
|---|
The TTD report also contains stocks to short as breakdown plays and as bargain (swing trade) shorts.
Investors should tend to try to go with a strategy that fits with the stock market's trend, unless there is a special situation play.
TTD's Breakout Stocks - Long are most suitable for aggressive investors seeking ideal entry points into leading stocks, especially during bull markets. They can do extremely well in bull markets with gains of as much as several hundred percent.
These stocks can also do extremely well during strong market rallies, or if they are in a industry group that is performing very well. They tend to have strong earnings outlooks and are near new-52 week, or all-time highs.
TTD Quick Trade Stocks - Long These are leading issues that have pulled back in recent days, but could move higher soon. They are most suitable for Aggressive Investors willing to trade short term. These stocks will do extremely well during market advances. They have about 74% win rate. During market rally sequences the win rate is even higher. The return is small 3% to 8% in just a few days.
TTD's Bargain Buy Trades - Long These are for conservative bullish Investors The strategy is called swing trading. These long buys are ideally suited for entry into stocks on pull backs within overall up trend. They are good for trading range markets. These stocks can give a good return in a week or two. They can also explode into a breakout and a powerful advance.
TTD also presents Stocks To Sell or Sell Short. These issues are suitable for aggressive investors willing to take short positions both as trades or for longer-term plays. These stocks will do very well during bear markets or market pull backs.
TTD's Bearish breakdown stocks to sell short. These issues have potential to fall sharply. They often show a technical breakdown and also some fundamental business problem such as weak earnings.
TTD's Bearish bargain play stocks to sell short. These issues are usually in down trends and are poised to rollover after a minor rally. They often can provide a conservative bear with a good entry point.
TTD's multi-media updates include a slide-show that presents charts and analysis at midsession. Some times TTD presents feature analysis on stocks and the market. TTD uses Windows Media Files. (WMV).
TTD also presents a "Breakout Watch List" that is up dated daily. This list consists of key stocks in position to breakout. A close watch of this list can put you in the stock just as it breaks out. A good idea is to study the list and be ready to move into a stock quickly as it hits its breakpoint.
TTD often suggests using stop buy orders to enter. It is very important to buy a breakout stock as close as possible to the breakpoint. The idea is to get "elbow room" if the stock should follow through to the upside. This is very important in being successful in making big money with breakout stocks.
It is also essential to have a stop loss strategy for all stocks in which positions are taken. Not every stock will work as expected. It is important for investors to "police" their portfolios and avoid getting trapped in any bad positions.
Quality rating of breakout Two key factors: 1 - Stock near all-time in price or near a 52-week high. 2 - earnings growth current year is strong. The ideal play is a stock with an Above Average Quality Rating. The stock is near a new high and will have strong earnings.TTD's other ratings are Average and Below Average.
TTD also has special feature sections on Educational Tips on Investing.
To email Mr. Leo Fasciocco leo@tickertapedigest.com.For service, email Beverly Owen owen@tickertapedigest.com. TTD’s Tel: 1-480-926-1680.
Stocks Screened - 8,200
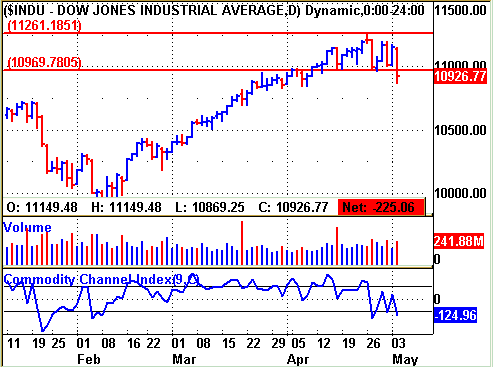
Bull side - Very few breakouts today as stock market falls sharply due to European problems. The action today now threatens a possible further breakdown in the market. However, TTD sees the market simply being choppy as it consolidates. Bulls remain selective and watch all protective stops.
(Put mouse on Dow chart to see Nasdaq chart)
Long Term Environment for bulls: Favorable
Market (Daily) - NYSE Bearish, Nasdaq Bearish
Market (Weekly) - NYSE Bearish, Nasdaq Bearish
Market (Monthly) - NYSE Bullish, Nasdaq Bullish
|
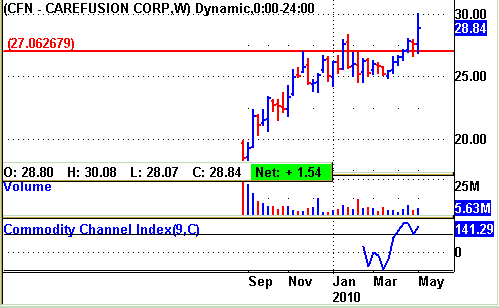
TTD's Quality Rating of Stock - CFN - AVERAGE |
CFN, based in San Diego, produces products for intravenous infusion,
medication and supply dispensing. Annual revenues: $3.7 billion. CFN's stock
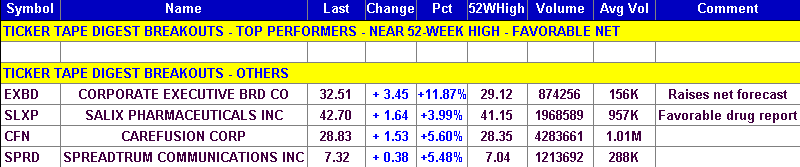
breaks out from a 15-week cup-and-handle base today. The stock hits a new high today! That's a feat not many stocks did today as the stock market tumbled sharply.
So far today, CFN's volume is running at 1.25.7 million shares, five times its normal daily volume of 1 million shares. 
TTD highlighted CFN as a breakout at our midsession show on the Web Tuesday. 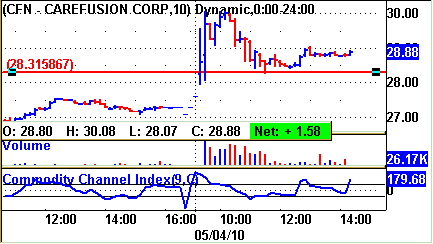
The stock is an IPO from late 2009. It has done very well climbing from 18 to 28.
CFN's 10-minute chart shows the stock clearing its base this morning near 28. That was a strong move considering the stock market plunged at the opening.
The stock to 30 and then slipped back, but held above its breakpoint line. The stock lifted slightly in the late afternoon.
TTD's clip of the tape shows the recent big block trades.
A key trade took place today when a big block of 57,300 shares crossed the
tape at $29.10. That was up sharply from the prior block trade at $27.58.
The tape action indicated heavy and aggressive institutional buying.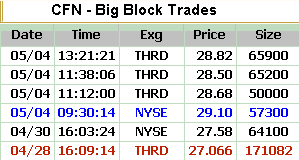
CFN provides products for infusion, medication, respiratory care, infection prevention and surgery.
Its primary product brands include Alaris IV infusion systems that feature its Guardrails software, an application that alerts the clinician when a parameter is outside the institution’s pre-established limitations for that medication, thereby helping to reduce IV medication errors; .
The firm also makes Pyxis automated medication dispensing systems that provide medication management and Pyxis automated medical supply dispensing systems. Another items include Pulmonetic Systems ventilation and respiratory products, and Jaeger and SensorMedics pulmonary products. It also makes ChloraPrep products that help prevent vascular and surgical-site infections.
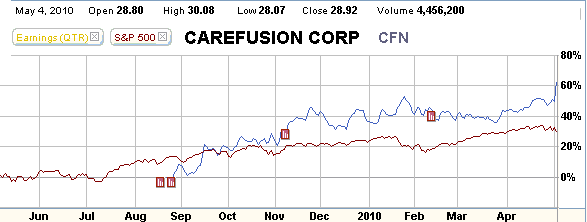
CFN's 12-month performance chart shows the stock appreciating 62% versus a 30% gain for the S&P 500 index. The stock has been an outstanding performer since coming public.
CFN's long-term chart shows the stock in a solid up trend. The company's earnings growth rate would not indicate it to be a big runner. However, it has done well climbing in a methodical way. .
CFN's daily chart shows the cup-and-handle base with key resistance around 28. The
stock's move today comes with a big pick up in volume.
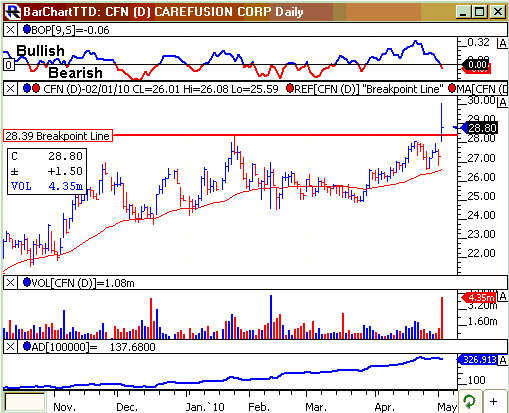
The gap move was very bullish in that the stock showed strong buying even though the stock market was weak.
The stock's TTD momentum indicator (top of chart) is slightly bearish.
The accumulation - distribution line (bottom of chart) has been trending higher the past several weeks. That was a good tipoff that the stock was showing subtle and unusual strength.
The company has been growing by coming out with new products and expanding via acquisitions.
Net for the upcoming fiscal third quarter ending March 30 should come in at 33 cents a share. Comparable results for a year ago were not available. The highest estimate on the Street is at 35 cents a share, the lowest 31 cents.
Net for the fiscal year ending June 30 should come in at $1.46 a share. No comparisons were available. The stock sells with a price-earnings ratio of 18.
Going out to 2011 fiscal year, analysts project a 14% rise in net to $1.67 a share from the anticipated $1.46 a share for this fiscal year.
Strategy Opinion: As TTD stated in a prior report this year, CFN's stock is a winner until proven otherwise. TTD is targeting the stock for a move to 35. A protective stop can be placed near 25 giving it room. TTD rates CFN a good intermediate-term play.
Sponsorship: Very Good. The largest fund buyer recently was 4-star rated Fidelity Equity-Income Fund, which purchased 934,000 shares. Also, 5-star rated FMI Large Cap Fund was a recent buyer of 74,800 shares. CFN has 221.6 million shares outstanding.
Insider Activity: Neutral. Insiders have not done much. However, Cardinal Health Inc. has been selling some of its stock. Ten analysts follow the stock, 2 have a buy, the same as three months ago.
Stock Performance Chart for 12 months with Quarterly Earnings Markers.
|
TTD's Breakout Profile Rating CareFusion Corp. - (CFN) |
| TTD Check List | Bullish | Bearish | Neutral |
| Near 52-week High | YES | ||
| Volume | YES | ||
| Tick Volume | YES | ||
| Price Trend - Daily | YES | ||
| Price Trend - Long Term | YES | ||
| Price Daily Spread | YES | ||
| Base Structure | YES | ||
| Base - A-D | YES | ||
| Earnings-Quarterly | YES | ||
| Earnings-Long Term | YES | ||
| Earnings Outlook | YES | ||
| Industry Group | YES | ||
| Prior Breakout Success | YES | ||
| Fund Sponsorship | YES | ||
| Total Score | 14 | 0 | 0 |
(The “breakout List” gives all stocks breaking out of a base of five weeks or more. These stocks have a good chance to trend higher. However, a stop should be used to avoid those that do not work. They are ranked according to percentage change and classified as leaders or other. (Trading strategy: One should buy breakout stocks at breakpoint by using market order or stop buy)
Charts of Selected Breakout Stocks
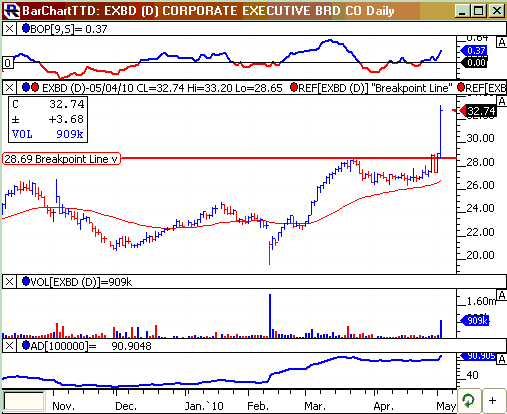
| TTD's Quality Rating of Stock - EXBD - BELOW AVERAGE |
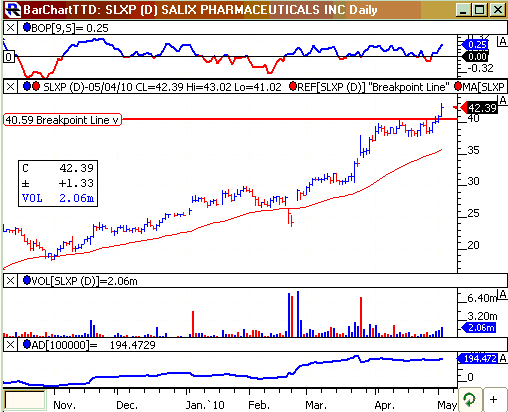
| TTD's Quality Rating of Stock - SLXP - BELOW AVERAGE |
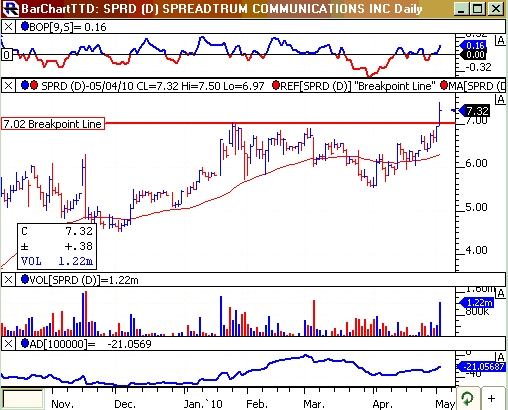
| TTD's Quality Rating of Stock - SPRD - AVERAGE |

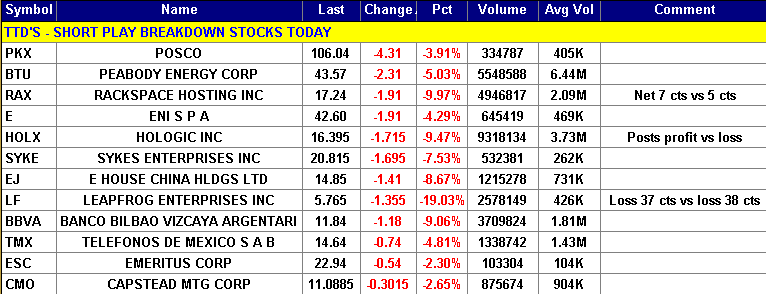
Ticker Tape Digest’s Daily List of “Stocks To Sell Short” ranks stocks well timed to be sold immediately based on daily trading. The list can be used as an alert to reduce current long-term positions.
Shorts from tape action so far today - 12
Stocks Screened - 8,2007
Long-Term Environment for bears: Unfavorable.
Bear Side - Breakdown list expands today as stock market falls sharply and broadly due to European problems. Bears be selective. TTD's short play from Monday was China Green Agriculture Inc. (CGA) - 12.08, down 0.60. Today, the stock has dropped to 11.32 and is working well for bears.
(Trading strategy: These stocks can be sold short, or if held should be sold. If a stock is sold short, a protective stop buy should be placed. Short plays work best when the stock market is in a down trend.)
HOLX, based in Bedford, Mas., makes medical imaging systems and diagnostic and surgical products mostly for women. Annual revenues: $1.6 billion. HOLX's stock falls sharply today in heavy trading. The company reported earnings and said net for the fiscal third quarter ending June 30 would be flat. The market took the news very bearishly. HOLX is trading 11.1 million shares so far today, triple its normal daily volume of 3.7 million shares. 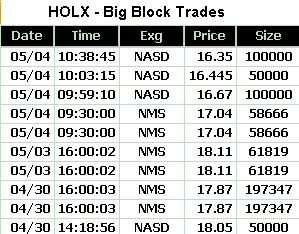
HOLX's stock fell sharply at the opening. The stock then formed a bottom around 16.30. It then trended sideways the rest of the session unable to mount a rally.
TTD's clip of the tape shows the recent big block trades. One can see some heavy institutional selling pressure today. A big block of 100,000 shares crossed at $16.67 in the morning. That was down from the prior block trade at $17.04.
Another 100,000 share block crossed at $16.35. That was down from the prior block trade at $16.44.
HOLX said earnings for the upcoming fiscal third quarter would be 29 cents a share. That would be flat with year ago results. Overall, for the fiscal year ending September 30, the Street is forecasting a 2% rise in HOLX's earnings to $1.19 a share compared with $1.17 a year ago.
The company provides: breast health, diagnostics, GYN surgical and skeletal health. The Company had developed a breast imaging platform, Dimensions, which utilizes a technology, tomosynthesis, to produce three dimensional images, as well as conventional two dimensional full field digital mammography images.
HOLX's chart shows the gap drop today undercutting key support. The stock's TTD momentum indicator (top of chart) is bearish. The accumulation - distribution line (bottom of chart) has been trending lower indicating clear selling pressure prior to today's breakdown.
Strategy Opinion: TTD is targeting HOLX for a decline to 12.50 within the next few months. A protective stop buy can be placed near 17.20.

TTD columnist Leo Fasciocco has covered the stock market for over 20 years. His articles appear in many publications. He is also a speaker at the Intershow conferences. He has been on television and radio. He is author of many educational articles about stock investing and the book “Guide To High-Performance Investing.”

For information to subscribe to the Ticker Tape Digest Services call: B. J. Owen at 1-480-926-1680. Distributed by Corona Publishing Enterprises. Ticker Tape Digest Inc. P.O. Box 2044 Chandler, Az. 85244-2044. TTD “Professional Report” is available on the World Wide Web: $100 per month. Password needed. “TTD Professional“ Faxed is $200 per month. The TTD Daily Report is $39.95. Credit cards accepted.
(The information contained has been prepared from data deemed reliable but there is no guarantee of complete accuracy. Ticker Tape Digest Inc. is not affiliated with any broker, dealer or investment advisor. Nothing in this publication constitutes an offer, recommendation or solicitation to buy or sell any securities. Further research is advised. This report is copyrighted and no redistribution is permitted with out permission. Some of the charts are from Telescan, Insight Trading, First Alert and other sources.)
