|
Weekly - Bullish Conservative Investors - Go To TTD Long-Term Plays - Monday, May 7 |
|
Go to Video Show - "How to Make Money With Breakout Stocks" |
|---|

By Leo Fasciocco -- TTD
Ticker Tape Digest presents its daily stock market report containing stocks to go long as breakout trades, quick trades, or bargain trades. We also feature stocks under Significant Accumulation that are poised to breakout.
|
Ticker Tape Digest's Daily schedule guide for TTD subscribers 1. Pre-market - check Breakout Watch List and Quick Trades. 2. Morning - (11:30 - 12 A.M.) - check breakout stocks tape and breakout chart slide show. 3. Midday (1 P.M.) check TTD Midsession Report and see market video show. 4. After close (4 P.M.) check final TTD Report for day. Trading Strategies Bullish Aggressive Investors Bullish - "Breakout Stocks" - ideally suited for bull markets and special situation stocks. Potential for large returns. (See Performance) Aggressive Investor Bullish- "Quick Trade Stocks" -ideally suited for entry into top performing issues looking for a small quick profit." (See Performance) Conservative Investors "Bargain Buy Trades for the Long Term." Ideally suited for entry into top performing big cap stocks on pullbacks within overall up trend.(See Performance) Bearish Aggressive Bearish Investors - "Breakdown Stocks" to Sell Short. Ideally suited for bear markets or market pull backs. Potential for large returns (See Performance) |
|---|
The TTD report also contains stocks to short as breakdown plays and as bargain (swing trade) shorts.
Investors should tend to try to go with a strategy that fits with the stock market's trend, unless there is a special situation play.
TTD's Breakout Stocks - Long are
most suitable for aggressive investors seeking ideal entry points into leading stocks, especially during bull markets. They can do extremely well in bull markets with gains of as much as several hundred percent. 
These stocks can also do extremely well during strong market rallies, or if they are in a industry group that is performing very well. They tend to have strong earnings outlooks and are near new-52 week, or all-time highs.
TTD Quick Trade Stocks - Long These are leading issues that have pulled back in recent days, but could move higher soon. They are most suitable for Aggressive Investors willing to trade short term. These stocks will do extremely well during market advances. They have about 74% win rate. During market rally sequences the win rate is even higher. The return is small 3% to 8% in just a few days.
TTD's Bargain Buy Trades - Long - Long Term. These are for conservative bullish Investors These long-term buys are ideally suited for entry into stocks on pull backs within overall up trend. These stocks can give a good return long-term especially during a bull market.
TTD also presents Stocks To Sell or Sell Short. These issues are suitable for aggressive investors willing to take short positions both as trades or for longer-term plays. These stocks will do very well during bear markets or market pull backs.
TTD's Bearish breakdown stocks to sell short. These issues have potential to fall sharply. They often show a technical breakdown and also some fundamental business problem such as weak earnings.
TTD's multi-media updates include a slide-show that presents charts and analysis at midsession. Some times TTD presents feature analysis on stocks and the market. TTD uses Windows Media Files. (WMV).
TTD also presents a "Breakout Watch List" that is up dated daily. This list consists of key stocks in position to breakout. A close watch of this list can put you in the stock just as it breaks out. A good idea is to study the list and be ready to move into a stock quickly as it hits its breakpoint.
TTD often suggests using stop buy orders to enter. It is very important to buy a breakout stock as close as possible to the breakpoint. The idea is to get "elbow room" if the stock should follow through to the upside. This is very important in being successful in making big money with breakout stocks.
It is also essential to have a stop loss strategy for all stocks in which positions are taken. Not every stock will work as expected. It is important for investors to "police" their portfolios and avoid getting trapped in any bad positions.
Quality rating of breakout Two key factors: 1 - Stock near all-time in price or near a 52-week high. 2 - earnings growth current year is strong. The ideal play is a stock with an Above Average Quality Rating. The stock is near a new high and will have strong earnings. TTD's other ratings are Average and Below Average.
TTD also has special feature sections on Educational Tips on Investing.
To email Mr. Leo Fasciocco leo@tickertapedigest.com.For service, email Beverly Owen owen@tickertapedigest.com. TTD’s Tel: 1-480-926-1680.
Breakout Stocks
Total Buy Breakouts so far today - 5
Overall Quality of Breakouts - Average
Stocks Screened - 8,300
Bull side - Small number of breakouts today. Bulls be patient and selective. Stock market now at lower end of trading range. (Put mouse on Dow chart to see Nasdaq chart)
Long Term Environment for bulls: Favorable
Stock Market Momentum:
Market (Daily) - NYSE Bearish, Nasdaq Bearish
Market (Weekly) - NYSE Bearish, Nasdaq Bearish
Market (Monthly) - NYSE Bullish, Nasdaq Bullish
Ticker Tape Digest's
|
TTD's Quality Rating of Stock - CYBX - ABOVE AVERAGE |
CYBX, based in Houston, produces medical devices to treat epilepsy.
Annual revenues: $212 million. CYBX's stock breaks out today from an 11-week flat base and nears a six year high. So far today, CYBX is trading a light 135,915 shares. Its average daily volume is 186,000 shares. 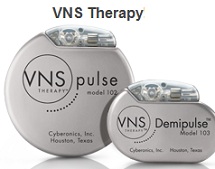
CYBX's 10-minute chart shows the stock pushing higher in the morning and then clearing its breakpoint in the afternoon.
The stock was one of the few breakouts today.
TTD's clip of the tape shows the action for Tuesday.
One can see the price for the blocks rising from $38.25 on Wednesday to a peak of $39.13.
Back on Wednesday there was a key bullish trade when 15,000 shares crossed the tape at $38.64. That was up from the prior block trade at $38.25. The action showed subtle institutional buying while the stock market was moving lower. 
CYBX makes medical products to treat epilepsy and other debilitating neurological disorders using a therapy, vagus nerve stimulation.
The company's initial target market - epilepsy - is the world's second most prevalent neurological disorder. It is characterized by seizures.
Vagus nerve stimulation with the Cyberonics NCP System was approved for use as an adjunctive therapy to reduce the frequency of seizures in adults and adolescents with medically refractory partial onset seizures.
CYBX's 12-month performance chart shows the stock appreciating 18% versus a 2% gain for the S&P 500 index.
CYBX's long-term chart shows the stock climbing to a peak of 47
in 2005. The stock then went into a down trend and declined to 10 in 2008
being dragged lower by the bear market. It has since turned up strongly. 
CYBX's daily chart shows the stock climbing from 26 in October to a peak of 39 in March.. The stock then set up a tight flat base bracketed between 36 and 39 roughly.
CYBX's TTD momentum indicator (top of chart) has been mostly bullish for several months.
The accumulation - distribution line (bottom of chart) has broken out to the upside. That is good confirmation of solid buying prior to the stock's breakout.
This fiscal year ending April 30 analysts forecast a 28% increase in net to $1.29 a share from $1.01 a year ago. They recently boosted their annual estimate.
The stock sells with a price-earnings ratio of 30. TTD sees that as reasonable.
Net for the upcoming fiscal fourth quarter should leap 36% to 35 cents a share from 26 cents a year ago. The highest estimate on the Street is at 36 cents a share. TTD sees chances for a mild upside surprise. The prior two quarters CYBX topped the consensus estimate by 12 cents a share and 2 cents a share.
Going out to fiscal 2013 ending in April, analysts project at 19% gain in net to $1.54 a share from the anticipated $1.29 in fiscal 2012
Net for the fiscal first quarter ending in July should climb 29%.
The Street looks for 36 cents a share, up from 28 cents a year
ago. 
. Strategy Opinion: TTD is targeting the stock for a move to 48 off this breakout. A protective stop can be placed near 37, which is tight.
TTD rates CYBX a good intermediate-term play provided earnings remain on course.
Sponsorship: Average. The largest fund holder is Fidelity Growth Strategies Fund with a 3.8% stake. The 2-star rated fund was a recent seller of 150,200 shares. A key buyer recently was 4-star rated CREF Stock Fund which picked up 18,200 shares. CYBX has 27.5 million shares outstanding. Institutions hold 89% of the stock.
Insider Activity: Bearish. Insiders have been steady sellers. Some have sold after exercising options at #12.95 to $17. They sold at $38 recently. Currently, 9 analysts follow the stock, 7 have a buy, the same as three months ago.
Stock Performance Chart with Quarterly Earnings Markers
Insider Activity - Buying in Green - Selling in Red
| TTD's Breakout Profile
Rating Cyberonics Inc. - (CYBX) |
| TTD Check List | Bullish | Bearish | Neutral |
| Near 52-week High | YES | ||
| Volume | YES | ||
| Tick Volume | YES | ||
| Price Trend - Daily | YES | ||
| Price Trend - Long Term | YES | ||
| Price Daily Spread | YES | ||
| Base Structure | YES | ||
| Base - A-D | YES | ||
| Earnings-Quarterly | YES | ||
| Earnings-Long Term | YES | ||
| Earnings Outlook | YES | ||
| Industry Group | YES | ||
| Prior Breakout Success | YES | ||
| Fund Sponsorship | YES | ||
| Total Score | 11 | 0 | 3 |
Charts of Selected Breakout Stocks
| TTD's Quality Rating of Stock - CPA - AVERAGE |
| TTD's Quality Rating of Stock - KOF - AVERAGE |
| TTD's Quality Rating of Stock - PATK - AVERAGE |
| TTD's Quality Rating of Stock - MHO - BELOW AVERAGE |

Ticker Tape Digest’s Daily List of “Stocks To Sell or Sell Short” ranks stocks well timed to be sold immediately based on daily trading. The list can be used as an alert to reduce current long-term positions.
Shorts from tape action so far today - 8
Stocks Screened - 8,300
Long-Term Environment for bears: Unfavorable.
Bear Side - Good number of shorts today with some getting hit after posting disappointing earnings. Bears be venturesome. Stock market still in a trading range.
SGI, based in Fremont, Ca., provides computer storage products. Annual revenues: $713 million. SGI's stock falls sharply today after the company reported a loss for the fiscal third quarter ending March 30. So far today, SGI is trading a heavy 6.6 million shares, 11 times its normal daily volume. TTD sees more on the downside.
TTD highlighted SGI as a short at our midsession video show on the Web Thursday.
SGI reported a loss for the fiscal third quarter of 4 cents a share compared with a loss of 5 cents a share a year ago. Results were slightly below Street expectations
SGI's stock fell in the morning and continued to work lower through the day. It has hit an intraday low of 6.25 so far.
TTD's clip of the tape shows the recent big block trades.
One can see the price for the blocks declining from $8.71 to $6.65. A key bearish trade came when a block of 63,847 shares (duplicated) crossed the tape at $7.69. That was down from the prior block trade at $7.99.
SGI is a provider of servers, storage, and data center solutions targeting data center deployments. The company's products are designed to provide benefits in the areas of density, power efficiency, thermal management, ease of serviceability, and remote management.
Its customers include the leading names in internet and cloud computing area.
For fiscal 2012 ending in June, analysts forecast a 54% drop in net to 13 cents a share from 28 cents a year ago.
SGI's daily chart show the stock with a gap drop in February. The stock then trended sideways. Now it gaps lower once again with heavy volume. The stock's accumulation - distribution line (bottom of chart) has turned down sharply. That indicates heavy selling pressure.
Strategy Opinion: TTD is targeting SGI for a drop to 5 within the next few months or sooner. A protective stop buy can be placed near 7.50.
| TTD's Quality Rating of Stock - SGI - BELOW AVERAGE |

TTD columnist Leo Fasciocco has covered the stock market for over 20 years. His articles appear in many publications. He is also a speaker at the Intershow conferences. He has been on television and radio. He is author of many educational articles about stock investing and the book “Guide To High-Performance Investing.”

For information to subscribe to the Ticker Tape Digest Services call: B. J. Owen at 1-480-926-1680. Distributed by Corona Publishing Enterprises. Ticker Tape Digest Inc. P.O. Box 2044 Chandler, Az. 85244-2044. TTD “Professional Report” is available on the World Wide Web: $100 per month. Password needed. “TTD Professional“ Faxed is $200 per month. The TTD Daily Report is $39.95. Credit cards accepted.
(The information contained has been prepared from data deemed reliable but there is no guarantee of complete accuracy. Ticker Tape Digest Inc. is not affiliated with any broker, dealer or investment advisor. Nothing in this publication constitutes an offer, recommendation or solicitation to buy or sell any securities. Further research is advised. This report is copyrighted and no redistribution is permitted with out permission.)