Daily - Go to TTD's Tape of Stock Charts - Monday, May 11, 2015
|
Daily - Go to TTD's Tape of Stock Charts - Monday, May 11, 2015 |
|
Weekly - Bullish Conservative Investors - Go To TTD Long-Term Plays - Monday, May 11, 2015 |
|
Go to Video Show - "How to Make Money With Breakout Stocks" |
|---|

By Leo Fasciocco -- TTD
Ticker Tape Digest presents its daily stock market report containing stocks to go long as breakout trades, quick trades, or bargain trades. We also feature stocks under Significant Accumulation that are poised to breakout.
|
Ticker Tape Digest's Daily schedule guide for TTD subscribers 1. Pre-market - check Breakout Watch List and Quick Trades. 2. Morning - (11:30 - 12 A.M.) - check breakout stocks tape and breakout chart slide show. 3. Midday (1 P.M.) check TTD Midsession Report and see market video show. 4. After close (4 P.M.) check final TTD Report for day. Trading Strategies Bullish Aggressive Investors Bullish - "Breakout Stocks" - ideally suited for bull markets and special situation stocks. Potential for large returns. (See Performance) Aggressive Investor Bullish- "Quick Trade Stocks" -ideally suited for entry into top performing issues looking for a small quick profit." (See Performance) Conservative Investors "Bargain Buy Trades for the Long Term." Ideally suited for entry into top performing big cap stocks on pullbacks within overall up trend.(See Performance) Bearish Aggressive Bearish Investors - "Breakdown Stocks" to Sell Short. Ideally suited for bear markets or market pull backs. Potential for large returns (See Performance) |
|---|
The TTD report also contains stocks to short as breakdown plays and as bargain (swing trade) shorts.
Investors should tend to try to go with a strategy that fits with the stock market's trend, unless there is a special situation play.
TTD's Breakout Stocks - Long are
most suitable for aggressive investors seeking ideal entry points into leading stocks, especially during bull markets. They can do extremely well in bull markets with gains of as much as several hundred percent. 
These stocks can also do extremely well during strong market rallies, or if they are in a industry group that is performing very well. They tend to have strong earnings outlooks and are near new-52 week, or all-time highs.
TTD Quick Trade Stocks - Long These are leading issues that have pulled back in recent days, but could move higher soon. They are most suitable for Aggressive Investors willing to trade short term. These stocks will do extremely well during market advances. They have about 74% win rate. During market rally sequences the win rate is even higher. The return is small 3% to 8% in just a few days.
TTD's Bargain Buy Trades - Long - Long Term. These are for conservative bullish Investors These long-term buys are ideally suited for entry into stocks on pull backs within overall up trend. These stocks can give a good return long-term especially during a bull market.
TTD also presents Stocks To Sell or Sell Short. These issues are suitable for aggressive investors willing to take short positions both as trades or for longer-term plays. These stocks will do very well during bear markets or market pull backs.
TTD's Bearish breakdown stocks to sell short. These issues have potential to fall sharply. They often show a technical breakdown and also some fundamental business problem such as weak earnings.
TTD's multi-media updates include a slide-show that presents charts and analysis at midsession. Some times TTD presents feature analysis on stocks and the market. TTD uses Windows Media Files. (WMV).
TTD also presents a "Breakout Watch List" that is up dated daily. This list consists of key stocks in position to breakout. A close watch of this list can put you in the stock just as it breaks out. A good idea is to study the list and be ready to move into a stock quickly as it hits its breakpoint.
TTD often suggests using stop buy orders to enter. It is very important to buy a breakout stock as close as possible to the breakpoint. The idea is to get "elbow room" if the stock should follow through to the upside. This is very important in being successful in making big money with breakout stocks.
It is also essential to have a stop loss strategy for all stocks in which positions are taken. Not every stock will work as expected. It is important for investors to "police" their portfolios and avoid getting trapped in any bad positions.
Quality rating of breakout Two key factors: 1 - Stock near all-time high in price or near a 52-week high. 2 - earnings growth current year is strong. The ideal play is a stock with an Above Average Quality Rating. The stock is near a new high and will have strong earnings. TTD's other ratings are Average and Below Average.
TTD also has special feature sections on Educational Tips on Investing.
To email Mr. Leo Fasciocco leo@tickertapedigest.com.For service, email Beverly Owen owen@tickertapedigest.com. TTD’s Tel: 1-480-926-1680.
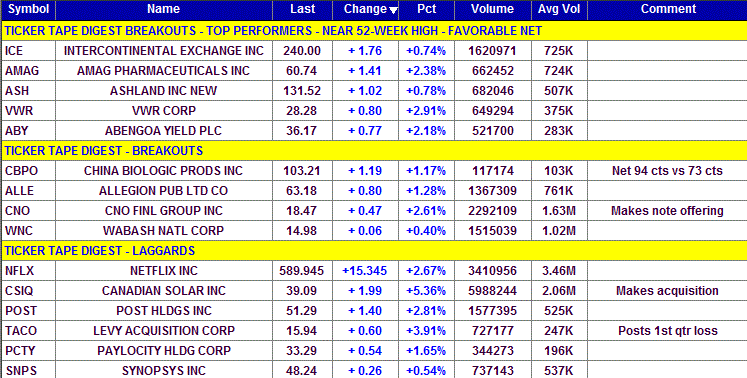
Breakout Stocks
Total Buy Breakouts so far today - 15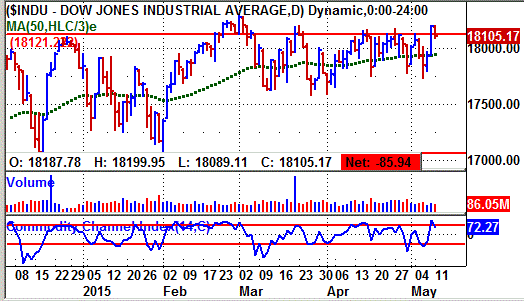
Overall Quality of Breakouts - ABOVE AVERAGE
Stocks Screened - 8,300
Bull side - Breakout list large with some good looking plays. Bulls be selective. Stock market continues in trading range.
(Put mouse on Dow chart to see Nasdaq chart)
Long Term Environment for bulls: Favorable
Stock Market Momentum
Market (Daily) - NYSE Bullish, Nasdaq Bullish
Market (Weekly) - NYSE Bearish, Nasdaq Bearish
Market (Monthly) - NYSE Bullish, Nasdaq Bullish
Ticker Tape Digest's
|
TTD's Quality Rating of Stock - ICE - ABOVE AVERAGE |
ICE, based in Atlanta, Ga., operates a network of regulated securities exchanges including the NYSE. Annual revenues: $3.1 billion. ICE's stock breaks out today from a 12-week flat base. The move carries the stock to a new all-time. That is bullish.
So far today, ICE is trading a heavy 1.6 million shares, double its average daily volume of 725,000 shares.
ICE's stock pushed higher in the morning and cleared its base. However, it pulled back and hugged its breakpoint line. 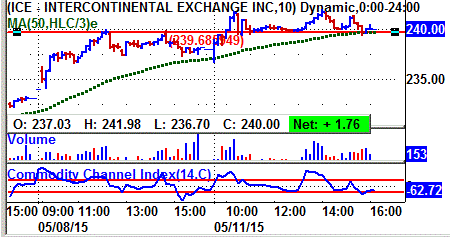 (See 10-minute chart)
The stock then moved higher in the afternoon and then finished the day just above its breakpoint line.
A look at the intraday chart shows strong volume when the stock advanced. That is bullish showing good accumulation.
ICE's tape action shows the recent block trades.
One can see the price for the blocks climbing from $237.19 in the morning to as high as $241.34 in the afternoon.
A key bullish trade came in the morning when a block of 15,000 shares crossed the tape at $238.77.
That was up from the prior block trade at 237.19 on 3,101 shares.
At the close a block of 33,191 shares crossed the tape at $240. That came in a long sequence of trades at $240. 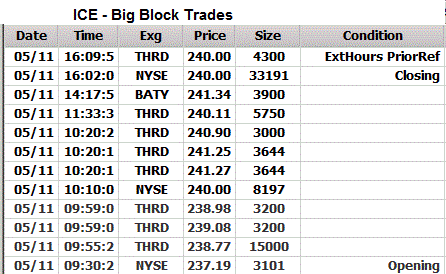
ICE is a leading network of regulated exchanges and clearing houses for financial and commodity markets.
It delivers data, technology and risk management services to markets around the world through its portfolio of exchanges, including the New York Stock Exchange, ICE Futures, Liffe and Euronext.
The company offers access to contracts based on crude oil and refined products, natural gas, power and emissions, as well as agricultural commodities including cocoa, coffee, cotton, orange juice, and sugar.
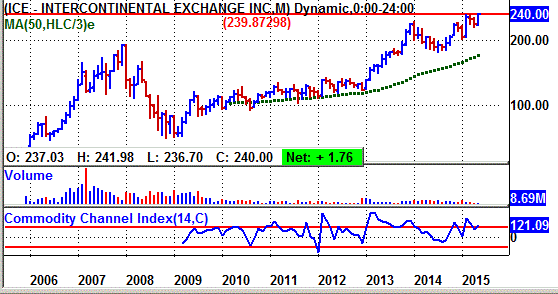
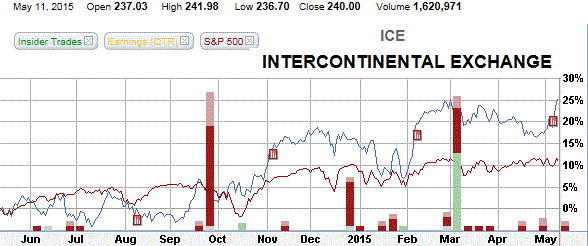
ICE's 12-month performance chart shows the stock appreciating 25% versus a 12% gain for the S&P 500 index.
ICE's performance chart shows some heavy insider selling and buying.
ICE's stock came public in late 2005 and traded at $32. The stock shot ahead to a peak of 194 by late 2007.
However, the stock fell back to 50 in 2008 due to the bear market. Since then ICE has participated well in the current long bull market. It has made almost a fivefold move.
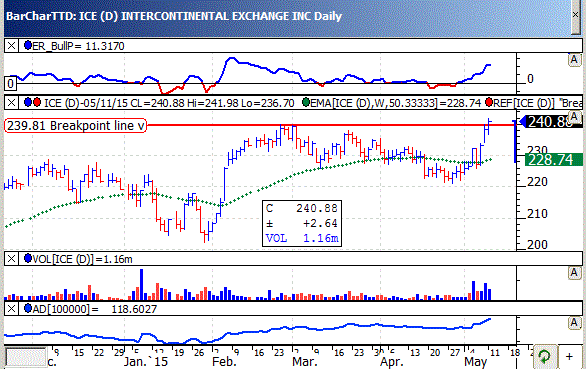
ICE's daily chart shows the stock climbing from 205 in January to a peak near 239 by late February.
The stock then trended sideways with a bit of a pull back in late April.
However, it turned higher and today clears its resistance line.
The stock has been showing good buying on the tape.
ICE's TTD momentum indicator (top of chart) is strongly bullish.
The accumulation - distribution line (bottom of chart) has turned up sharply indicating strong buying on the tape.
This year, analysts are forecasting a 25% jump in net to $12.02 a share from $9.63 a year ago.
The stock sells with a price-earnings ratio of 20. TTD sees that as reasonable. 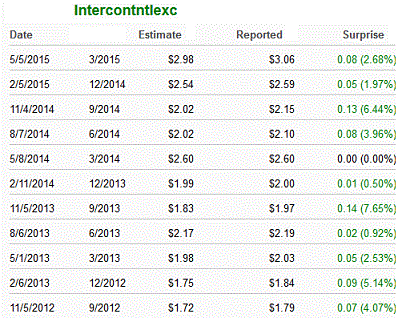
Going out to 2016, analysts look for a 17% gain in net to $14.01 a share from the anticipated $12.02 this year.
Net for the next two quarters will be very strong.
Earnings for the second quarter is expected to leap 41% to $2.95 a share from $2.10 the year before. The highest estimate on the tape is at $3.26 a share.
TTD sees good chances for an upside earnings surprise. The company has a good history of beating the Street (see table).
Going out to the third quarter, the Street predicts a 37% jump in net to $2.94 a share from $2.15 a year ago.
Strategy Opinion: TTD is targeting ICE for a move to 290. It will be important to see a follow through on Monday's breakout. A protective stop can be placed near 230.
TTD rates ICE a good intermediate-term play provided earnings meet expectations.
Sponsorship: Excellent. A key fund buyer was the 5-star rated Voya Large Cap Growth Port S Fund which purchased 227,675 shares. It now has a 0.41% stake.
Also, the 4-star rated T. Rowe Price Blue Chip Growth Fund was a recent purchaser of 215,500 shares. It has a 0.77% stake.
ICE has 111.8 million shares outstanding. Institutions hold 90% of the stock and insiders 2%.
Insider Activity: Bearish. Insiders were recent buyers using stock options at $1-4 to $112 a share. They were sellers at $230 to $235.
Currently, 16 analysts follow the stock, 12 have a buy, down from 13 three months ago. ICE has a book value of $09.38.
Stock Performance Chart with Quarterly Earnings Markers.
| TTD's Breakout Profile
Rating Intercontinental Exchange Inc. - (ICE) |
| TTD Check List | Bullish | Bearish | Neutral |
| Near 52-week High | YES | ||
| Volume | YES | ||
| Tick Volume | YES | ||
| Price Trend - Daily | YES | ||
| Price Trend - Long Term | YES | ||
| Price Daily Spread | YES | ||
| Base Structure | YES | ||
| Base - A-D | YES | ||
| Earnings-Quarterly | YES | ||
| Earnings-Long Term | YES | ||
| Earnings Outlook | YES | ||
| Industry Group | YES | ||
| Prior Breakout Success | YES | ||
| Fund Sponsorship | YES | ||
| Total Score | 14 | 0 | 0 |
Charts of Selected Breakout Stocks
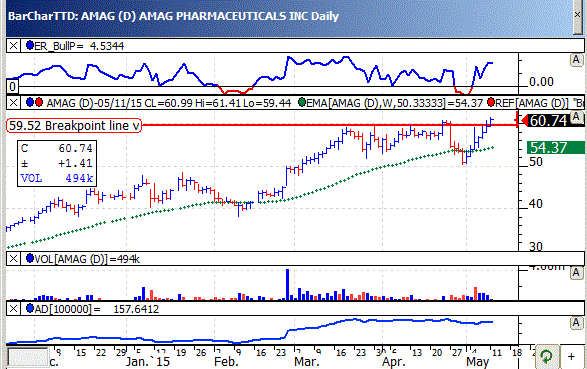
| TTD's Quality Rating of Stock - AMAG - ABOVE AVERAGE |
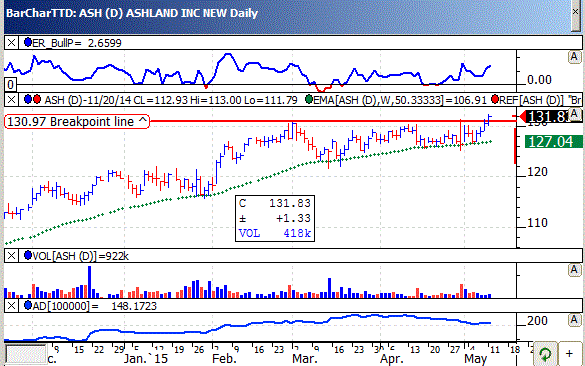
| TTD's Quality Rating of Stock - ASH - ABOVE AVERAGE |
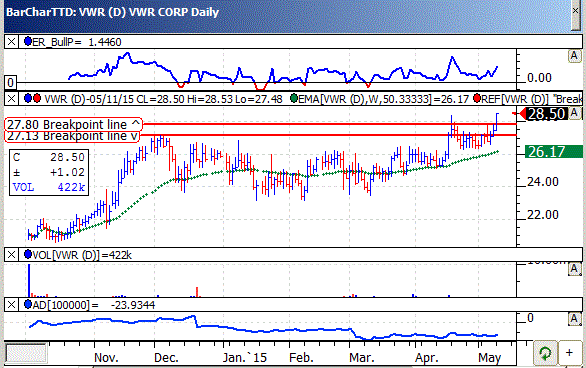
| TTD's Quality Rating of Stock - VWR - ABOVE AVERAGE |
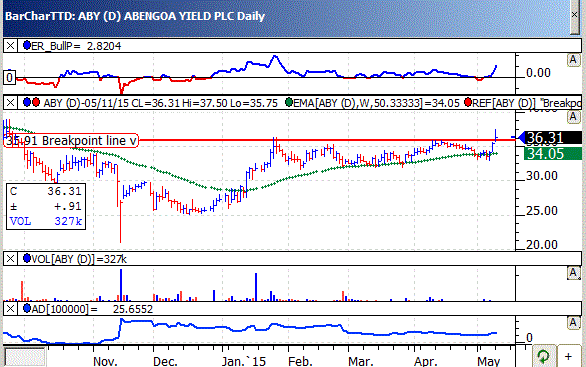
| TTD's Quality Rating of Stock - ABY - AVERAGE |

Ticker Tape Digest’s Daily List of “Stocks To Sell or Sell Short” ranks stocks well timed to be sold immediately based on daily trading. The list can be used as an alert to reduce current long-term positions.
Shorts from tape action so far today - 4
Stocks Screened - 8,300
Long-Term Environment for bears: Unfavorable.
Bear Side - Small list of breakdown stocks. Bears be selective. Stock market remains in a trading range. TTD's short from Friday was Proassurance Corp. (PRA) at 44. Today, PRA has declined to 43.68 and is working well for bears.
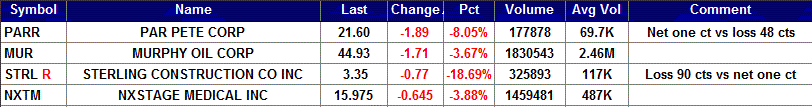
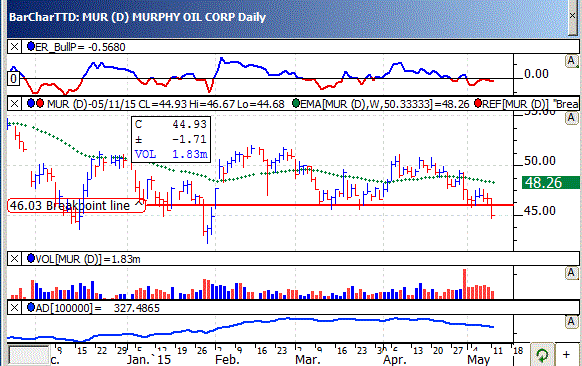
MUR, based in El Dorado, Ark., produces and explores for oil and gas. Annual revenues: $5.3 billion. MUR's stock declines today and cuts below key support. So far today, MUR is trading 2.3 million shares. Its average daily volume is 2.5 million shares. TTD sees more on the downside.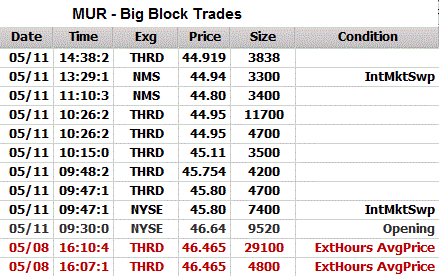
TTD highlighted MUR as a short at our midsession video show on the Web Monday.
MUR's stock fell steadily in the morning and hit an intraday low of 44.68.
The stock then lifted slightly and trende sideways the rest of the day.
MUR's tape action shows the recent block trades.
One can see the price for the blocks falling from $46.46 in the prior session to as low as $44.80 Monday.
A key bearish trade came wihen a block of 7,400 shares crossed the tape at $45.80.
That was down from the prior block trade at $46.64 on 9,520 shares.
MUR has oil and refining and marketing operations in the U.S. and the U.K and crude oil transportation and trading operations.
It explores for and produces crude oil, natural gas, and natural gas liquids.
This year, analysts are forecasting MUR will show a loss of $2.50 a share compared with a profit of $3.39 the prior year.
Going out to 2016, the Street looks for a loss of 84 cents a share.
MUR's daily chart shows the stock cutting below key support. The TTD momentum indicator (top of chart) is bearish.
Strategy Opinion: TTD is targeting MUR for a decline to 38 within the next few months, or sooner. A protective stop 47.
| TTD's Quality Rating of Stock - MUR - BELOW AVERAGE |
TTD columnist Leo Fasciocco has covered the stock market for over 20 years. His articles appear in many publications. He is also a speaker at the Intershow conferences. He has been on television and radio. He is author of many educational articles about stock investing and the book “Guide To High-Performance Investing.”

For information to subscribe to the Ticker Tape Digest Services call: Beverly Owen at 1-480-926-1680. Distributed by Corona Publishing Enterprises. Ticker Tape Digest Inc. P.O. Box 2044 Chandler, Az. 85244-2044. TTD “Professional Report” is available on the World Wide Web: $100 per month. Password needed. “TTD Professional“ Faxed is $200 per month. The TTD Daily Report is $39.95. Credit cards accepted.
(The information contained has been prepared from data deemed reliable but there is no guarantee of complete accuracy. Ticker Tape Digest Inc. is not affiliated with any broker, dealer or investment advisor. Nothing in this publication constitutes an offer, recommendation or solicitation to buy or sell any securities. Further research is advised. This report is copyrighted and no redistribution is permitted with out permission.)