Daily - Go to TTD's Chart scroller of Breakout and Leading Stocks - Wednesday, May 11, 2016
|
Daily - Go to TTD's Chart scroller of Breakout and Leading Stocks - Wednesday, May 11, 2016 |
|
Weekly - Bullish Conservative Investors - Go To TTD Long-Term Plays - Monday, May 9, 2016 |
|
Go to Video Show - "How to Make Money With Breakout Stocks" |
|---|

By Leo Fasciocco -- TTD
Ticker Tape Digest presents its daily stock market report containing stocks to go long as breakout trades, quick trades, or bargain trades. We also feature stocks under Significant Accumulation that are poised to breakout.
|
Ticker Tape Digest's Daily schedule guide for TTD subscribers 1. Pre-market - check Breakout Watch List and Quick Trades. 2. Morning - (11:30 - 12 A.M.) - check breakout stocks tape and breakout chart slide show. 3. Midday (1 P.M.) check TTD Midsession Report and see market video show. 4. After close (4 P.M.) check final TTD Report for day. Trading Strategies Bullish Aggressive Investors Bullish - "Breakout Stocks" - ideally suited for bull markets and special situation stocks. Potential for large returns. (See Performance) Aggressive Investor Bullish- "Quick Trade Stocks" -ideally suited for entry into top performing issues looking for a small quick profit." (See Performance) Conservative Investors "Bargain Buy Trades for the Long Term." Ideally suited for entry into top performing big cap stocks on pullbacks within overall up trend.(See Performance) Bearish Aggressive Bearish Investors - "Breakdown Stocks" to Sell Short. Ideally suited for bear markets or market pull backs. Potential for large returns (See Performance) |
|---|
The TTD report also contains stocks to short as breakdown plays and as bargain (swing trade) shorts.
Investors should tend to try to go with a strategy that fits with the stock market's trend, unless there is a special situation play.
TTD's Breakout Stocks - Long are
most suitable for aggressive investors seeking ideal entry points into leading stocks, especially during bull markets. They can do extremely well in bull markets with gains of as much as several hundred percent. 
These stocks can also do extremely well during strong market rallies, or if they are in a industry group that is performing very well. They tend to have strong earnings outlooks and are near new-52 week, or all-time highs.
TTD Quick Trade Stocks - Long These are leading issues that have pulled back in recent days, but could move higher soon. They are most suitable for Aggressive Investors willing to trade short term. These stocks will do extremely well during market advances. They have about 74% win rate. During market rally sequences the win rate is even higher. The return is small 3% to 8% in just a few days.
TTD's Bargain Buy Trades - Long - Long Term. These are for conservative bullish Investors These long-term buys are ideally suited for entry into stocks on pull backs within overall up trend. These stocks can give a good return long-term especially during a bull market.
TTD also presents Stocks To Sell or Sell Short. These issues are suitable for aggressive investors willing to take short positions both as trades or for longer-term plays. These stocks will do very well during bear markets or market pull backs.
TTD's Bearish breakdown stocks to sell short. These issues have potential to fall sharply. They often show a technical breakdown and also some fundamental business problem such as weak earnings.
TTD's multi-media updates include a slide-show that presents charts and analysis at midsession. Some times TTD presents feature analysis on stocks and the market. TTD uses Windows Media Files. (WMV).
TTD also presents a "Breakout Watch List" that is up dated daily. This list consists of key stocks in position to breakout. A close watch of this list can put you in the stock just as it breaks out. A good idea is to study the list and be ready to move into a stock quickly as it hits its breakpoint.
TTD often suggests using stop buy orders to enter. It is very important to buy a breakout stock as close as possible to the breakpoint. The idea is to get "elbow room" if the stock should follow through to the upside. This is very important in being successful in making big money with breakout stocks.
It is also essential to have a stop loss strategy for all stocks in which positions are taken. Not every stock will work as expected. It is important for investors to "police" their portfolios and avoid getting trapped in any bad positions.
Quality rating of breakout Two key factors: 1 - Stock near all-time high in price or near a 52-week high. 2 - earnings growth current year is strong. The ideal play is a stock with an Above Average Quality Rating. The stock is near a new high and will have strong earnings. TTD's other ratings are Average and Below Average.
TTD also has special feature sections on Educational Tips on Investing.
To email Mr. Leo Fasciocco leo@tickertapedigest.com.For service, email Beverly Owen owen@tickertapedigest.com. TTD’s Tel: 1-480-926-1680.
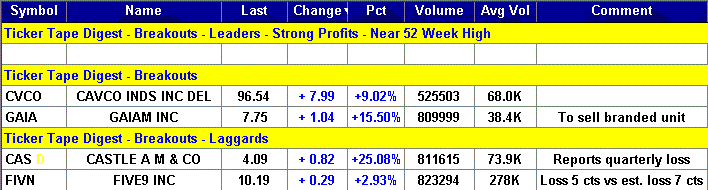
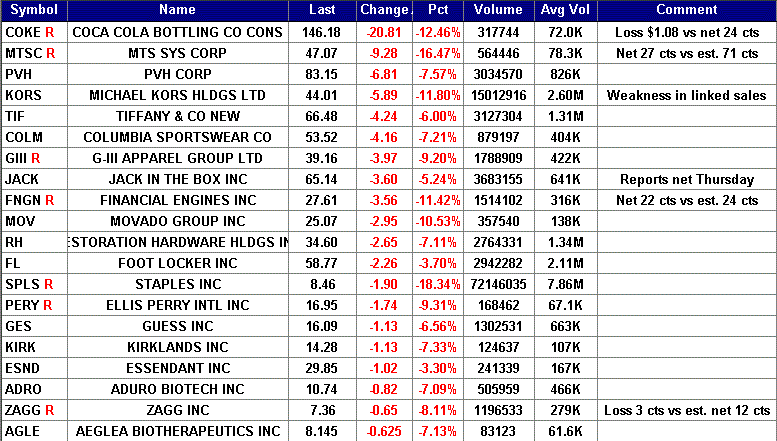
Breakout Stocks
Total Buy Breakouts so far today - 4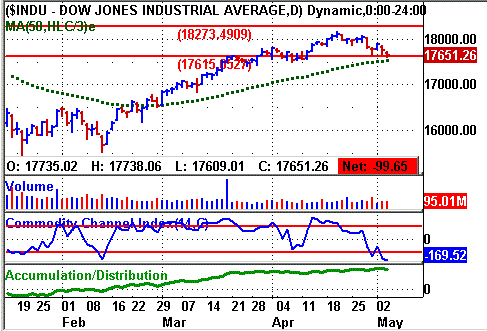
Overall Quality of Breakouts - BELOW AVERAGE
Stocks Screened - 8,300
Bull side - Breakout list small and low quality. Bulls be patient and selective. Stock market still in near-term up trend.
(Put mouse on Dow chart to see Nasdaq chart)
Long Term Environment for bulls: Neutral
Stock Market Momentum
Market (Daily) - NYSE Bullish, Nasdaq Bullish
Market (Weekly) - NYSE Bearish, Nasdaq Bearish
Market (Monthly) - NYSE Bullish, Nasdaq Bullish
Ticker Tape Digest's
|
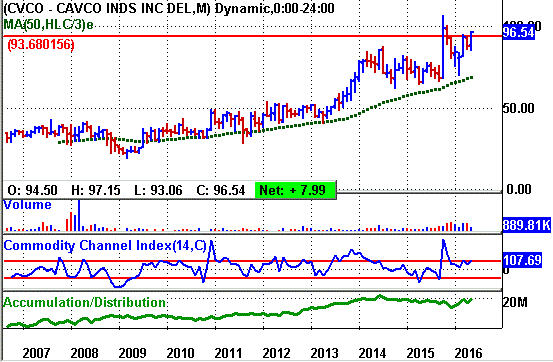
TTD's Quality Rating of Stock - CVCO - AVERAGE |
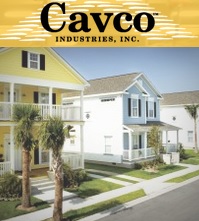
CVCO, based in Phoenix, Az., builds homes and park model RVs. Annual revenues: $676 million. CVCO's stock drives higher Wednesday to break out from a seven-week flat base. The move was triggered by CVCO being added to the S&P SmallCap 600 index.
Volume is running at a heavy 525,403 shares, seven times its average daily volume of 68,000 shares.
The jump in the price is due to mutual fund index buying as a result of being added to the S&P index.
CVCO's stock gapped higher in the morning to clear its breakpoint line. (see 10-minute chart). 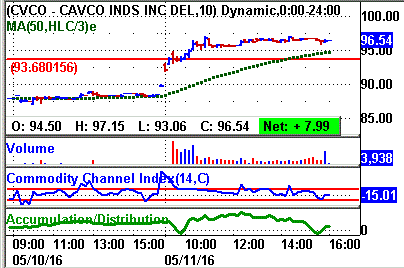
The stock reached an intraday peak of 97.15 in the afternoon and held the bulk of its gain into the closing bell.
CVCO's tape action shows the recent block trades.
One can see the price for the blocks jumping from $88.55 in the prior session to as high as $96.55 on Wednesday.
A key bullish trade came in the morning when a block of 900 shares crossed the tape at $93.99.
That is up from the prior block trade at $88.55 on 1,340 shares.
The stock finished strong. 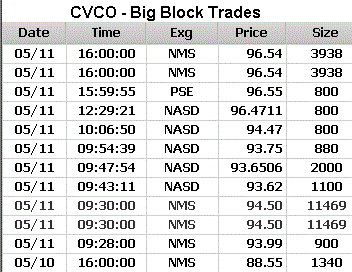
CVCO makes factory-built Housing and provides financial services.
The company sells its homes under the Cavco Homes, Fleetwood Homes, Palm Harbor Homes, Fairmont Homes, and Chariot Eagle brands.
It also produces modular homes, including single and multi-section/modular ranch-style dwellings, split-level homes, Cape Cod style homes, two and three story homes, and multi-family units under the Nationwide Homes brand name.
In addition, the company builds park model RVs and vacation cabins, as well as systems-built commercial structures, such as apartment buildings, condominiums, hotels, workforce housing, schools, and housing for U.S. military troops.
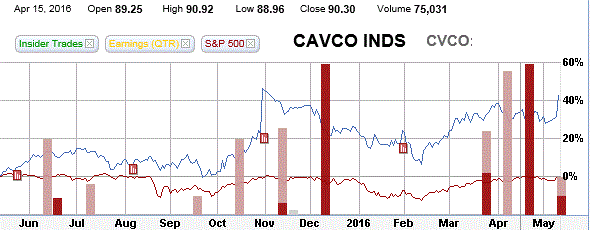
CVCO's 12-month performance chart shows the stock appreciating 42% versus a 2% decline for the stock market.
The performance chart shows steady insider selling. (red bars on chart)
CVCO's long-term chart shows the stock touching a peak at $43.14 in 2007, the top in the prior bull market.
The stock then fell back to $18.80 by early 2009 due to the bear market.
However, since then it has been working higher participating well in the current bull market. It reached an all-time high of $106.55 late last year. 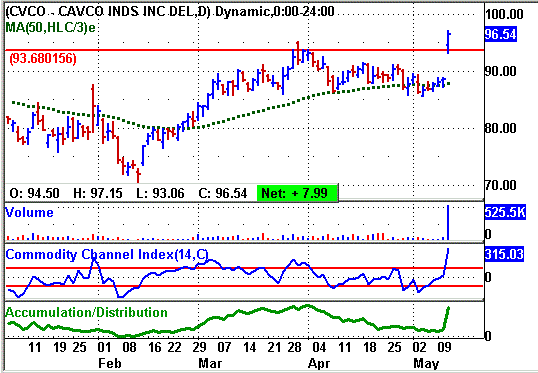
CVCO's daily chart shows the stock advancing from $70 back in February to a peak near $93 by late March.
The stock then pulled back and formed its flat base.
The breakout today comes with a gap move sparked by the S&P listing.
The stock's CCI momentum indicator (bottom of chart) is strongly bullish.
The accumulation - distribution line (bottom of chart) has shot higher.
Analysts are forecasting a 21% increase in net for the fiscal year ending in March 30. The Street expects net of $3.08 a share, up from $2.55 a year ago.
Going out to fiscal 2017 ending in March, analysts are looking for a 21% rise in net to $4.03 a share from the anticipated $3.08 for fiscal 2016. 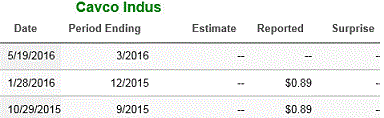
Net for the upcoming fiscal fourth quarter ending in March is expected to rise 4% to 69 cents a share from 66 cents the year before.
Going out to the first fiscal quarter of fiscal 2017 ending in June, the Street is looking for a 70% leap in net to $1.02 a share from 60 cents the year before.
Strategy Opinion: TTD is targeting CVCO for a move to 114 within the next several months, or sooner. A protective stop can be placed near 91 giving it room.
TTD rates CVCO a good intermediate-term play provided earnings meet expectations.
Sponsorship: Average. The largest fund holder is 2-star rated Third Avenue Value Inst Fund with a big 10% stake. It was a recent seller of 391,183 shares.
A key fund holder is the 4-star rated VA CollegeAmerica Smcap World 529E with a 2.3% stake. It has held its position steady.
Insider Activity: Slightly Bearish. Insiders were recent buyers using stock options at $23 to $25 a share. They were sellers at $89 to $92 a share.
Currently, 2 analysts follow the stock and both have a buy, up from one three months ago.
CVCO has a book value of $38.62 a share.
Stock Performance Chart with Quarterly Earnings Markers.
| TTD's Breakout Profile
Rating Cavco Industries Inc. - (CVCO) |
| TTD Check List | Bullish | Bearish | Neutral |
| Near 52-week High | YES | ||
| Volume | YES | ||
| Tick Volume | YES | ||
| Price Trend - Daily | YES | ||
| Price Trend - Long Term | YES | ||
| Price Daily Spread | YES | ||
| Base Structure | YES | ||
| Base - A-D | YES | ||
| Earnings-Quarterly | YES | ||
| Earnings-Long Term | YES | ||
| Earnings Outlook | YES | ||
| Industry Group | YES | ||
| Prior Breakout Success | YES | ||
| Fund Sponsorship | YES | ||
| Total Score | 13 | 0 | 1 |
Charts of Selected Breakout Stocks
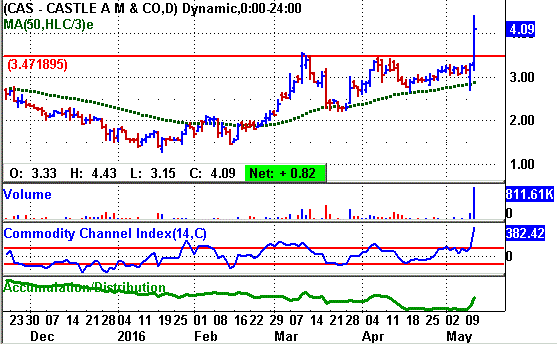
| TTD's Quality Rating of Stock - CAS - BELOW AVERAGE |
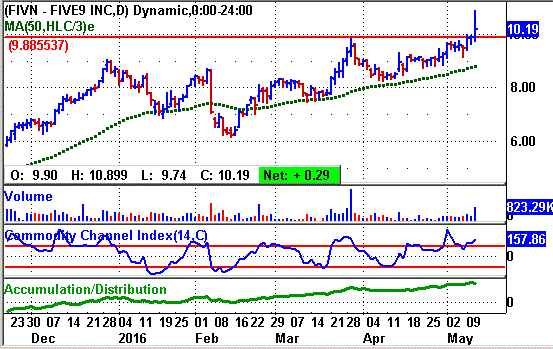
| TTD's Quality Rating of Stock - FIVN - BELOW AVERAGE |

Ticker Tape Digest’s Daily List of “Stocks To Sell or Sell Short” ranks stocks well timed to be sold immediately based on daily trading. The list can be used as an alert to reduce current long-term positions.
Shorts from tape action so far today - 20
Stocks Screened - 8,300
Long-Term Environment for bears: Neutral.
Bear Side - Large list of short plays as stock market falls sharply Wednesday. Bears can be selective. Retail stocks under heavy selling pressure.
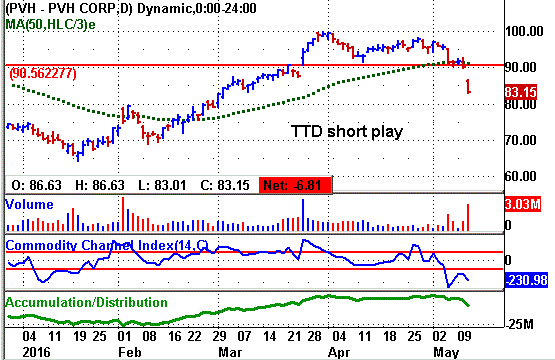
PVH, based in New York, is an apparel firm selling a diverse line of clothes. Annual revenues: $8 billion. PVH's stock falls sharply Wednesday and undercuts key technical support. So far today, PVH is trading a heavy 3 million shares, more than triple its average daily volume of 826,000 shares. 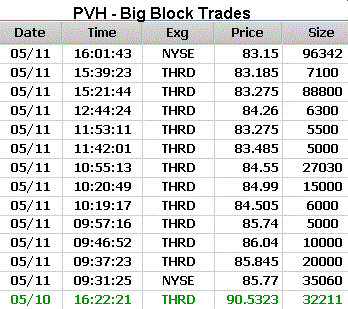
TTD highlighted PVH as a short at our midsession video show on the web Wednesday.
PVH's stock gapped lower in the morning and undercut key technical support.
The stock touched a low of 83.11 in the morning.
The stock rallied modestly but then rolled over to its low for the day of 83.01.
PVH's tape action shows the recent block trades.
One can see the price for the blocks falling from $90.53 to as low as $83.15.
A key bearish trade came in the morning when a block of 35,060 shares crossed the tape at $85.77.
That was down from the prior block trade at $90.53 on 32,211 shares.
Then near the close a massive block of 96,342 shares crossed at $83.15. That was down from the prior block trade at $83.18 on 7,100 shares.
PVH operates through Calvin Klein North America, Calvin Klein International, Tommy Hilfiger North America, Tommy Hilfiger International, Heritage Brands Wholesale, and Heritage Brands Retail.
It sells mens and womens dress shirts, neckwear, sportswear, jeans wear, intimate apparel, swim products, handbags, footwear, golf apparel, fragrances, cosmetics, eyewear, hosiery, socks, jewelry, watches, outerwear, small leather goods, and home furnishings/
PVH will report quarterly earnings later this months. The Street is looking for net for the fiscal fist quarter ending in April will decline 4% to $1.43 a share from $1.50 the year before.
For the fiscal year ending in January of 2017, the Street looks for a 6% decline in net to $6.64 a share from the $7.05 a year before.
PVH's daily chart shows the stock making a gap move lower on big volume. It undercuts key technical support. The stock's accumulation - distribution line has now rolled over and is bearish.
Strategy Opinion: TTD is targeting PVH for a drop to 75 within the next few months, or sooner. A protective stop buy can be placed near 86.
| TTD's Quality Rating of Stock - PVH - BELOW AVERAGE |
TTD columnist Leo Fasciocco has covered the stock market for over 20 years. His articles appear in many publications. He is also a speaker at the Intershow conferences. He has been on television and radio. He is author of many educational articles about stock investing and the book “Guide To High-Performance Investing.”

For information to subscribe to the Ticker Tape Digest Services call: Beverly Owen at 1-480-926-1680. Distributed by Corona Publishing Enterprises. Ticker Tape Digest Inc. P.O. Box 2044 Chandler, Az. 85244-2044. TTD “Professional Report” is available on the World Wide Web: $100 per month. Password needed. “TTD Professional“ Faxed is $200 per month. The TTD Daily Report is $39.95. Credit cards accepted.
(The information contained has been prepared from data deemed reliable but there is no guarantee of complete accuracy. Ticker Tape Digest Inc. is not affiliated with any broker, dealer or investment advisor. Nothing in this publication constitutes an offer, recommendation or solicitation to buy or sell any securities. Further research is advised. This report is copyrighted and no redistribution is permitted with out permission.)