Daily - Go to TTD's Chart scroller of Breakout and Leading Stocks - Monday, May 16, 2016
|
Daily - Go to TTD's Chart scroller of Breakout and Leading Stocks - Monday, May 16, 2016 |
|
Weekly - Bullish Conservative Investors - Go To TTD Long-Term Plays - Monday, May 16, 2016 |
|
Go to Video Show - "How to Make Money With Breakout Stocks" |
|---|

By Leo Fasciocco -- TTD
Ticker Tape Digest presents its daily stock market report containing stocks to go long as breakout trades, quick trades, or bargain trades. We also feature stocks under Significant Accumulation that are poised to breakout.
|
Ticker Tape Digest's Daily schedule guide for TTD subscribers 1. Pre-market - check Breakout Watch List and Quick Trades. 2. Morning - (11:30 - 12 A.M.) - check breakout stocks tape and breakout chart slide show. 3. Midday (1 P.M.) check TTD Midsession Report and see market video show. 4. After close (4 P.M.) check final TTD Report for day. Trading Strategies Bullish Aggressive Investors Bullish - "Breakout Stocks" - ideally suited for bull markets and special situation stocks. Potential for large returns. (See Performance) Aggressive Investor Bullish- "Quick Trade Stocks" -ideally suited for entry into top performing issues looking for a small quick profit." (See Performance) Conservative Investors "Bargain Buy Trades for the Long Term." Ideally suited for entry into top performing big cap stocks on pullbacks within overall up trend.(See Performance) Bearish Aggressive Bearish Investors - "Breakdown Stocks" to Sell Short. Ideally suited for bear markets or market pull backs. Potential for large returns (See Performance) |
|---|
The TTD report also contains stocks to short as breakdown plays and as bargain (swing trade) shorts.
Investors should tend to try to go with a strategy that fits with the stock market's trend, unless there is a special situation play.
TTD's Breakout Stocks - Long are
most suitable for aggressive investors seeking ideal entry points into leading stocks, especially during bull markets. They can do extremely well in bull markets with gains of as much as several hundred percent. 
These stocks can also do extremely well during strong market rallies, or if they are in a industry group that is performing very well. They tend to have strong earnings outlooks and are near new-52 week, or all-time highs.
TTD Quick Trade Stocks - Long These are leading issues that have pulled back in recent days, but could move higher soon. They are most suitable for Aggressive Investors willing to trade short term. These stocks will do extremely well during market advances. They have about 74% win rate. During market rally sequences the win rate is even higher. The return is small 3% to 8% in just a few days.
TTD's Bargain Buy Trades - Long - Long Term. These are for conservative bullish Investors These long-term buys are ideally suited for entry into stocks on pull backs within overall up trend. These stocks can give a good return long-term especially during a bull market.
TTD also presents Stocks To Sell or Sell Short. These issues are suitable for aggressive investors willing to take short positions both as trades or for longer-term plays. These stocks will do very well during bear markets or market pull backs.
TTD's Bearish breakdown stocks to sell short. These issues have potential to fall sharply. They often show a technical breakdown and also some fundamental business problem such as weak earnings.
TTD's multi-media updates include a slide-show that presents charts and analysis at midsession. Some times TTD presents feature analysis on stocks and the market. TTD uses Windows Media Files. (WMV).
TTD also presents a "Breakout Watch List" that is up dated daily. This list consists of key stocks in position to breakout. A close watch of this list can put you in the stock just as it breaks out. A good idea is to study the list and be ready to move into a stock quickly as it hits its breakpoint.
TTD often suggests using stop buy orders to enter. It is very important to buy a breakout stock as close as possible to the breakpoint. The idea is to get "elbow room" if the stock should follow through to the upside. This is very important in being successful in making big money with breakout stocks.
It is also essential to have a stop loss strategy for all stocks in which positions are taken. Not every stock will work as expected. It is important for investors to "police" their portfolios and avoid getting trapped in any bad positions.
Quality rating of breakout Two key factors: 1 - Stock near all-time high in price or near a 52-week high. 2 - earnings growth current year is strong. The ideal play is a stock with an Above Average Quality Rating. The stock is near a new high and will have strong earnings. TTD's other ratings are Average and Below Average.
TTD also has special feature sections on Educational Tips on Investing.
To email Mr. Leo Fasciocco leo@tickertapedigest.com.For service, email Beverly Owen owen@tickertapedigest.com. TTD’s Tel: 1-480-926-1680.
Breakout Stocks
Total Buy Breakouts so far today - 21
Overall Quality of Breakouts - ABOVE AVERAGE
Stocks Screened - 8,300
Bull side - Breakout list large with some good looking plays. Paper and Aerospace stocks breaking out. Stock market holds in up trend.
(Put mouse on Dow chart to see Nasdaq chart)
Long Term Environment for bulls: Neutral
Stock Market Momentum
Market (Daily) - NYSE Bullish, Nasdaq Bullish
Market (Weekly) - NYSE Bullish, Nasdaq Bullish
Market (Monthly) - NYSE Bullish, Nasdaq Bullish
Ticker Tape Digest's
|
TTD's Quality Rating of Stock - NCS - ABOVE AVERAGE |
NCS, based in Houston, Tex., makes metal products for the nonresidential construction industry in North America. Annual revenues: $1.6 billion. NCS's stock pushed higher Monday and breaks out from a six-week flat base. 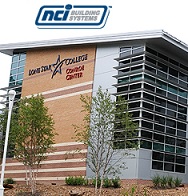
So far today, NCS is trading 483,376 shares, about double its average daily volume of 229,000 shares.
NCS's stock  cleared its breakpoint in the morning. The stock worked to its peak of $15.94 around midday.
The stock then trended mostly sideways holding the bulk of its gain.
NCS's tape action shows the recent block trades.
One can see the price for the blocks climbing from $15.30 to as high as 15.90.
One can see a key bullish trade coming around noon when a block of 55,464 shares crossed the tape at $15.85.
That was up from the prior block at $15.69 on 2,000 shares. 
The company operates in three area: Engineered Building Systems, Metal Components, and Metal Coil Coating.
The engineered building systems segment offers engineered structural members and panels; and self-storage building systems to builders, contractors, developers, and end users.
The metal components segment offers metal roof and wall systems, metal partitions, metal trims, doors, insulated panels, and other related accessories for new construction and repairs.
The company's metal coil coating segment engages in the cleaning, treating, and painting various flat-rolled metals in coil form, as well as in slitting and/or embossing the metal.
NCS's 12-month performance chart shows the stock rallying strongly in recent months. The stock is up 3% versus a 4% decline for the stock market.
NCS's long-term chart shows the stock climbing from 6 back in 2011 to a peak of 21.58 in 2014.
The stock then pulled back to around 9 by early 2016. The stock then rallied steadily to around 15 by April. The breakout looks solid coming with expanding volume.
NCS's daily chart shows the stock trending higher and forming a flat base above its 50-day moving average line.
The breakout looks solid with expanding volume.
The stock's CCI momentum indicator (bottom of chart) is strongly bullish.
The accumulation - distribution line has broken out confirming the price breakout.
This fiscal year ending in October analysts are forecasting a 52% surge in profits to 64 cents a share from 42 cents a year before.
The stock sells with price-earnings ratio of 24, TTD sees that as attractive given the earnings growth rate.
Going out to fiscal 2017 ending in October, the Street looks for a 34% jump in net to 86 cents a share from the anticipated 64 cents this fiscal year. 
Net for the fiscal third quarter ending in July is expected to climb 29% to 19 cents a share from 15 cents a year before.
Strategy Opinion: TTD is targeting NCS for a move to 20 within the next few months or sooner.
A protective stop can be placed near 14.80.
TTD rates NCS a good intermediate-term play provided earnings meet expectations.
Sponsorship: Good. A key fund buyer recently was American Century Small Cap Value Fund which purchased 75,000 shares. The 4-star rated fund has a 0.55% stake.
The largest fund holder is the 2-star rated Royce Opportunity Investment Fund which holds a 1.3% stake. It has kept its stake steady.
Insider Activity: Bullish. Insiders were buyers using stock options at $8.85 a share. They were sellers around $12.57 a share.
Currently, 9 analysts follow the stock, 8 have a buy, the same as three months ago.
NCS has a book value of $3.74 a share.
Stock Performance Chart with Quarterly Earnings Markers.
| TTD's Breakout Profile
Rating NCI Building Systems Inc. - (NCS) |
| TTD Check List | Bullish | Bearish | Neutral |
| Near 52-week High | YES | ||
| Volume | YES | ||
| Tick Volume | YES | ||
| Price Trend - Daily | YES | ||
| Price Trend - Long Term | YES | ||
| Price Daily Spread | YES | ||
| Base Structure | YES | ||
| Base - A-D | YES | ||
| Earnings-Quarterly | YES | ||
| Earnings-Long Term | YES | ||
| Earnings Outlook | YES | ||
| Industry Group | YES | ||
| Prior Breakout Success | YES | ||
| Fund Sponsorship | YES | ||
| Total Score | 9 | 0 | 5 |
Charts of Selected Breakout Stocks
| TTD's Quality Rating of Stock - EDU - ABOVE AVERAGE |
| TTD's Quality Rating of Stock - MXL - ABOVE AVERAGE |

| TTD's Quality Rating of Stock - ACN - AVERAGE |
| TTD's Quality Rating of Stock - HEI - AVERAGE |


Ticker Tape Digest’s Daily List of “Stocks To Sell or Sell Short” ranks stocks well timed to be sold immediately based on daily trading. The list can be used as an alert to reduce current long-term positions.
Shorts from tape action so far today - 5
Stocks Screened - 8,300
Long-Term Environment for bears: Neutral.
Bear Side - Small list of breakdown stocks Monday. Bears be selective. Stock market now in new rally phase.
VRTU, based in Westborough, Ma., provides IT consulting services for inventory and portfolio assessment and business. Annual revenues: $554 million. VRTU's stock falls sharply Monday after the company reduced its earnings outlook. 
TTD highlighted VRTU as a short at our midsession video show on the Web Monday.
So far today, VRTU is trading a heavy 820,679 shares. seven times its average daily volume of 114,000 shares.
VRTU's tape action shows the recent block trades.
One can see the price for the blocks falling from $35.19 in the prior session to as low as $31.83.
A key bearish trade came in the morning when a block of 5,000 shares crossed the tape at $31.27.
That was down sharply from the prior block trade at $35.19 on 12,240 shares on Friday.
VRTU provides business and IT consulting services comprising application inventory and portfolio assessment, business/technology alignment analysis, business process optimization, and quality assurances.
The Street is forecasting an 8% decline in net for the fiscal first quarter ending in June. They look for net of 37 cents a share, down from 40 cents a year ago.
Going out to fiscal 2017 ending in March, the Street is predicting a 6% increase in net to $1.72 a share from $1.62 in the prior year.
VRTU's daily chart shows the stock falling from 45 in February down to 33. The stock trended mostly sideways for the next several months. Today, VRTU falls sharply undercutting key technical support with heavy volume.
Strategy Opinion: TTD is targeting VRTU for a decline to 26 within the next few months or sooner. A protective stop buy can be placed near 34.
| TTD's Quality Rating of Stock - VRTU - BELOW AVERAGE |
TTD columnist Leo Fasciocco has covered the stock market for over 20 years. His articles appear in many publications. He is also a speaker at the Intershow conferences. He has been on television and radio. He is author of many educational articles about stock investing and the book “Guide To High-Performance Investing.”

For information to subscribe to the Ticker Tape Digest Services call: Beverly Owen at 1-480-926-1680. Distributed by Corona Publishing Enterprises. Ticker Tape Digest Inc. P.O. Box 2044 Chandler, Az. 85244-2044. TTD “Professional Report” is available on the World Wide Web: $100 per month. Password needed. “TTD Professional“ Faxed is $200 per month. The TTD Daily Report is $39.95. Credit cards accepted.
(The information contained has been prepared from data deemed reliable but there is no guarantee of complete accuracy. Ticker Tape Digest Inc. is not affiliated with any broker, dealer or investment advisor. Nothing in this publication constitutes an offer, recommendation or solicitation to buy or sell any securities. Further research is advised. This report is copyrighted and no redistribution is permitted with out permission.)