Daily - Go to TTD's Chart scroller of Breakout and Leading Stocks - Tuesday, May 17, 2016
|
Daily - Go to TTD's Chart scroller of Breakout and Leading Stocks - Tuesday, May 17, 2016 |
|
Weekly - Bullish Conservative Investors - Go To TTD Long-Term Plays - Monday, May 16, 2016 |
|
Go to Video Show - "How to Make Money With Breakout Stocks" |
|---|

By Leo Fasciocco -- TTD
Ticker Tape Digest presents its daily stock market report containing stocks to go long as breakout trades, quick trades, or bargain trades. We also feature stocks under Significant Accumulation that are poised to breakout.
|
Ticker Tape Digest's Daily schedule guide for TTD subscribers 1. Pre-market - check Breakout Watch List and Quick Trades. 2. Morning - (11:30 - 12 A.M.) - check breakout stocks tape and breakout chart slide show. 3. Midday (1 P.M.) check TTD Midsession Report and see market video show. 4. After close (4 P.M.) check final TTD Report for day. Trading Strategies Bullish Aggressive Investors Bullish - "Breakout Stocks" - ideally suited for bull markets and special situation stocks. Potential for large returns. (See Performance) Aggressive Investor Bullish- "Quick Trade Stocks" -ideally suited for entry into top performing issues looking for a small quick profit." (See Performance) Conservative Investors "Bargain Buy Trades for the Long Term." Ideally suited for entry into top performing big cap stocks on pullbacks within overall up trend.(See Performance) Bearish Aggressive Bearish Investors - "Breakdown Stocks" to Sell Short. Ideally suited for bear markets or market pull backs. Potential for large returns (See Performance) |
|---|
The TTD report also contains stocks to short as breakdown plays and as bargain (swing trade) shorts.
Investors should tend to try to go with a strategy that fits with the stock market's trend, unless there is a special situation play.
TTD's Breakout Stocks - Long are
most suitable for aggressive investors seeking ideal entry points into leading stocks, especially during bull markets. They can do extremely well in bull markets with gains of as much as several hundred percent. 
These stocks can also do extremely well during strong market rallies, or if they are in a industry group that is performing very well. They tend to have strong earnings outlooks and are near new-52 week, or all-time highs.
TTD Quick Trade Stocks - Long These are leading issues that have pulled back in recent days, but could move higher soon. They are most suitable for Aggressive Investors willing to trade short term. These stocks will do extremely well during market advances. They have about 74% win rate. During market rally sequences the win rate is even higher. The return is small 3% to 8% in just a few days.
TTD's Bargain Buy Trades - Long - Long Term. These are for conservative bullish Investors These long-term buys are ideally suited for entry into stocks on pull backs within overall up trend. These stocks can give a good return long-term especially during a bull market.
TTD also presents Stocks To Sell or Sell Short. These issues are suitable for aggressive investors willing to take short positions both as trades or for longer-term plays. These stocks will do very well during bear markets or market pull backs.
TTD's Bearish breakdown stocks to sell short. These issues have potential to fall sharply. They often show a technical breakdown and also some fundamental business problem such as weak earnings.
TTD's multi-media updates include a slide-show that presents charts and analysis at midsession. Some times TTD presents feature analysis on stocks and the market. TTD uses Windows Media Files. (WMV).
TTD also presents a "Breakout Watch List" that is up dated daily. This list consists of key stocks in position to breakout. A close watch of this list can put you in the stock just as it breaks out. A good idea is to study the list and be ready to move into a stock quickly as it hits its breakpoint.
TTD often suggests using stop buy orders to enter. It is very important to buy a breakout stock as close as possible to the breakpoint. The idea is to get "elbow room" if the stock should follow through to the upside. This is very important in being successful in making big money with breakout stocks.
It is also essential to have a stop loss strategy for all stocks in which positions are taken. Not every stock will work as expected. It is important for investors to "police" their portfolios and avoid getting trapped in any bad positions.
Quality rating of breakout Two key factors: 1 - Stock near all-time high in price or near a 52-week high. 2 - earnings growth current year is strong. The ideal play is a stock with an Above Average Quality Rating. The stock is near a new high and will have strong earnings. TTD's other ratings are Average and Below Average.
TTD also has special feature sections on Educational Tips on Investing.
To email Mr. Leo Fasciocco leo@tickertapedigest.com.For service, email Beverly Owen owen@tickertapedigest.com. TTD’s Tel: 1-480-926-1680.
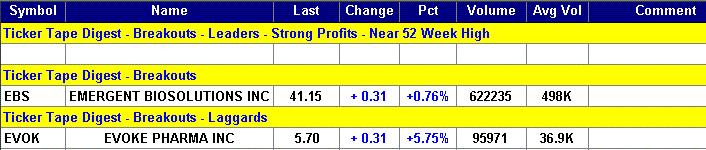
Breakout Stocks
Total Buy Breakouts so far today - 2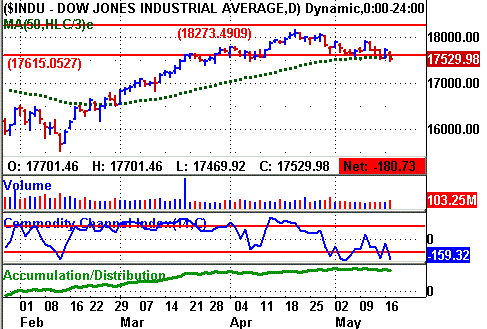
Overall Quality of Breakouts - AVERAGE
Stocks Screened - 8,300
Bull side - Breakout list small. Bulls be patient and selective. Stock market pulls back and continues whipsaw action.
(Put mouse on Dow chart to see Nasdaq chart)
Long Term Environment for bulls: Neutral
Stock Market Momentum
Market (Daily) - NYSE Bearish, Nasdaq Bearish
Market (Weekly) - NYSE Bearish, Nasdaq Bearish
Market (Monthly) - NYSE Bullish, Nasdaq Bearish
Ticker Tape Digest's
|
TTD's Quality Rating of Stock - EBS - ABOVE AVERAGE |
EBS, based in Gaithersburg, Md., is a biotech firm that makes products to treat anthrax and a reaction from smallpox vaccination. Annual revenues: $570 million. EBS's stock breaks out from a five-month, cup-and-handle base. The mov carries the stock to a new all-time high. 
So far today, EBS is trading 622,235 shares. Its average daily volume is 498,000 shares.
EBS's stock pushed higher in the morning and cleared its breakpoint line. (See 10-minute chart)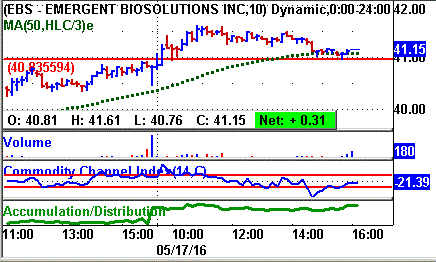
The stock reached an intraday peak of 41.61 in the morning. .
It then trended mostly sideways through midday and then gave some ground in the final hour.
EBS's tape action shows the recent block trade.
One can see the price for the blocks climbing from $40.81 in the morning to as high as $41.52 during the session.
A key bullish trade came in the morning when a block of 2,000 shares crossed the tape at $41.37.
That was up from the prior block trade at $40.81 on 4,089 shares.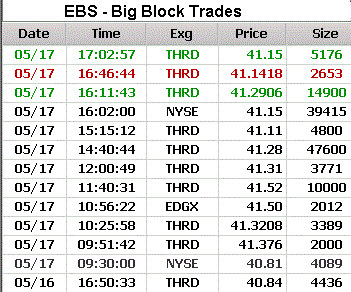
Late in the day, a massive block of 39,415 shares crossed the tape at $41.15. That was up from the prior block at $41.11 on 4,800 shares.
EBS makes BioThrax to treat anthrax disease.
It also produces Anthrasil to treat inhalational anthrax; BAT to treat botulinum disease, VIGIV to address the adverse events from smallpox vaccination.
It also makes and RSDL for the removal or neutralization of chemical agents, T-2 toxins, and various pesticide-related chemicals from the skin.
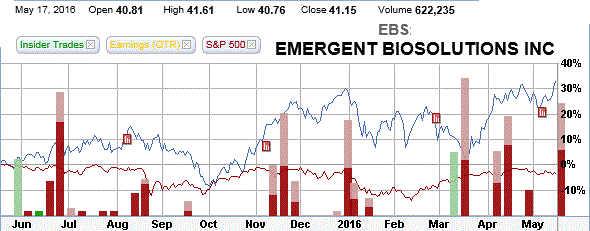
EBS's 12-month performance chart shows the stock appreciating 34% versus a 3% decline for the stock market.
The performance chart shows a lot of insider selling (red bars on chart) and some insider buying (green bars) recently.
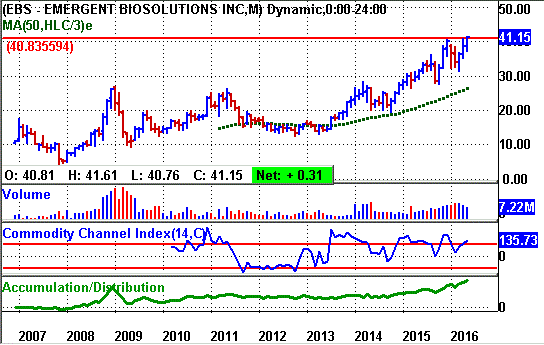
EBS's long-term chart shows the stock coming public in late 2006 at $10.35. The stock eventually worked its way to a peak of $27 by early 2009.
However, it fell back hard later in the year to 10. However, since 2009, EBS has climbed to around $41 - a four bagger.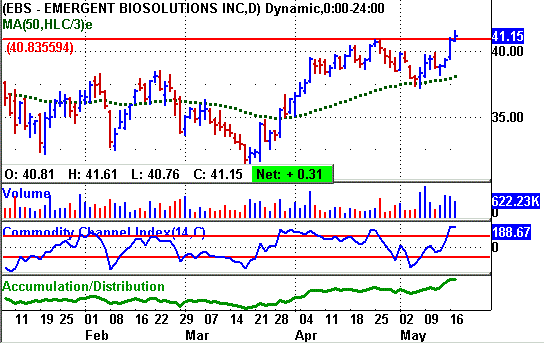
EBS's daily chart shows the stock peaking near 40 in April .
It then pulled back and forms a small cup-and-handle base above the rising 50-day moving average line.
The breakout Tuesday clears the base even though the stock market falls sharply.
The stock's CCI momentum indicator (bottom of chart) is strongly bullish.
The accumulation - distribution line is bullish too.
This year, analysts are forecasting a 20% jump in earnings to $1.92 a share from $1.60 a year ago.
The stock sells with a price-earnings ratio of 21. That is reasonable given the earnings prospects.
Going out to 2017, the Street looks for a 41% surge in net to $2.71 a share from the anticipated $1.92 this year.
For the upcoming second quarter, analysts expect an 8% decline in net to 33 cents a share from 36 cents a year ago. 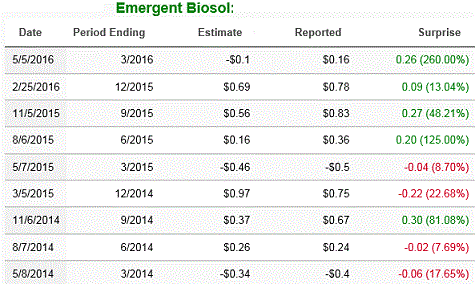
TTD sees good chances for an upside earnings surprise. The company topped the consensus estimates the past four quarters by 26 cents a share, 9 cents, 27 cents and 20 cents. (see table)
Going out to the third quarter analysts look for an 17% increase in net to 97 cents a share from 83 cents the year before.
Strategy Opinion: TTD is targeting the stock for a move to 50 off this breakout.
A protective stop can be placed near 38 which is tight.
TTD rates EBS a good intermediate-term play provided earnings meet expectations.
Sponsorship: Good. The largest fund buyer recently was the 4-star rated Gotham Absolute Return Inst. Fund which purchased 164,198 shares as a new position. It has a 0.5% stake.
Also, the 4-star rated Aberdeen US Small Cap Equity A Fund was a recent buyer of 71,524 shares It has a 0.9% stake.
EBS has 39.8 million shares outstanding. Institutions hold 84% of the stock and insiders 15%.
Insider Activity: Bearish. Insiders were recent buyers using stock options at $14 a share. They were sellers at $39.
Currently, 5 analysts follow the stock and all 5 have a buy. That is up from 3 three months ago.
EBS has a book value of $16.74 a share.
Stock Performance Chart with Quarterly Earnings Markers.
| TTD's Breakout Profile
Rating Emergent Biosolutions Inc. - (EBS) |
| TTD Check List | Bullish | Bearish | Neutral |
| Near 52-week High | YES | ||
| Volume | YES | ||
| Tick Volume | YES | ||
| Price Trend - Daily | YES | ||
| Price Trend - Long Term | YES | ||
| Price Daily Spread | YES | ||
| Base Structure | YES | ||
| Base - A-D | YES | ||
| Earnings-Quarterly | YES | ||
| Earnings-Long Term | YES | ||
| Earnings Outlook | YES | ||
| Industry Group | YES | ||
| Prior Breakout Success | YES | ||
| Fund Sponsorship | YES | ||
| Total Score | 14 | 0 | 0 |
Charts of Selected Breakout Stocks
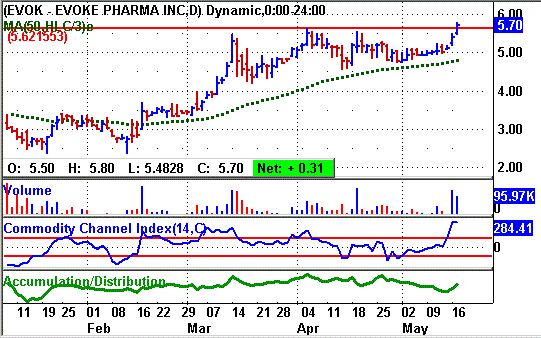
| TTD's Quality Rating of Stock - EVOK - BELOW AVERAGE |

Ticker Tape Digest’s Daily List of “Stocks To Sell or Sell Short” ranks stocks well timed to be sold immediately based on daily trading. The list can be used as an alert to reduce current long-term positions.
Shorts from tape action so far today - 10
Stocks Screened - 8,300
Long-Term Environment for bears: Neutral.
Bear Side - Large list of shorts Tuesday as stock market falls sharply. Bears can be venturesome.
TTD short from Monday was Virtusa Corp. (VRTU) at 32.12. Tuesday, VRTU declined to 31.01 and is working well for bears.
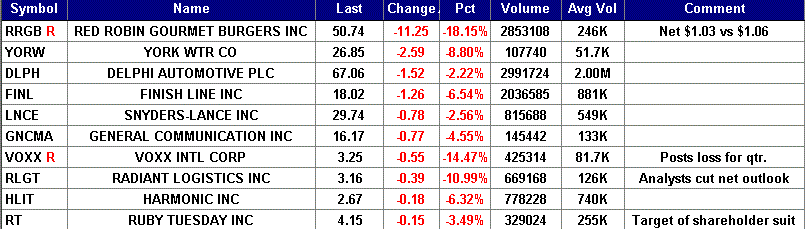
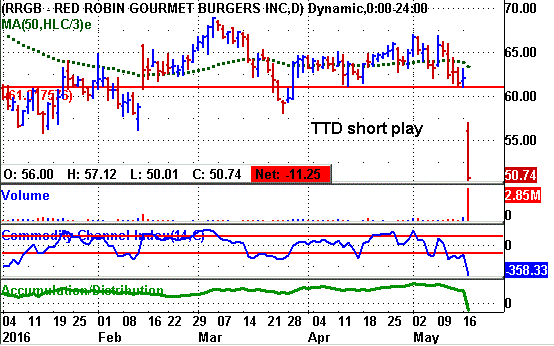
RGB, based in Grenwood Village, Co., operates and franchises casual-dining restaurants in the U.S. and Canada. RRGB's stock falls sharply Tuesday after the company reported disappointing revenues for the first quarter. TTD sees more on the downside.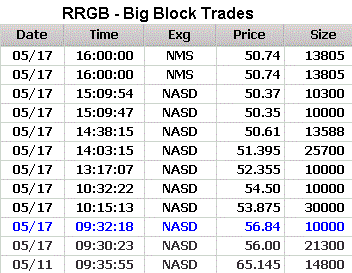
TTD highlighted RRGB as a short at our midsession video show on the Web Tuesday.
RRGB reported net for the first quarter of $1.27 a share versus Street estimates of $1.11 a share.
However, revenue were below projections. The Street was looking for revenues of $416 million. RRGB came in with just $402.8 million.
RRGB's stock fell in the morning and continued to trend lower into the afternon. It touched an intraday low of $50.01.
RRGB's tape action shows the recent block trades.
One can see the price for the blocks falling from $65.14 a few session ago to as low as $50.35.
A key bearish trade came in the morning when a block of 30,000 shares crossed the tape at $53.87.
That was down from the pror block trade at $56.84 on 10,000 shares.
RRGB has 530 Red Robin restaurants, including those operating under franchise agreements. Red Robin Gourmet Burgers, Inc. was founded in 1969.
This year, analysts were forecasting a 12% increase in RRGB's earnings to $3.71 a share from $3.32 a year ago. However, that forecast could come down.
RRGB's daily chart shows the stock gapping lower with big volume The stock's accumulation - distribution line (bottom of chart) is strongly bearish.
Strategy Opinion: TTD is targeting RRGB for a decline to 44 within the next few months, or sooner. A protective stop buy can be placed near 52.50.
| TTD's Quality Rating of Stock - RRGB - BELOW AVERAGE |
TTD columnist Leo Fasciocco has covered the stock market for over 20 years. His articles appear in many publications. He is also a speaker at the Intershow conferences. He has been on television and radio. He is author of many educational articles about stock investing and the book “Guide To High-Performance Investing.”

For information to subscribe to the Ticker Tape Digest Services call: Beverly Owen at 1-480-926-1680. Distributed by Corona Publishing Enterprises. Ticker Tape Digest Inc. P.O. Box 2044 Chandler, Az. 85244-2044. TTD “Professional Report” is available on the World Wide Web: $100 per month. Password needed. “TTD Professional“ Faxed is $200 per month. The TTD Daily Report is $39.95. Credit cards accepted.
(The information contained has been prepared from data deemed reliable but there is no guarantee of complete accuracy. Ticker Tape Digest Inc. is not affiliated with any broker, dealer or investment advisor. Nothing in this publication constitutes an offer, recommendation or solicitation to buy or sell any securities. Further research is advised. This report is copyrighted and no redistribution is permitted with out permission.)