Go To TTD's Pre-Market Opening Breakout Watch List -Wednesday, May 20
Go To TTD's Day Trades (win rate 80% for aggressive investors) for Wednesday, May 20
|
Go To TTD's Pre-Market Opening Breakout Watch List -Wednesday, May 20 |
Go To TTD's Day Trades (win rate 80% for aggressive investors) for Wednesday, May 20 |
|
|
|
Go to TTD Stock Market Show For - May 20 Go to TTD Stock Market Shows for Latest Week: Monday - Tuesday - Wednesday - Thursday - Friday Go to Video Show - "How to Make Money With Breakout Stocks" Go to Video Show -TTD Performance 2008 Long and Sh
|
|---|

By Leo Fasciocco -- TTD
Ticker Tape Digest presents its daily breakout and Short Selling report.
It contains Breakout Stocks and Stocks under  Significant Accumulation.
Data is from tape action for the day. These stocks are most suitable for aggressive investors seeking ideal entry points for leading stocks.
These stocks will do very well during bull markets and strong market rallies.
TTD also presents Stocks To Sell or Sell Short. These issues are suitable for aggressive investors willing to take short positions both as trades or for longer-term plays. These stocks
will do very well during bear markets or market corrections
TTD's multi-media updates include a slide-show that presents charts and analysis at midsession. Some times TTD presents feature analysis on stocks and the market. TTD uses Windows Media Files. (WMV).
TTD also presents a "Breakout Watch List" that is up dated daily. This list consists of key stocks in position to breakout. A close watch of this list can put you in the stock just as it breaks out. TTD often suggests using stop buy orders to enter. It is very important to buy a breakout stock as close as possible to the break point. The idea is to get "elbow room" if the stock should follow through to the upside. This is very important in being successful in making big money with breakout stocks.
TTD also has special feature sections on Educational Tips on Investing.
To email Mr. Leo Fasciocco leo@tickertapedigest.com.For service, email Beverly Owen owen@tickertapedigest.com. TTD’s Tel: 1-480-926-1680.
TTD Quick Trade Stocks. These are leading issues that have pulled back in recent days, but could move higher soon. They are most suitable for Aggressive Investors willing to trade short term. These stocks will do extremely well during market advances. They have about an 80% win rate.

Ticker Tape Digest's Midsession Stock Market Video Show(Posted 12:30 to 1 p.m. NYSE Time) Go to TTD Stock Market Show For - May 20Go to Shows for Latest Week: Monday - Tuesday - Wednesday - Thursday - Friday(Best with Cable or DSL - High quality - Windows Media Video) |
Total Buy Breakouts so far today - 7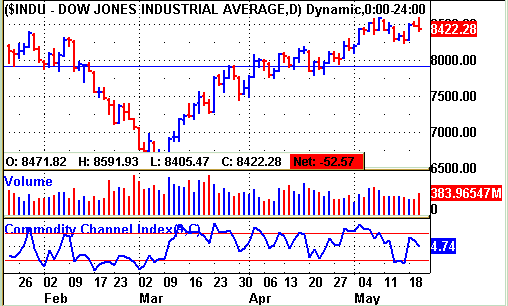
Stocks Screened - 8,200
Bull side - Breakout list expands modestly. Gold stocks dominate the list. Bulls remain selective. Market holding its ground well after strong run up.
(Put mouse on Dow chart to see Nasdaq chart)
Long Term Environment for bulls: Neutral
Market (Daily) - NYSE Bullish, Nasdaq Bullish
Market (Weekly) -NYSE Bullish, Nasdaq Bullish
Market (Monthly) NYSE Bullish, Nasdaq Bullish
| TTD's Quality Rating of Stock - CRXL - ABOVE AVERAGE |
CRXL, based in Leiden, Netherlands, is a drug firm developing and marketing
products to combat infectious diseases such as influenza, tuberculosis, and
rabies. Annual revenues: $290 million. The stock, a potential play on a big
outbreak of the swine flu, breaks out today from an 18-week flat base. TTD highlighted the stock recently. So far today, CRXL is trading a light 167,774 shares. Its average daily volume is 308,000 shares.
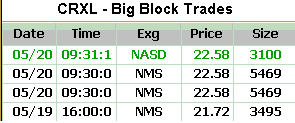
TTD highlighted CRXL at our midsession show on the Web today.
The stock gapped higher in the morning and then trended sideways the rest of the day.
TTD's clip of the tape shows the key trade to get the stock going in the morning. It was a big block of 5,469 shares which crossed at $22.58. (reported twice.). That was up from the prior block trade at $21.72. The tape action showed strong institutional buying interest.
Back when the swine flu news hit, CRXL caught our interest when on April 27 it traded a big 2.1 million shares, seven times its normal daily volume. some one obviously placed a big bet on the stock.
The firm employs its portfolio of proprietary technology platforms, such as its PER.C6 program, to develop drugs of its own and garner licensing payments from other drug firms. In addition to candidates in clinical development, Crucell already has pediatric, travel, and respiratory vaccines on the market.
TTD's six month performance chart shows CRXL's stock appreciating 88% compared with an 18% increase in the S&P 500 index.
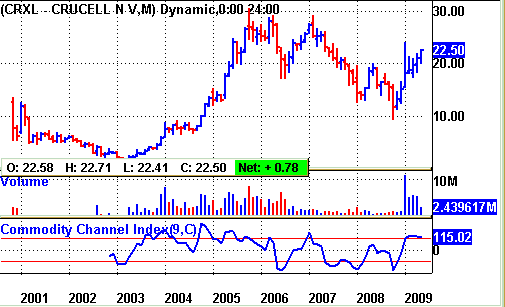
TTD's long-term chart shows CRXL's stock with a powerful move climbing
from 2 back in 2003 to a peak of 30 by October of 2005. The stock eventually
worked lower to 10 last year during the bear market. However, it is now on the
move higher. 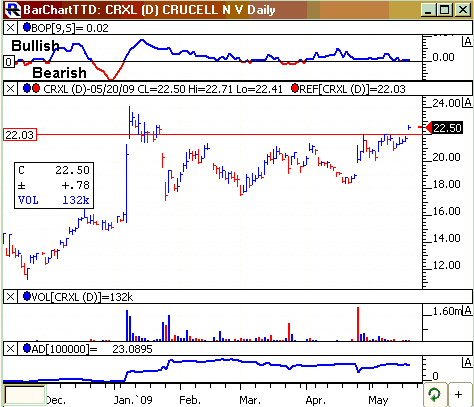
TTD's daily chart shows CRXL gaping higher and out from a flat base. Because the stock is an overseas issue it tends to have gap moves. So, we do not see that as significant.
The stock set up nicely in the base by moving toward the top of the base and then spending some time resting there.
The TTD momentum indicator (top of chart) is neutral.
The accumulation - distribution line (bottom of chart) dipped a bit recently, but has turned back up.
This year, analysts project that CRXL's earnings will soar 223% to 71 cents a share from 22 cents a year ago. The stock sells with a price-earnings ratio of 27, which is reasonable given the strong earnings outlook.
Next year, the Street sees earnings climbing 41% to $1.00 a share from the expected 71 cents this year.
CRXL is doing a great deal of research on the flu using antibody research. There is a chance the firm might do well if its products to treat flu are needed.
For the upcoming second quarter, analysts look for a profit of 9 cents a share compared with a loss of 19 cents a share a year ago. The highest estimate on the Street is at 13 cents a share. So, some see chances for a very good quarter.
Revenues jumped 50% in the first quarter. Gross margins expanded. The company is benefiting from sales of children's vaccines.
Strategy Opinion: CRXL is a "double play." The company has strong earnings and could potentially benefit if it is need to combat the swine flu. TTD is targeting the stock for a move to 28. The stock has a beta of 0.83 versus 1.00 for the stock market. So, it does tend to move slowly. A protective stop sell can be placed near 20 giving it room.
TTD rates CRXL a very good intermediate-term play because of the strong earnings outlook. It is also a stock that could surprise big on the upside if the swine flu becomes a big problem.
Sponsorship: Very Good. Gabelli Small Cap Growth Fund, 4-star rated, is the largest holder with a 0.29% stake. The largest buyer lately was 5-star rated Alger Health Sciences Fund, which purchased 85,000 shares. CRXL has 65 million shares outstanding. Funds hold just 650,000 shares.
Insider Activity: Not available. Three analysts follow the stock and 2 have a buy, down from 3 buys three months ago.
Stock Performance Chart for 6 months with Quarterly Earnings Markers.

| TTD's Breakout Profile
Rating Crucell N.V. (CRXL) |
| TTD Check List | Bullish | Bearish | Neutral |
| Near 52-week High | YES | ||
| Volume | YES | ||
| Tick Volume | YES | ||
| Price Trend - Daily | YES | ||
| Price Trend - Long Term | YES | ||
| Price Daily Spread | YES | ||
| Base Structure | YES | ||
| Base - A-D | YES | ||
| Earnings-Quarterly | YES | ||
| Earnings-Long Term | YES | ||
| Earnings Outlook | YES | ||
| Industry Group | YES | ||
| Prior Breakout Success | YES | ||
| Fund Sponsorship | YES | ||
| Total Score | 11 | 0 | 3 |
(The “breakout List” gives all stocks breaking out of a base of five weeks or more. These stocks have a good chance to trend higher. However, a stop should be used to avoid those that do not work.
(Trading strategy: One should buy breakout stocks at breakpoint by using market order or stop buy)

Charts of Breakout Stocks
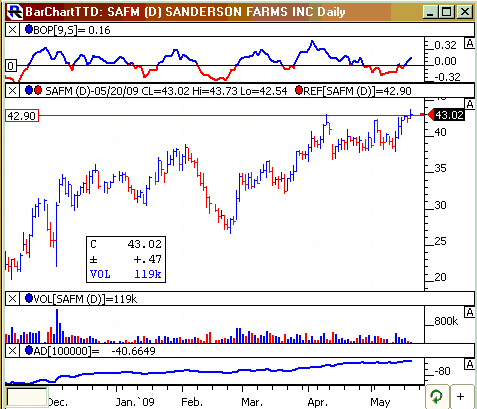
| TTD's Quality Rating of Stock - SAFM - ABOVE AVERAGE |
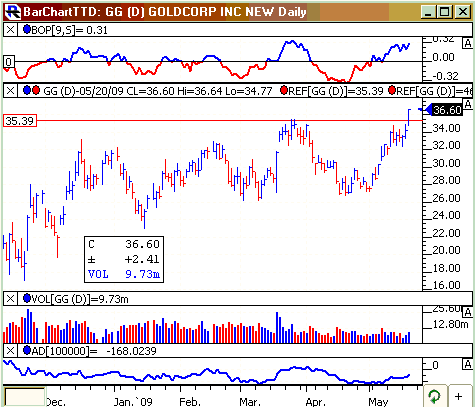
| TTD's Quality Rating of Stock - GG - AVERAGE |
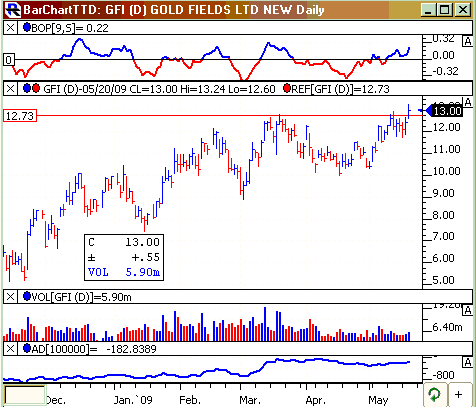
| TTD's Quality Rating of Stock - GFI - AVERAGE |
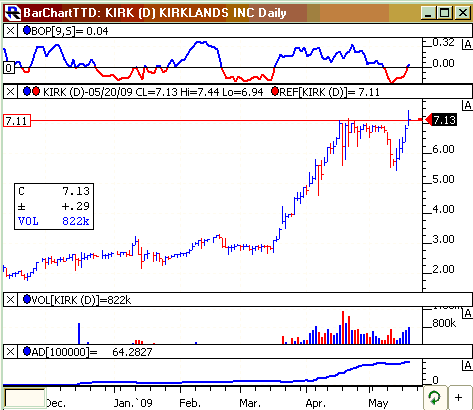
| TTD's Quality Rating of Stock - KIRK - BELOW AVERAGE |
Set a Stop Buy at 57 to Catch the Breakout
Profits to Spurt 74% This Year, TTD Targets 67 after a breakout
AEM, based in Toronto, produces and explores for gold in North America and
Finland. Annual revenues: $380 million. AEM is part of the gold sector which is
acting well..AEM is in a
five-month flat base. Today, the stock moves up some 3 points and is now in position to breakout. TTD highlighted AEM recently. So, we take another look at this key stock in the gold sector which has potential to move higher supported by strong profits. So far today, the price of gold is up $11 an ounce to $937 an ounce. 
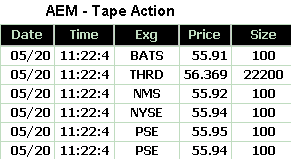
AEM's stock ran up sharply in the morning. It then trended sideways the rest of the day holding the bulk of its gains. Volume so far today is running at 4.2 million shares. Its average daily volume is 3.7 million shares.
TTD's clip of the tape today highlights a big block of 22,200 shares crossing on a big up tick to $56.36 from the prior trade at $55.92. The tape action indicates aggressive institutional buying.
AEM operates the LaRonde and Goldex mines in northwestern Quebec and the Kittila mine in Finland. It has two other projects that should begin production in the next 18 months and bring the company's production capacity to more than 1 million ounces of gold.
TTD's long-term chart shows that AEM had a strong run up in 2006 and 2007 climbing from 18 to 80.
It went into a bear market in 2008, but turned up late in the year. AEM is now
in an up trend long-term. 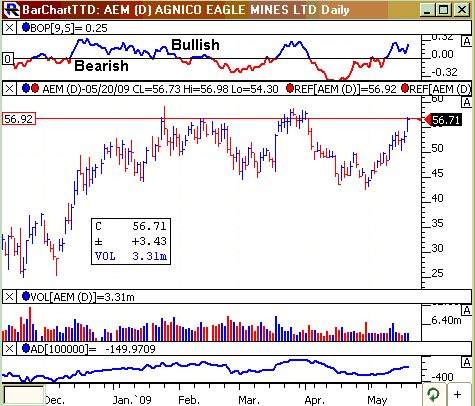
TTD's daily chart shows the stock "knocking on the door" of a breakout. It has moved up from 44 a few weeks ago. So, it has covered the width of its base. The stock will soon test the top of its base.
The stock's technicals are improving for bulls. The TTD momentum indicator (top of the chart) is strongly bullish.
The accumulation - distribution line (bottom of chart) has lagged but has now turned up.
AEM's stock performance will be linked to the price of gold which is now acting bullishly.
The company's earnings outlook is very strong. This year, analysts project a 74% jump in net to 73 cents a share from 42 cents a year ago. The stock sells with a price-earnings ratio of 75. That is high. However, it is justified by the outlook for 2010 earnings growth.
Analysts predict net for 2010 will soar 186% to $2.09 a share from the anticipated 73 cents a share this year.
Net for the upcoming second quarter is expected to surge 123% to 13 cents a share from 6 cents a year ago. The highest estimate on the Street is at 21 cents a share. So, some analysts see potential for a big quarter. The company is benefiting from strong gold production and favorable prices.
Strategy Opinion: TTD suggests accumulation of a partial stake. Further buying can be done on a breakout over 57. TTD is targeting AEM for a move to 67 after a breakout. A protective stop can be set at 54 after a breakout. That is tight. TTD rates AEM as a very good intermediate-term play provided earnings remain on target.
Sponsorship: Very Good. The largest fund holder is T. Rowe Price Mid-Cap Growth Fund with a 2.1% stake. The 4-star rated fund has held its position steady. Also, 4-star rated Hartford Capital Appreciation Fund was a recent purchaser of 1.1 million shares. AEM has 154 million shares outstanding. Funds hold 33.9 million shares.
Insider Activity: Not available. Currently, 12 analysts follow the stock, 7 have a buy, the same as three months ago.



Ticker Tape Digest’s Daily List of “Stocks To Sell or Sell Short” ranks stocks well timed to be sold immediately based on daily trading. The list can be used as an alert to reduce current long-term positions.
Shorts from tape action so far today - 2
Stocks Screened - 8,200
Long-Term Environment for bears: Neutral
Bear Side - Only a few breakdown stocks today. Bears be conservative and very selective.
(Trading strategy: These stocks can be sold short, or if held should be sold. If a stock is sold short, a protective stop buy should be placed. Short plays work best when the stock market is in a down trend.)

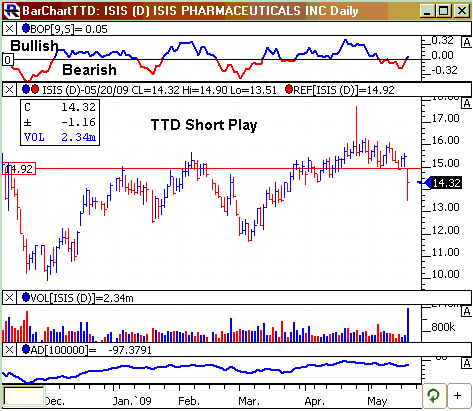
ISIS, based in Carlsbad, develops drugs. Annual revenues: $120 million. ISIS' stock falls sharply today in heavy trading. Some analysts express concern about side effects from the firms developing anti cholesterol drug. So far today, ISIS is trading a heavy 2.7 million shares, four times its normal daily volume of 706,000 shares. TTD sees more on the downside. 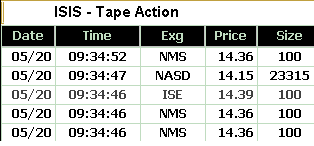
ISIS' stock fell in the morning. It had a modest bounce and then trended sideways the rest of the session.
TTD's clip of the tape highlights heavy selling pressure in the morning. A big block of 23,315 shares crossed at $14.15, a big down tick from the prior trade at $14.39. The tape action showed heavy institutional selling pressure.
ISIS works on developing RNA-based drugs for both its own product pipeline and for its partners.
The company’s portfolio focuses on cancers, metabolic and cardiovascular illnesses, and inflammatory diseases.
The firm's primary focus is on antisense drugs, which are used to control the expression of genes through interactions with RNA. ISIS also holds a majority stake in Ibis Biosciences, which has created a system to quickly identify infectious agents. The company’s intellectual property portfolio holds over 1,500 patents.
This year, analysts predict ISIS will show a loss of 6 cents a share compared with a loss of 4 cents a share a year ago. Next year, they see a loss of 13 cents a share.
TTD's daily chart shows ISIS breakdown below key support at 14.92. The heavy volume is an indicator of potential weakness in the weeks ahead.
Strategy Opinion: TTD is targeting ISIS for a drop to 11 within the next few months or sooner. A protective stop buy can be placed near 15.50.
TTD columnist Leo Fasciocco has covered the stock market for over 20 years. His articles appear in many publications. He is also a speaker at the Intershow conferences. He has been on television and radio. He is author of many educational articles about stock investing and the book “Guide To High-Performance Investing.”

For information to subscribe to the Ticker Tape Digest Services call: B. J. Owen at 1-480-926-1680. Distributed by Corona Publishing Enterprises. Ticker Tape Digest Inc. P.O. Box 2044 Chandler, Az. 85244-2044. TTD “Professional Report” is available on the World Wide Web: $100 per month. Password needed. “TTD Professional“ Faxed is $200 per month. The TTD Daily Report is $39.95. Credit cards accepted.
(The information contained has been prepared from data deemed reliable but there is no guarantee of complete accuracy. Ticker Tape Digest Inc. is not affiliated with any broker, dealer or investment advisor. Nothing in this publication constitutes an offer, recommendation or solicitation to buy or sell any securities. Further research is advised. This report is copyrighted and no redistribution is permitted with out permission. Some of the charts are from Telescan, Insight Trading, First Alert and other sources.)