|
|
|
Daily - Go to TTD's Chart scroller of Breakout Stocks - Tuesday - July 19, 2022 |
|
|
|
(WMV video player download for Google) https://videoconverter.iskysoft.com/play-video/wmv-player-for-chrome.html Go to Video Show - "How to Make Money With Breakout Stocks |
|---|

By Leo Fasciocco -- TTD
Ticker Tape Digest presents its daily stock market report containing stocks to go long as Breakout Trades, Quick Trades, or Bargain Accumulation Trades.
We also feature stocks under Significant Accumulation that are poised to breakout.
|
Ticker Tape Digest's Daily schedule guide for TTD subscribers 1. Pre-market - check Breakout Watch List and Quick Trades. 2. Morning - (11:30 - 12 A.M.) - check breakout stocks tape and breakout chart slide show. 3. Midday (1 P.M.) check TTD Midsession Report and see market video show. 4. After close (4 P.M.) check final TTD Report for day. Trading Strategies Bullish Aggressive Investors Bullish - "Breakout Stocks" - ideally suited for bull markets and special situation stocks. Potential for large returns. (See Performance) Aggressive Investor Bullish- "Quick Trade Stocks" -ideally suited for entry into top performing issues looking for a small quick profit." (See Performance) Conservative Investors "Bargain Buy Trades for the Long Term." Ideally suited for entry into top performing big cap stocks on pullbacks within overall up trend.(See Performance) Bearish Aggressive Bearish Investors - "Breakdown Stocks" to Sell Short. Ideally suited for bear markets or market pull backs. Potential for large returns (See Performance) |
|---|
The TTD report also contains stocks to short as breakdown plays and as bargain (swing trade) shorts.
Investors should tend to try to go with a strategy that fits with the stock market's trend, unless there is a special situation play.
TTD's Breakout Stocks - Long are
most suitable for aggressive investors seeking ideal entry points into leading stocks, especially during bull markets. They can do extremely well in bull markets with gains of as much as several hundred percent. 
These stocks can also do extremely well during strong market rallies, or if they are in a industry group that is performing very well. They tend to have strong earnings outlooks and are near new-52 week, or all-time highs.
TTD Swing - Quick Trade Stocks - Long These are leading issues that have pulled back in recent days, but could move higher soon. They are most suitable for Aggressive Investors willing to trade short term. These stocks will do extremely well during market advances. They have about 74% win rate. During market rally sequences the win rate is even higher. The return is small 3% to 8% in just a few days.
TTD also presents Stocks To Sell or Sell Short. These issues are suitable for aggressive investors willing to take short positions both as trades or for longer-term plays. These stocks will do very well during bear markets or market pull backs.
TTD's Bearish breakdown stocks to sell short. These issues have potential to fall sharply. They often show a technical breakdown and also some fundamental business problem such as weak earnings.
TTD's multi-media updates include a slide-show that presents charts and analysis at midsession. Some times TTD presents feature analysis on stocks and the market. TTD uses Windows Media Files. (WMV).
TTD also presents a "Breakout Watch List" that is up dated daily. This list consists of key stocks in position to breakout. A close watch of this list can put you in the stock just as it breaks out. A good idea is to study the list and be ready to move into a stock quickly as it hits its breakpoint.
TTD often suggests using stop buy orders to enter. It is very important to buy a breakout stock as close as possible to the breakpoint. The idea is to get "elbow room" if the stock should follow through to the upside. This is very important in being successful in making big money with breakout stocks.
It is also essential to have a stop loss strategy for all stocks in which positions are taken. Not every stock will work as expected. It is important for investors to "police" their portfolios and avoid getting trapped in any bad positions.
Quality rating of breakout Two key factors: 1 - Stock near all-time high in price or near a 52-week high. 2 - earnings growth current year is strong. The ideal play is a stock with an Above Average Quality Rating. The stock is near a new high and will have strong earnings. TTD's other ratings are Average and Below Average.
TTD also has special feature sections on Educational Tips on Investing.
To email Mr. Leo Fasciocco leo@tickertapedigest.com.
For service, email Beverly Owen owen@tickertapedigest.com. TTDÆs Tel: 1-480-878-8381 or 480-704-3331.
Tuesday - July 19, 2021
TTD's Breakout Stocks
Stock Market Overview
Total Buy Breakout Stocks - 5
Quality of Breakouts - Above Average.
Stocks Screened - 6,500
Bull side - Small list of breakouts but some interesting plays for aggressive bulls.
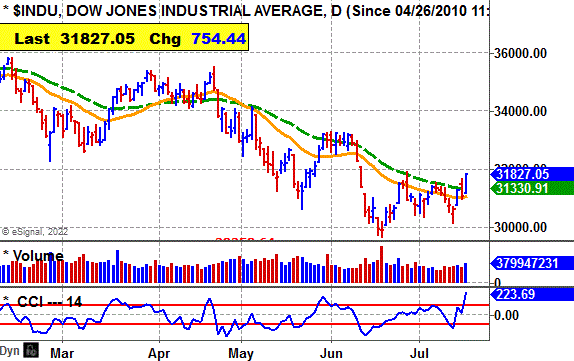
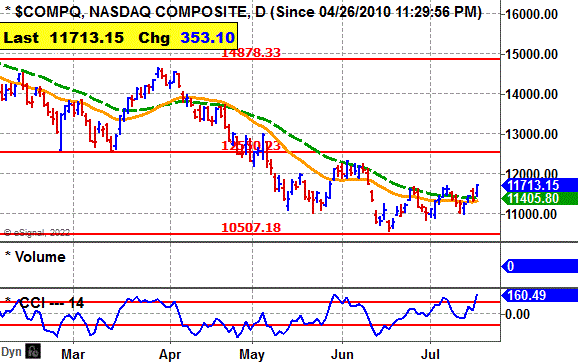
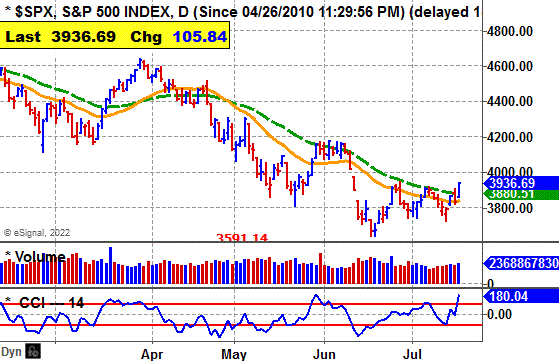
Stock market - Major averages turn bullish daily as stock market rallies.
Comment - Major averages are bullish daily indicating a near term rally in play. Bulls can be venturesome, but they need to be careful.
See Latest Earnings Reports - A company that tops the Street's highest earnings estimate has potential to go higher. Today's key earnings beats with a stock on the move higher: SI, VLVLY and NFLX
Stock Market Momentum
(Daily is based on a moving average)
|
Market (Daily) |
Market (Weekly) |
Market (Monthly) |
|
Dow - Bullish |
Dow - Bearish |
Dow - Bearish |
|
Nasdaq - Bullish |
Nasdaq - Bearish |
Nasdaq - Bearish |
|
S&P 500 - Bullish |
S&P 500 - Bearish |
S&P 500 - Bearish |
 Ticker Tape Digest's
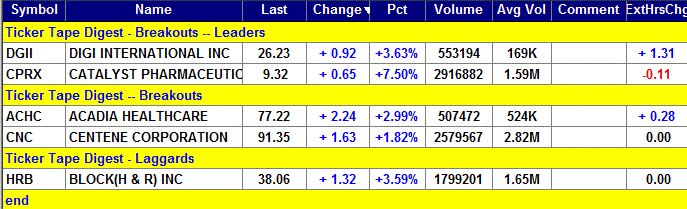
|
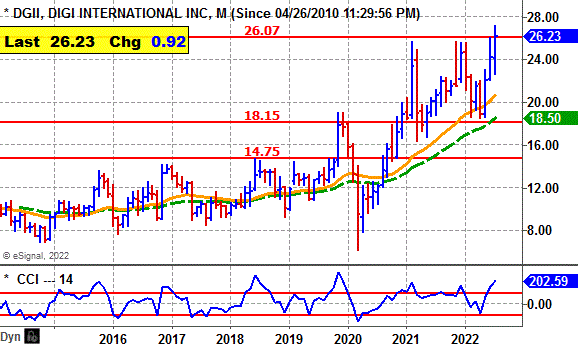
TTD's Quality Rating of Stock - DGII - Above Average |
 DGII, based in Hopkins, Min., makes internet connection products Annual revenues: $308 million. DGII's stock moves higher Tuesday and breakouts from its 8-week flat base.
The move carries the stock to a new all-time high.
So far today, DGII is trading is trading a heavy 553,199 shares, triple its average daily volume of 169,000 shares.
TTD sees more on the upside. TTD featured DGII as an accumulation in the prior report. ..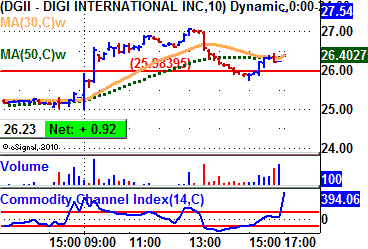
DGII's stock moved higher in the morning clearing its breakpoint.
The stock reached an intraday high of $27.09.
DGII that backed off in the afternoon. It lifted near the close.
In after-hours trading, DGII was up 7 cents a share.
Tape Action
DGII's tape action shows the recent block trades.
One can see the prices for the blocks rising from $25.31 in the prior session to as high as $27 in the afternoon.
A key bullish trade came in the morning when a block of 2,245 shares (duplicated) crossed the tape at $25.36.
That was up from the prior block at $25.31 on 16,981 shares in the prior session.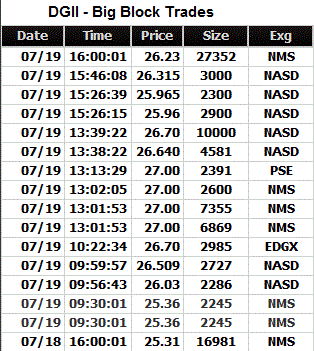
Near the close a big block of 27,352 shares crossed at $26.23.
That came on an up tick from the prior trade at $26.21 on 200 shares.
Business
DGII is a provider of Internet-of-Things (IoT) connectivity products, services and solutions.
The company's systems operate through four segments: Cellular Routers, Console Servers, OEM Solutions and Infrastructure Management.
Cellular routers provide fully enclosed box devices, which provides connectivity typically in a place where the device can be plugged in exclusively using cellular communications.
Console servers is similar except they are exclusively for edge computing installations and data center applications.
Charts
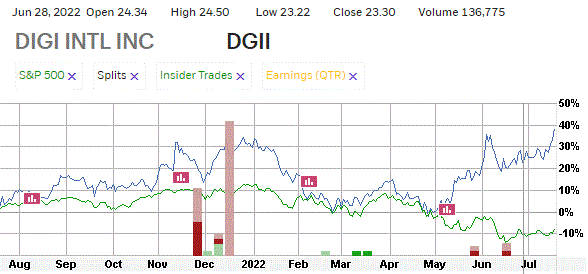
DGII's 12-month performance chart shows the stock up 38% versus a 9% loss for the stock market.
Insider were recent buyers around $19 a share. They also bought using stock options at $7.40 to $11.87 a share.
They were sellers at $22 to $24 a share. .
DGII's long-term chart shows the stock climbing from $9.28 back in 2018 to a peak at $18.99 by 2019.
The stock fell back to $6.18 in early 2020 when the stock market nosedived. However, DGII has since rallied back to $26.23..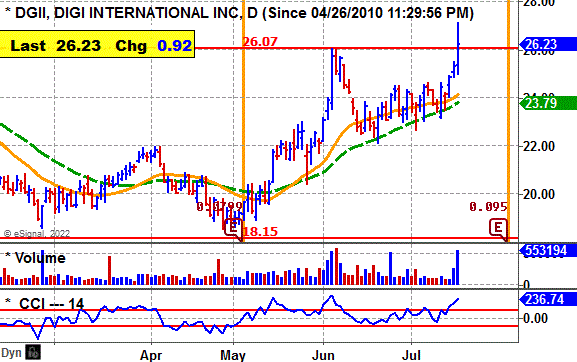
DGII's daily chart shows the stock climbing from $19 in May to a peak at $26 by June.
The stock pulled back and based.
Now, DGII breaks out strongly with a widening of the daily spread and expanding volume.
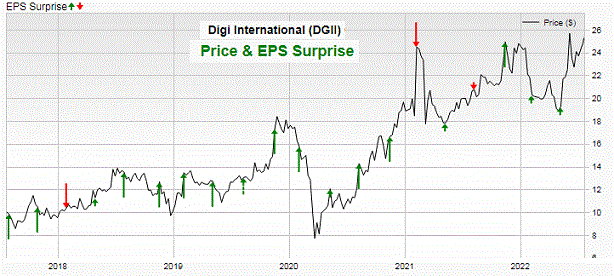
.Earnings will be reported soon.
When it reported in the prior quarter in early May, it had a big run up (see chart).
The CCI momentum indicator is strongly bullish.
Earnings Outlook
This fiscal year ending in September, analysts predict a 390% surge in net to $1.52 a share from the 31 cents the year before.
Going out to fiscal 2023, the Street predicts a more modest 15% rise in net to $1.76 a share from the anticipated $1.52 this year.
Quarterly earnings will be strong.
Net for the fiscal third quarter ending in June should jump 322% to 38 cents a share from the nine cents the year before.
The company beat the Street estimate the past three quarters by 6 cents a share, 5 cents and 5 cents..
For the fiscal fourth quarter ending in September, the Street predicts a 208% surge in net to 40 cents a share from the 13 cents the year before.
Strategy Opinion: TTD is targeting DGII for a move to $31 within the next few months after a breakout. A protective stop can be placed near $24 after a breakout.
Intermediate-Term Rating: Average.
Suitability: Aggressive Bulls.
TTD's special research of Stocks Prior Performance:
Breakout Success |
Bullish |
DGII scored modest gains off recent breakouts. |
Response to Net |
Bullish |
DGII rose 8 times after 15 earnings reports. |
Seasonal Success |
Bullish |
DGII avg. gain 4.2% in July, gain 3.9% in Aug, |
Earnings Beats |
Bullish |
DGII beat net estimates 14 time after 20 reports. |
Stock's Prior Performance After a Breakout
Stock's % Change from Breakout to peak - prior to cut below 50-day M/A. |
Date of Breakout |
Break point Price |
Stocks Price Peak after Breakout - prior to cut below 50-day M/A |
Date Trade Closed |
13% |
11/1/2021 | 22.21 | 25 | 11/11/2021 |
28% |
2/3/2021 | 19.91 | 25.41 | 2/9/2021 |
11% |
12/10/2020 | 18.15 | 20.11 | 1/26/2021 |
(In actual trading, entry and exit points could vary depending on broker execution.
Also, ideal are breakouts to a new 52-week high or better, perhaps all-time highs. Sell point can be a cut below the 50-day M/A.)
TTD's Feature Breakout Stock
|
Long- Term Chart
|
|
Stock's Price Performance after Reporting Earnings
|
|
12 - month Performance Chart vs. S&P 500
|
TTD's Breakout Stock
|
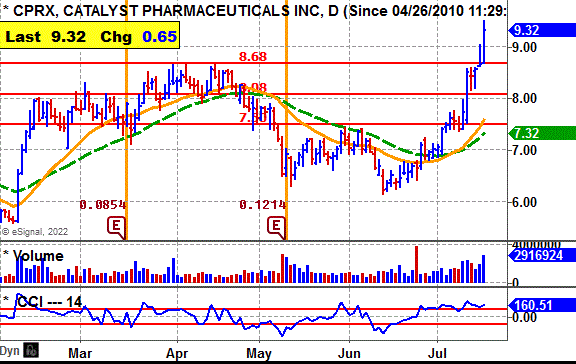
Catalyst Pharmaceuticals Inc. (CPRX) - 9.32 Net to Jump 81% This Year |
|
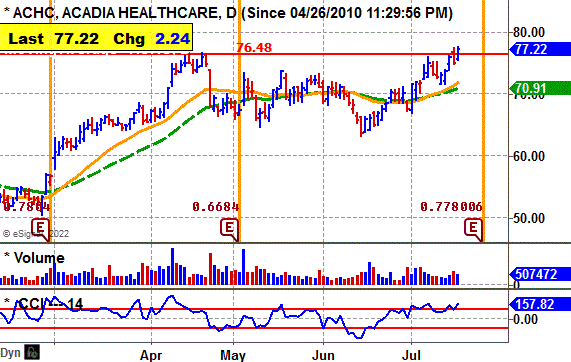
Acadia Healthcare Inc. (ACHC) - 77.22 Net to Rise 19% This Year |
|
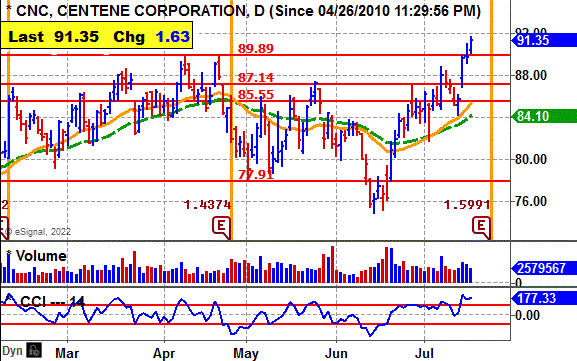
Centene Corp. (CNC) - 91.35 Net to Rise 10% This Year |
|
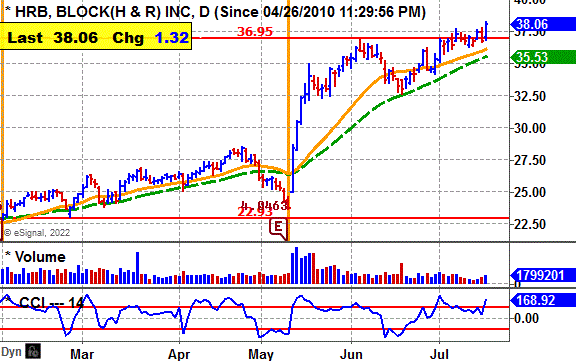
H&R Block Inc. (HRB) - 38.06 Net to Drop 13% For Fiscal 2022 (June) |
TTD's Feature Stock Under Accumulation
|
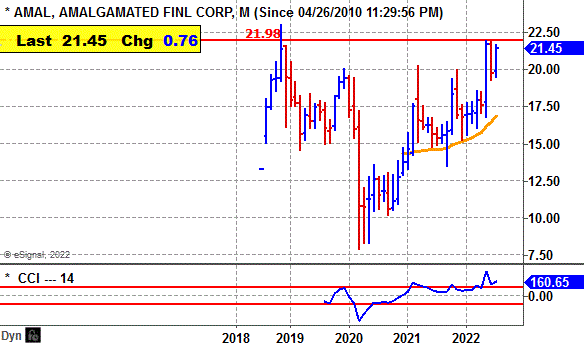
TTD's Quality Rating of Stock - AMAL - Average |
AMAL, based in New York, is a commercial bank. Annual revenues: $123 million. AMAL's stock moves higher Tuesday and is in good position to breakout from its 8-week, cup-and-handle base.
 So far today, AMAL is trading 55,425 shares. Its average daily volume is 61,300 shares.
AMAL is a conservative breakout. However, TTD sees the stock in a good spot to be accumulated in anticipation of a breakout..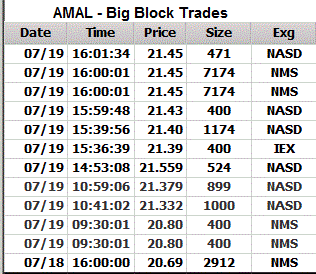
AMAL's stock moved higher during the day.
It reached an intraday peak at $21.68 in the afternoon.
The stock then trended mostly sideways the rest of the day.
Tape Action
AMALI's tape action shows the recent block trades.
One can see the prices for the blocks rising from $20.69 in the prior session to as high as $21.55 in the afternoon.
A key bullish trade came in the morning when a block of 400 shares (duplicated) crossed the tape at $20.80.
That was up from the prior block at $20.69 on 2,912 shares in the prior session.
Near the close a block of 7,174 shares (duplicated) crossed at $21.45.
That was up from the prior block at $21.43 on 400 shares.
Business
AMAL provides banking services. It handles personal banking, small business, commercial banking and institutional investing.
Its product line includes residential mortgage loans, commercial and industrial loans, commercial real estate loans and multifamily mortgages.
Charts
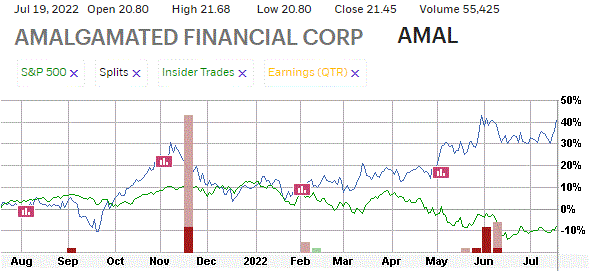
AMAL's 12-month performance chart shows the stock up 40% versus a 9% loss for the stock market.
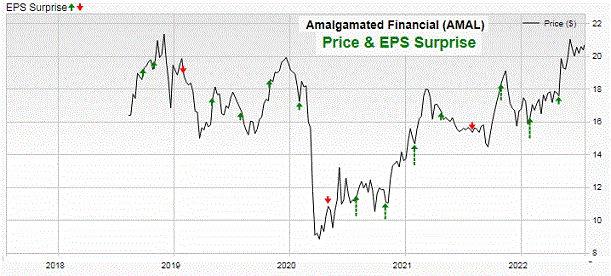
Insider were recent buyers around $17.97 a share to $13.75..
They were sellers at $21 to $19.03 a share. .
AMAL's long-term chart shows the stock falling from $22 in 2018 to $7.90 by early 2020.
Since then AMAL has surged back to $21 this year.
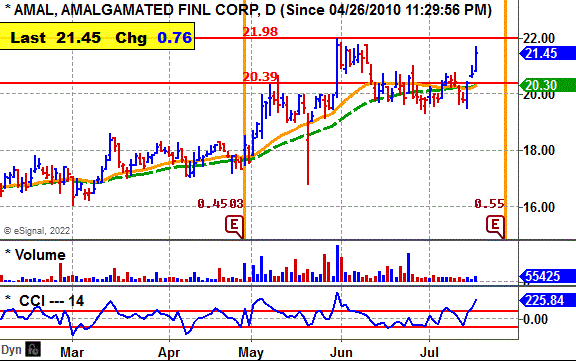 AMAL's daily chart shows the stock climbing from $16 in March to a peak at $22 by May.
The stock has since put down a well structured cup-and-handle base. .
AMAL is in range to breakout and earnings will be coming soon.
The CCI momentum indicator is strongly bullish.
Earnings Outlook
This year , analysts predict a 38% jump in net to $2.37 a share from the $1.72 the year before.
Going out to 2023, the Street predicts a more modest 16% rise in net to $2.73 a share from the anticipated $2.37 this year.
Quarterly earnings will be strong.
Net for the second quarter should leap 72% to 55 cents a share from the 32 cents the year before.
The company beat the Street estimate the past three quarters by 6 cents a share, 13 cents and 9 cents..
For the third quarter, the Street predicts a 46% surge in net to 67 cents a share from the 46 cents the year before.
Strategy Opinion: TTD suggests accumulation of AMAL in anticipation of a breakout over $22.20. TTD is targeting AMAL for a move to $27 within the next few months after a breakout. A protective stop can be placed near $20 after a breakout.
Intermediate-Term Rating: Average.
Suitability: Aggressive Bulls.
TTD's special research of Stocks Prior Performance:
Breakout Success |
Bullish |
AMAL scored good gains off recent breakouts. |
Response to Net |
Neutral |
AMAL rose 7 times after 14 earnings reports. |
Seasonal Success |
Bullish |
AMAL avg. loss 0.7% in July, gain 7.5% in Aug, |
Earnings Beats |
Bullish |
AMAL beat net estimates 9 times after 15 reports. |
Stock's Prior Performance After a Breakout
Stock's % Change from Breakout to peak - prior to cut below 50-day M/A. |
Date of Breakout |
Break point Price |
Stocks Price Peak after Breakout - prior to cut below 50-day M/A |
Date Trade Closed |
17% |
7/13/2017 | 18.61 | 21.73 | 5/31/2022 |
20% |
12/4/2020 | 12.95 | 15.60 | 1/15/2021 |
(In actual trading, entry and exit points could vary depending on broker execution.
Also, ideal are breakouts to a new 52-week high or better, perhaps all-time highs. Sell point can be a cut below the 50-day M/A.)
|
Stock's Long-term Chart
|
|
Stock's Price Performance after Reporting Earnings
|
|
Stock Performance Chart with Earnings Markers vs. S&P 500 Insider Buying in Green - Insider Selling in Red
|
TTD's Key Stocks Under Accumulation
|
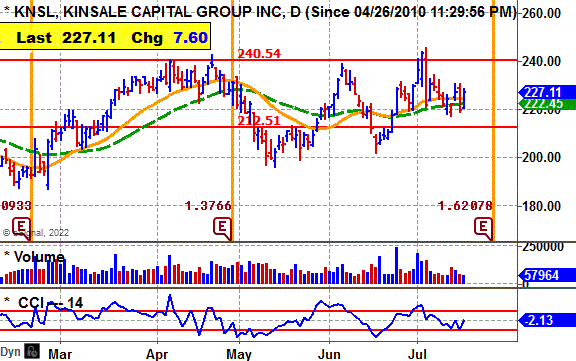
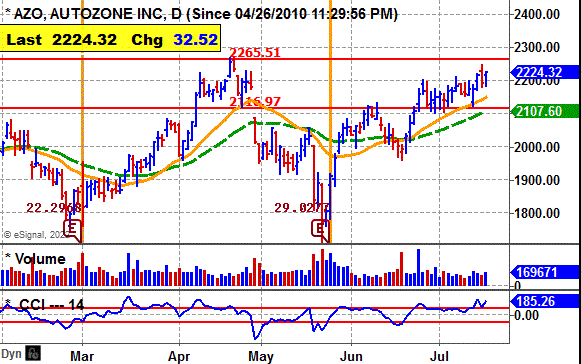
Kinsale Capital Group Inc. (KNSL) - 227.11 Set a Stop Buy at 241 to Catch the Breakout Net to Rise 20% This Year |
|
AutoZone Inc. (AZO) - 2224 Set a Stop Buy at 2266 to Catch the Breakout Net to Rise 21% For Fiscal 2022 (Aug.) |
 Ticker Tape DigestÆs
Ticker Tape DigestÆs Daily List of ōStocks To Sell or Sell Shortö ranks stocks well timed to be sold immediately based on daily trading. The list can be used as an alert to reduce current long-term positions.
Shorts from tape action - 3
Stocks Screened - 6,500
Long-Term Environment for Bears: Neutral.
Bear Side - Small list of shorts as stock market rallies strongly. Bears be patient and conservative now.
|
TTD's Quality Rating of Stock - SMPL - Below Average |
SMPL, based in Denver, sells nutritional foods and snack products. Annual revenues: $1 billion. SMPL's stock declines Tuesday and undercuts key technical support. 
So far today, SMPL is trading 1.2 million shares. Its average daily volume is 808,000 shares.
TTD sees more on the downside.
SMPL's stock fell in the morning. The stock cut below key technical support in the afternoon.
The stock continued lower into the final hour. 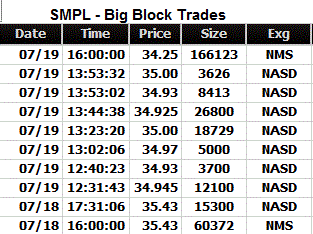
In after-hours trading, SMPL was up 25 cents a share.
Tape Action
SMPL's tape action shows the recent block trades.
One can see the price for the blocks falling from $30.27 in the morning to as low as $29.02 near the close.
A key bearish trade came in the morning when a block of 150 shares crossed the tape at $29.91.
That was down from the prior block at $30.27 on 234 shares..
Business
SMPL sells nutritional foods and snacking products. The companyÆs product portfolio consists primarily of nutrition bars, ready-to-drink shakes, snacks and confectionery products.
It offers its products under various brands, such as Atkins, Quest and Atkins Endulge brand. It offers two types of nutrition bars: Atkins Meal Bars and Atkins Snack Bars.
Its Atkins RTD shakes contain 10 to 15 grams of protein. Its shakes are available in a variety of flavors, including cookies and creme, cafe caramel and creamy chocolate.
Charts
SMPL's daily chart shows the stock declining from $450 in April down to $35 by July..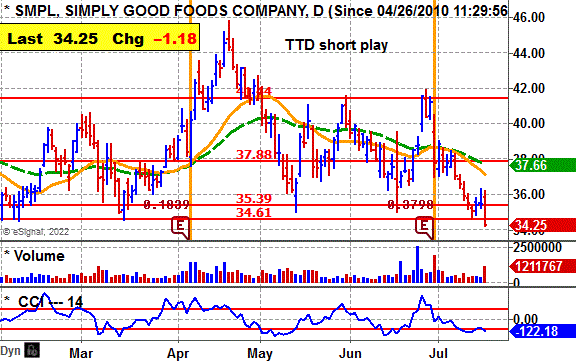
The stock tried to rally but now breaks to the downside with a pick up in volume.
The stock had a prior sharp drop when it reported its recent earnings.
The CCI momentum indicator is bearish.
Earnings:
This fiscal year ending in August, analysts predict an 18% rise in net to $1.49 a share from the $1.26 the prior year.
Net for the upcoming fiscal fourth quarter ending in August should be flat at 29 cents a share.
Going out to fiscal 2023 ending in August,, the Street predicts a 10% rise net to $1.64 a share from the anticipated $1.49 this fiscal year.
For the fiscal first quarter ending in November, the Street expects a 5% drop in net to 41 cents a share from the 43 cents the year before.
Strategy Opinion: TTD is targeting SMPL for a decline to $27 within the next few months or sooner.
A protective stop buy can be placed near $36.50.
Suitability: Aggressive Bears.
TTD's Stock Probability research of Prior Performance:
|
Response to Net |
Bullish |
SMPL rose 10 times after 15 earnings reports. |
|
Seasonal Success |
Bullish |
SMPL avg. gain 10.3% in July, gain 3.8% in Aug.. |
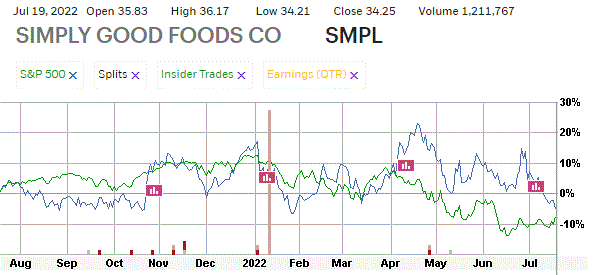
Stock's Performance Chart with Quarterly Earnings Markers vs. S&P 500
Insider Buying in Green - Insider Selling in Red
Guide: Symbol=Ticker, Name=Corporate name, Entry is the buy price to enter on the breakout, Last=prior close, Change=change from last close to prior, Date=date of price of close etc, Gain in blue is price above breakpoint (entry), Gain in red is price below breakpoint (entry)., % Gain in blue is % over breakpoint (entry), Gain in red is % below breakpoint (entry)
Copyright --- Ticker Tape Digest - 2022
TTD columnist Leo Fasciocco has covered the stock market for over 30 years. His articles appear in many publications. He has also been a speaker at the Money Show conferences. He has been on television and radio. He is author of many educational articles about stock investing and the book ōGuide To High-Performance Investing.ö

For information to subscribe to the Ticker Tape Digest Services call: Beverly Owen at 1-480-704-3331 or 480-878-8381
Distributed by Corona Publishing Enterprises. Ticker Tape Digest Inc. 1220 W. Sherri, Gilbert, Az. 85233.
TTD ōProfessional Reportö is available on the Web: $100 per month. Password needed. Published daily - around 20 times a month.
TTD Pro Report includes a Morning chart slide show of breakout stocks, a Midsession video-audio show with commentary on breakout stocks and shorts and a Final end of day overall report on breakout stocks for the session, short plays and accumulation plays. There are other features too such as Quick Trades and Long-term Plays.
TTD Daily Report is $39. It covers a Morning slide show of charts of stocks breaking out and a TTD end of day print report covering breakout stocks and shorts.
Credit cards accepted. Payable to Corona Publishing Enterprises.
(The information contained has been prepared from data deemed reliable but there is no guarantee of complete accuracy. Ticker Tape Digest Inc. is not affiliated with any broker, dealer or investment advisor. Nothing in this publication constitutes an offer, recommendation or solicitation to buy or sell any securities. Further research is advised. This report is copyrighted and no redistribution is permitted with out permission.)