|
|
|
Daily - Go to TTD's Chart scroller of Breakout Stocks - Friday - July 22, 2022 |
|
|
|
(WMV video player download for Google) https://videoconverter.iskysoft.com/play-video/wmv-player-for-chrome.html Go to Video Show - "How to Make Money With Breakout Stocks |
|---|

By Leo Fasciocco -- TTD
Ticker Tape Digest presents its daily stock market report containing stocks to go long as Breakout Trades, Quick Trades, or Bargain Accumulation Trades.
We also feature stocks under Significant Accumulation that are poised to breakout.
|
Ticker Tape Digest's Daily schedule guide for TTD subscribers 1. Pre-market - check Breakout Watch List and Quick Trades. 2. Morning - (11:30 - 12 A.M.) - check breakout stocks tape and breakout chart slide show. 3. Midday (1 P.M.) check TTD Midsession Report and see market video show. 4. After close (4 P.M.) check final TTD Report for day. Trading Strategies Bullish Aggressive Investors Bullish - "Breakout Stocks" - ideally suited for bull markets and special situation stocks. Potential for large returns. (See Performance) Aggressive Investor Bullish- "Quick Trade Stocks" -ideally suited for entry into top performing issues looking for a small quick profit." (See Performance) Conservative Investors "Bargain Buy Trades for the Long Term." Ideally suited for entry into top performing big cap stocks on pullbacks within overall up trend.(See Performance) Bearish Aggressive Bearish Investors - "Breakdown Stocks" to Sell Short. Ideally suited for bear markets or market pull backs. Potential for large returns (See Performance) |
|---|
The TTD report also contains stocks to short as breakdown plays and as bargain (swing trade) shorts.
Investors should tend to try to go with a strategy that fits with the stock market's trend, unless there is a special situation play.
TTD's Breakout Stocks - Long are
most suitable for aggressive investors seeking ideal entry points into leading stocks, especially during bull markets. They can do extremely well in bull markets with gains of as much as several hundred percent. 
These stocks can also do extremely well during strong market rallies, or if they are in a industry group that is performing very well. They tend to have strong earnings outlooks and are near new-52 week, or all-time highs.
TTD Swing - Quick Trade Stocks - Long These are leading issues that have pulled back in recent days, but could move higher soon. They are most suitable for Aggressive Investors willing to trade short term. These stocks will do extremely well during market advances. They have about 74% win rate. During market rally sequences the win rate is even higher. The return is small 3% to 8% in just a few days.
TTD also presents Stocks To Sell or Sell Short. These issues are suitable for aggressive investors willing to take short positions both as trades or for longer-term plays. These stocks will do very well during bear markets or market pull backs.
TTD's Bearish breakdown stocks to sell short. These issues have potential to fall sharply. They often show a technical breakdown and also some fundamental business problem such as weak earnings.
TTD's multi-media updates include a slide-show that presents charts and analysis at midsession. Some times TTD presents feature analysis on stocks and the market. TTD uses Windows Media Files. (WMV).
TTD also presents a "Breakout Watch List" that is up dated daily. This list consists of key stocks in position to breakout. A close watch of this list can put you in the stock just as it breaks out. A good idea is to study the list and be ready to move into a stock quickly as it hits its breakpoint.
TTD often suggests using stop buy orders to enter. It is very important to buy a breakout stock as close as possible to the breakpoint. The idea is to get "elbow room" if the stock should follow through to the upside. This is very important in being successful in making big money with breakout stocks.
It is also essential to have a stop loss strategy for all stocks in which positions are taken. Not every stock will work as expected. It is important for investors to "police" their portfolios and avoid getting trapped in any bad positions.
Quality rating of breakout Two key factors: 1 - Stock near all-time high in price or near a 52-week high. 2 - earnings growth current year is strong. The ideal play is a stock with an Above Average Quality Rating. The stock is near a new high and will have strong earnings. TTD's other ratings are Average and Below Average.
TTD also has special feature sections on Educational Tips on Investing.
To email Mr. Leo Fasciocco leo@tickertapedigest.com.
For service, email Beverly Owen owen@tickertapedigest.com. TTDÆs Tel: 1-480-878-8381 or 480-704-3331.
Friday - July 22, 2021
TTD's Breakout Stocks
Stock Market Overview
Total Buy Breakout Stocks - 3
Quality of Breakouts - Below Average.
Stocks Screened - 6,500
Bull side - Small list of breakout stocks as stock market falls sharply.
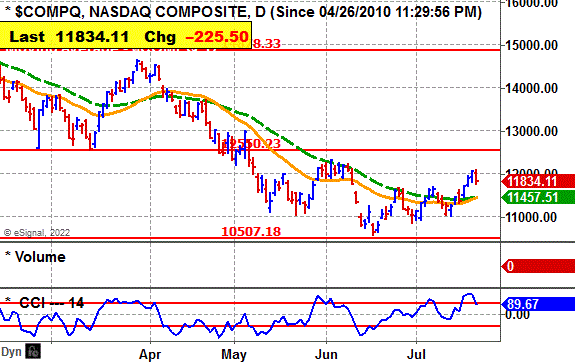
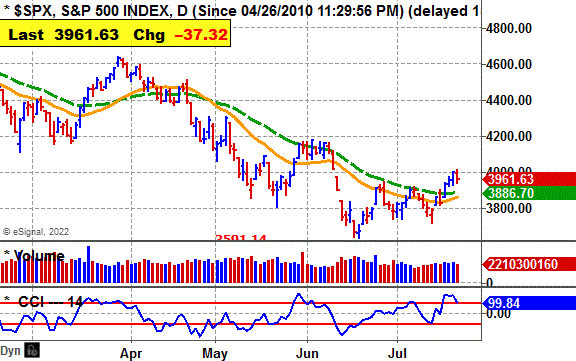
Stock market - Major averages hold bullish daily. However, they are bearish weekly and monthly. So, we a seeing a rally in a bear market.
Comment - Earnings to pour in during the next several weeks. One needs to be very alert. A key bullish play would be a company that beats the highest estimate on the Street.
See Latest Earnings Reports - A company that tops the Street's highest earnings estimate has potential to go higher. Today's key earnings beats with a stock on the move higher: HCA, NEP, SLB, AXP and NEE.
Stock Market Momentum
(Daily is based on a moving average)
|
Market (Daily) |
Market (Weekly) |
Market (Monthly) |
|
Dow - Bullish |
Dow - Bearish |
Dow - Bearish |
|
Nasdaq - Bullish |
Nasdaq - Bearish |
Nasdaq - Bearish |
|
S&P 500 - Bullish |
S&P 500 - Bearish |
S&P 500 - Bearish |
 Ticker Tape Digest's
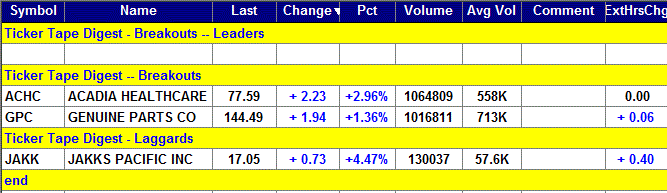
|
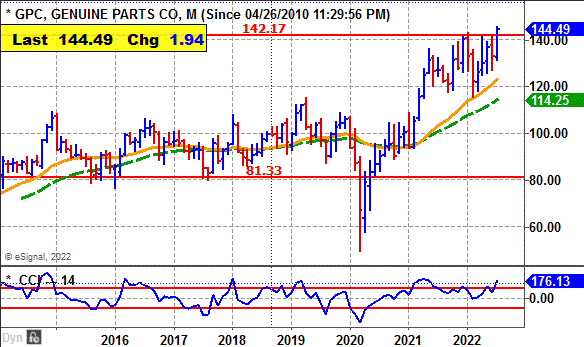
TTD's Quality Rating of Stock - GPC - Average |
GPC, based in Atlanta, Ga., sells auto and industrial replacement parts. Annual revenues: $18.9 billion. GPC's stock moves higher Friday and clears its seven-week, cup-and-handle base. 
So far today, GPC is trading 1 million shares. Its average daily volume is 713,00 shares.
TTD sees potential for more on the upside.
GPC's stock moved higher in the morning and cleared its base.
The stock reached an intraday high in the morning at $145.26.
The stock pulled back slightly and trended sideways the rest of the day.
In after-hours trading the stock was up 25 cents a share. 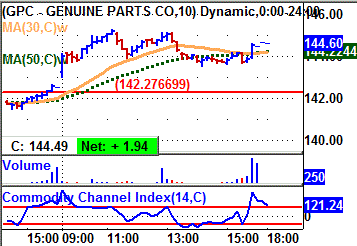
Tape Action
GPC's tape action shows the recent block trades.
One can see the prices for the blocks rising from $142.55 in the prior session to as high as $145.03 around noon.
A key bullish trade came in the morning when a block of 3,383 shares crossed the tape at $143.26.
That was up from the prior block at $142.55 on 67,759 shares in the prior session.
Late in the day a block of 83,039 shares crossed at $144.49..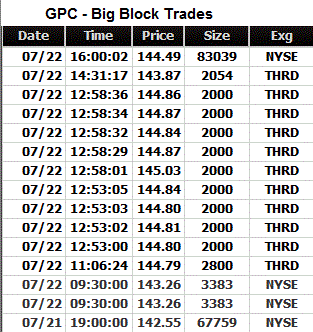
That was up from the prior block in the sequence at $143.87 on 2,054 shares.
Business
GPC sells auto and industrial replacement parts and materials.
The auto parts group sells parts and service items in North America, Europe, and Australia and Asia.
it sells under the National Automotive Parts Association brand name through distribution centers and auto parts stores. The Industrial Parts Group operates in both North America and Australia and Asia.
Charts
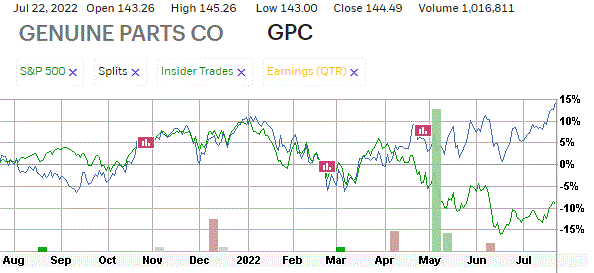
GPC's 12-month performance chart shows the stock up 13% versus a 9% loss for the stock market.
Insider were recent buyers at $99.72 to $124. in the open market.
They have not done any selling recently.
GPC's long-term chart shows the stock climbing from $80 back in 2017 to a peak at $115 by 2019.
However, the stock tumbled down to 50 in early 2020 when the stock market fell. .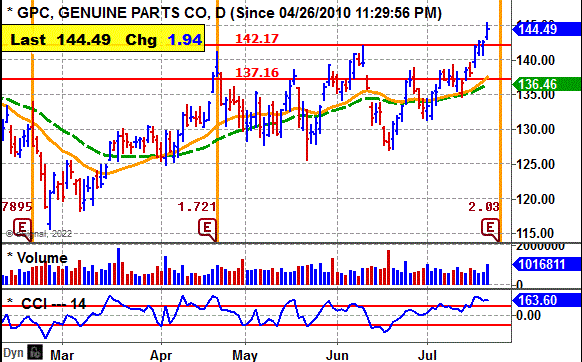
Since then, GPC has rallied back strongly to $142.
GPC's daily chart shows the stock climbing from $116 in February to a peak near $142 by June.
The stock pulled back and then based with a cup-and handle setup
GPC now breaks out with a good pickup in volume.
GPC will report earnings soon.
The CCI momentum indicator is strongly bullish.
Earnings Outlook
Net for the upcoming second quarter should rise 16% to $2.02 a share from the $1.74 the prior year.
The highest estimate is at $2.19 a share from six analysts.
The company beat the Street estimate the past four quarters by 16 cents a share, 18 cents, 24 cents and 16 cents.
Net for the third quarter should be up 10% to $2.06 a share from the $1.88 the prior year.
For the year. analysts predict a 13% rise in net to $7.84 a share from the $6.91 the year before.
Going out to 2023, the Street projects a 6% increase in net to $8.30 a share from the anticipated $7.84 this year.
Strategy Opinion: TTD is targeting GPC for a move to $170 within the next few months. A protective stop can be placed near $139.
Intermediate-Term Rating: Average.
Suitability: Aggressive Bulls.
TTD's special research of Stocks Prior Performance:
Breakout Success |
Bullish |
GPC scored modest gains off recent breakouts. |
Response to Net |
Bullish |
GPC rose 10 times after 15 earnings reports. |
Earnings Beats |
Bullish |
GPC beat net estimates 13 times after 20 report. |
Seasonal Success |
Bullish |
GPC avg. gain 2.5% in July, loss 0.8% in Aug, |
Stock's Prior Performance After a Breakout
Stock's % Change from Breakout to peak - prior to cut below 50-day M/A. |
Date of Breakout |
Break point Price |
Stocks Price Peak after Breakout - prior to cut below 50-day M/A |
Date Trade Closed |
13% |
4/16/2021 | 118.71 | 133.60 | 5/10/2021 |
29% |
2/22/2021 | 103.73 | 133.60 | 5/10/2021 |
9% |
2/13/2019 | 105.96 | 115.14 | 4/5/2019 |
(In actual trading, entry and exit points could vary depending on broker execution.
Also, ideal are breakouts to a new 52-week high or better, perhaps all-time highs. Sell point can be a cut below the 50-day M/A.)
TTD's Feature Breakout Stock
|
Long- Term Chart
|
|
Stock's Price Performance after Reporting Earnings
|
|
12 - month Performance Chart vs. S&P 500
|
TTD's Breakout Stock
|
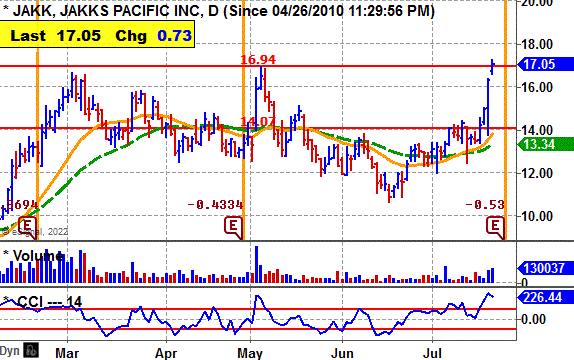
Jakks Pacific Inc. (JAKK) - 17.05 Net to be Rise 8% This Year |
|
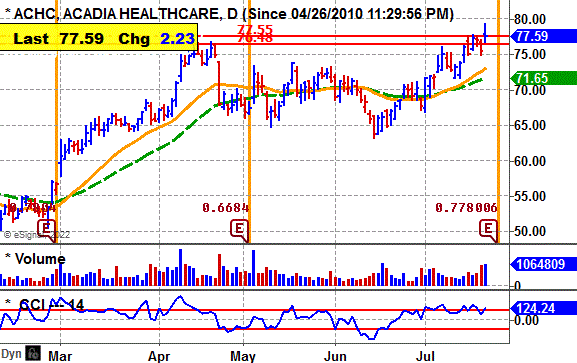
Acadia Healthcare Co. (ACHC) - 77.59 Net to Rise 19% This Year |
TTD's Feature Stock Under Accumulation
|
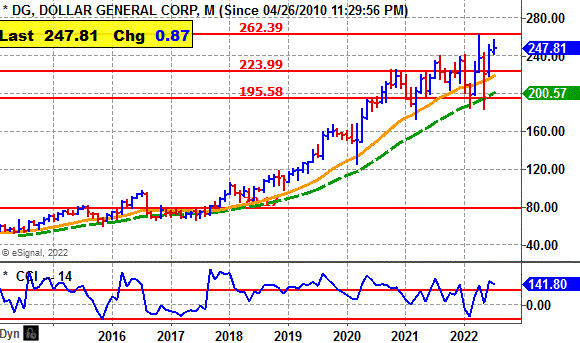
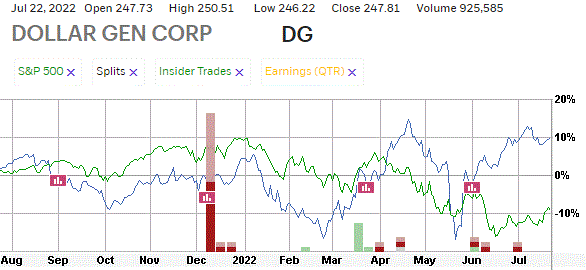
TTD's Quality Rating of Stock - DG - Average |
DG, based in Goodlettsville, Ten., operates general merchandise stores selling products at discount prices. Annual revenues: $34.2 billion. DG's stock moves higher Friday. It is now in position to breakout from its 14-week, cup-and-handle base. 
So far today, DG is trading 925,618 shares. Its average daily volume is 1.6 million shares.
TTD's stock is in a good position to be accumulated in anticipation of breakout.
DG's stock rose in the morning to an intraday high of $250.51.
The stock then drifted back to $246 in the afternoon. 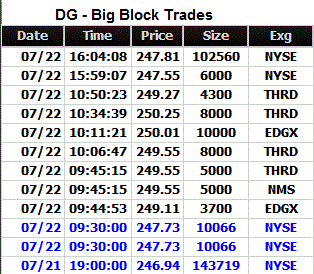
It lifted slightly near the close.
In after-hours trading, DG was up 28 cents a share.
Tape Action
DG's tape action shows the recent block trades.
One can see the prices for DG's blocks rising from $246.94 in the prior session to as high as $250.24 later in the morning.
A key bullish trade in the morning when a block of 10,066 shares crossed the tape at $247.73. That was up from the prior block at $246.94 on 143,719 shares in the prior session.
Near the close a big block of 102,560 shares crossed at $247.81.
That was up from the prior block at $247.55 on 6,000 shares.
Business
DG operates discount stores selling a variety household and reduction products.
The company sells consumable items, home products and apparel. Its merchandise includes brands from manufacturers, as well as its own private brands.
Its consumables category includes paper and cleaning products, packaged food, perishables, snacks, health and beauty, pet, and tobacco products.
Its seasonal products include holiday items, toys, batteries, small electronics, greeting cards, stationery, prepaid phones, gardening supplies, hardware, automotive and home office supplies.
Charts
DG's 12-month performance chart shows the stock up 10% versus a 9% loss for the stock market.
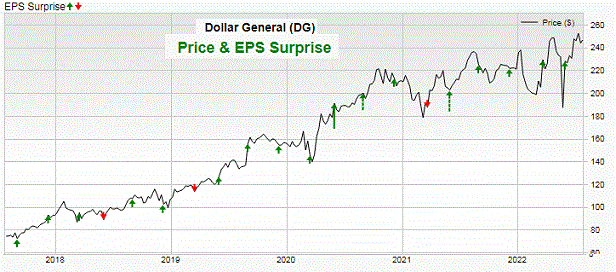
Insider were recent buyers at $53.50 to $84.67 a share using stock options.
They were sellers at $220 to $247 a share.
DG's long-term chart shows the stock rising from $68 in 2017 to 167 by early 2020.
DG pulled back to $125 in early 2020. Then the stock turned and rallied strongly to $247. .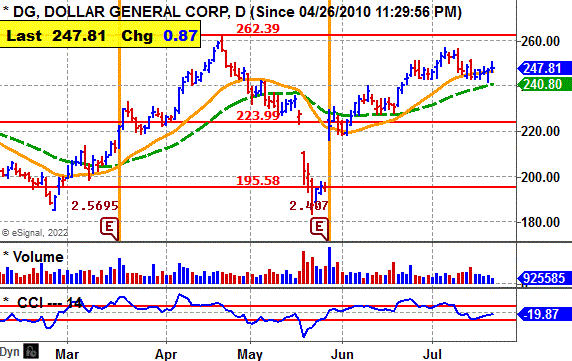
DG's daily chart shows the stock climbing from $190 in February to a peak at $262 by April.
The stock pulled back and then rallied to form a cup-and-handle base.
It is now in position to breakout if it can put together a good rally.
The CCI momentum indicator is working higher. .
Earnings Outlook
This fiscal year ending in January 2023, analysts project a 13% rise in net to $11.49 a share from the $10.17 the year before.
Going out to 2023, the Street expects a 9% rise in net to $12.53 a share from the anticipated $11.49 this year..
Net for the fiscal second quarter ending in July should be up jump 8% to $2.90 a share from the $2.69 the year before.
The company beat the Street estimate the past four quarters by 9 cents a share, one cent, 6 cents and 10 cents...
For the fiscal third quarter ending in Oct., the Street expects a 23% spurt in net to $2.56 a share from the $2.08 the year before.
Strategy Opinion: TTD suggests accumulation in DG in anticipation of a breakout over $262.7.
TTD is targeting DG for a move to $290 within the next few months after a breakout. A protective stop can be placed near $240 after a breakout.
Intermediate-Term Rating: Average.
Suitability: Conservative Bulls.
TTD's special research of Stocks Prior Performance:
Breakout Success |
Bullish |
DG scored small gains off recent breakouts. |
Response to Net |
Bullish |
DG rose 10 times after 15 earnings reports. |
Earnings Beats |
Bullish |
DG beat net estimates 15 times after 20 reports. |
Seasonal Success |
Bullish |
DG avg. gain 1.7% in July, gain 7% in Aug, |
Stock's Prior Performance After a Breakout
Stock's % Change from Breakout to peak - prior to cut below 50-day M/A. |
Date of Breakout |
Break point Price |
Stocks Price Peak after Breakout - prior to cut below 50-day M/A |
Date Trade Closed |
3% |
12/29/2021 | 230.22 | 238.27 | 1/7/2022 |
6% |
7/19/2021 | 224.27 | 238.22 | 8/10/2021 |
14% |
4/7/2020 | 167.36 | 191.50 | 6/1/2020 |
(In actual trading, entry and exit points could vary depending on broker execution.
Also, ideal are breakouts to a new 52-week high or better, perhaps all-time highs. Sell point can be a cut below the 50-day M/A.)
|
Stock's Long-term Chart
|
|
Stock's Price Performance after Reporting Earnings
|
|
Stock Performance Chart with Earnings Markers vs. S&P 500 Insider Buying in Green - Insider Selling in Red
|
TTD's Key Stocks Under Accumulation
|
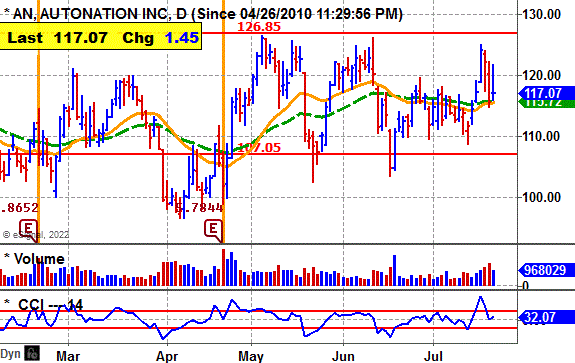
AutoNation Inc. (AN) - 117.07 Set a Stop Buy at 127.10 to Catch the Breakout Net to Spurt 28% This Year
|
|
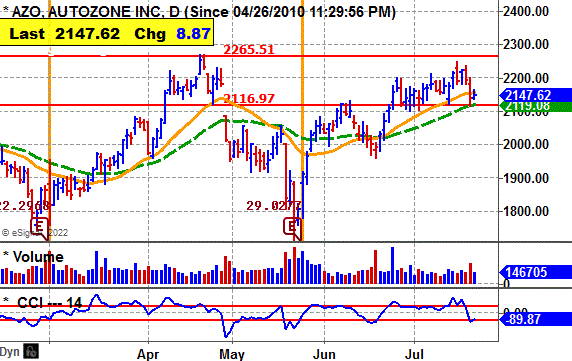
Autozone Inc. (AZO) - 2147.62 Set a Stop Buy at 2266 to Catch the Breakout Net to Rise 21% This Fiscal Year (Aug.) |
 Ticker Tape DigestÆs
Ticker Tape DigestÆs Daily List of ōStocks To Sell or Sell Shortö ranks stocks well timed to be sold immediately based on daily trading. The list can be used as an alert to reduce current long-term positions.
Shorts from tape action - 10
Stocks Screened - 6,500
Long-Term Environment for Bears: Favorable.
Bear Side - Large list of shorts Friday as the stock market declines sharply. Stocks with negative earnings news vulnerable now.
|
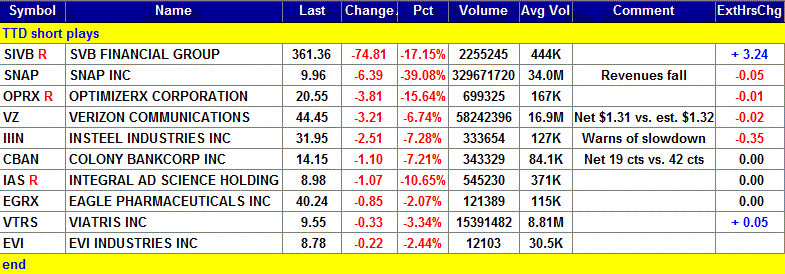
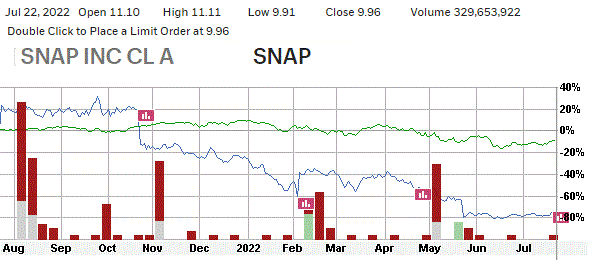
TTD's Quality Rating of Stock - SNAP - Below Average |
SNAP, based in Santa Monica, Ca., produces the product Snapchat, an internet communication product. Annual revenues: $4.1 billion. SNAP's stock gaps lower Friday and undercuts key technical support. 
The company said it is have a sharp decline in advertising.
So far today, SNAP Is trading a heavy 331 million shares, nine times its average daily volume of 34 million shares. 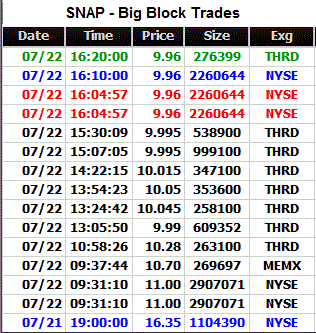
TTD sees more on the downside.
TTD highlighted SNAP as a short at our midsession video show on the Web Friday.
SNAP's stock fell in the morning and undercut key technical support
The stock drifted lower in the morning and then in the afternoon moved sideways.
SNAP was down 7 cents a share in after-hours trading.
Tape Action
TTDS's tape action shows the recent block trades.
One can see the price for the blocks falling from $15.53 in the morning to as low as $14.67 around noon.
A key bearish trade came in the morning when a block of 3,250 shares crossed the tape at $15.16.
That was down from the prior block at $15.53 on 12,223 shares.
Near the close a big block of 96,968 shares crossed at $14.88.
That was up from the prior block at $14.87 on 2,127 shares.
Business
SNAP's key product, Snapchat, is a camera application that helps people communicate visually with friends and family through short videos and images called Snaps.
Snapchat is its core mobile device application and contains five tabs. Its tabs include: Camera, communication, snap map, stories and spotlight.
Snap map is a live and personalized map that allows Snapchatters to connect with friends and explore what is going on in their local area.
Charts
SNAP's daily chart shows the stock declining from $40 in April down to $12 by May..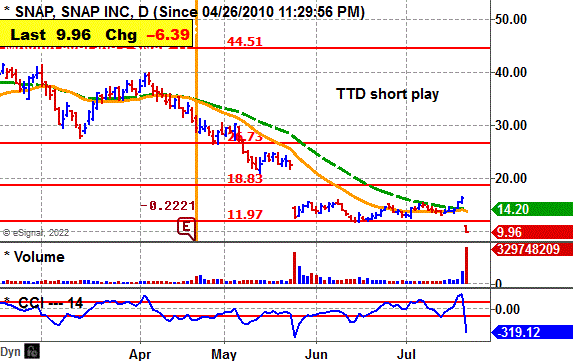
The stock tried to form a bottom and then rally.
However, SNAP now gaps lower with big volume.
The CCI momentum indicator is bearish.
Earnings:
This year analysts predict a 74% drop in net to 13 cents a share from the 50 cents the year before.
For the upcoming third quarter analysts expect an 82% drop in net to 3 cents as hare from 17 cents the prior year.
Then in the fourth quarter they see a 32% decline in net to 15 cents a share from the 22 cents the year before.
For 2023, the Street projects a rebound in net to 50 cents a share from the anticipated 13 cents this year.
Strategy Opinion: TTD is targeting SNAP for a decline to $7.80 within the next few months or sooner.
A protective stop buy can be placed near $11.
Suitability: Aggressive Bears.
TTD's Stock Probability research of Prior Performance:
|
Response to Net |
Bullish |
SNAP rose 8 times after 15 earnings reports. |
|
Seasonal Success |
Bearish |
SNAP avg. loss 1.3% in July, loss 3.9% in Aug.. |
Stock's Performance Chart with Quarterly Earnings Markers vs. S&P 500
Insider Buying in Green - Insider Selling in Red
Guide: Symbol=Ticker, Name=Corporate name, Entry is the buy price to enter on the breakout, Last=prior close, Change=change from last close to prior, Date=date of price of close etc, Gain in blue is price above breakpoint (entry), Gain in red is price below breakpoint (entry)., % Gain in blue is % over breakpoint (entry), Gain in red is % below breakpoint (entry)
Copyright --- Ticker Tape Digest - 2022
TTD columnist Leo Fasciocco has covered the stock market for over 30 years. His articles appear in many publications. He has also been a speaker at the Money Show conferences. He has been on television and radio. He is author of many educational articles about stock investing and the book ōGuide To High-Performance Investing.ö

For information to subscribe to the Ticker Tape Digest Services call: Beverly Owen at 1-480-704-3331 or 480-878-8381
Distributed by Corona Publishing Enterprises. Ticker Tape Digest Inc. 1220 W. Sherri, Gilbert, Az. 85233.
TTD ōProfessional Reportö is available on the Web: $100 per month. Password needed. Published daily - around 20 times a month.
TTD Pro Report includes a Morning chart slide show of breakout stocks, a Midsession video-audio show with commentary on breakout stocks and shorts and a Final end of day overall report on breakout stocks for the session, short plays and accumulation plays. There are other features too such as Quick Trades and Long-term Plays.
TTD Daily Report is $39. It covers a Morning slide show of charts of stocks breaking out and a TTD end of day print report covering breakout stocks and shorts.
Credit cards accepted. Payable to Corona Publishing Enterprises.
(The information contained has been prepared from data deemed reliable but there is no guarantee of complete accuracy. Ticker Tape Digest Inc. is not affiliated with any broker, dealer or investment advisor. Nothing in this publication constitutes an offer, recommendation or solicitation to buy or sell any securities. Further research is advised. This report is copyrighted and no redistribution is permitted with out permission.)