|
|
|
Daily - Go to TTD's Chart scroller of Breakout Stocks - Friday - July 29, 2022 |
|
|
|
(WMV video player download for Google) https://videoconverter.iskysoft.com/play-video/wmv-player-for-chrome.html Go to Video Show - "How to Make Money With Breakout Stocks |
|---|

By Leo Fasciocco -- TTD
Ticker Tape Digest presents its daily stock market report containing stocks to go long as Breakout Trades, Quick Trades, or Bargain Accumulation Trades.
We also feature stocks under Significant Accumulation that are poised to breakout.
|
Ticker Tape Digest's Daily schedule guide for TTD subscribers 1. Pre-market - check Breakout Watch List and Quick Trades. 2. Morning - (11:30 - 12 A.M.) - check breakout stocks tape and breakout chart slide show. 3. Midday (1 P.M.) check TTD Midsession Report and see market video show. 4. After close (4 P.M.) check final TTD Report for day. Trading Strategies Bullish Aggressive Investors Bullish - "Breakout Stocks" - ideally suited for bull markets and special situation stocks. Potential for large returns. (See Performance) Aggressive Investor Bullish- "Quick Trade Stocks" -ideally suited for entry into top performing issues looking for a small quick profit." (See Performance) Conservative Investors "Bargain Buy Trades for the Long Term." Ideally suited for entry into top performing big cap stocks on pullbacks within overall up trend.(See Performance) Bearish Aggressive Bearish Investors - "Breakdown Stocks" to Sell Short. Ideally suited for bear markets or market pull backs. Potential for large returns (See Performance) |
|---|
The TTD report also contains stocks to short as breakdown plays and as bargain (swing trade) shorts.
Investors should tend to try to go with a strategy that fits with the stock market's trend, unless there is a special situation play.
TTD's Breakout Stocks - Long are
most suitable for aggressive investors seeking ideal entry points into leading stocks, especially during bull markets. They can do extremely well in bull markets with gains of as much as several hundred percent. 
These stocks can also do extremely well during strong market rallies, or if they are in a industry group that is performing very well. They tend to have strong earnings outlooks and are near new-52 week, or all-time highs.
TTD Swing - Quick Trade Stocks - Long These are leading issues that have pulled back in recent days, but could move higher soon. They are most suitable for Aggressive Investors willing to trade short term. These stocks will do extremely well during market advances. They have about 74% win rate. During market rally sequences the win rate is even higher. The return is small 3% to 8% in just a few days.
TTD also presents Stocks To Sell or Sell Short. These issues are suitable for aggressive investors willing to take short positions both as trades or for longer-term plays. These stocks will do very well during bear markets or market pull backs.
TTD's Bearish breakdown stocks to sell short. These issues have potential to fall sharply. They often show a technical breakdown and also some fundamental business problem such as weak earnings.
TTD's multi-media updates include a slide-show that presents charts and analysis at midsession. Some times TTD presents feature analysis on stocks and the market. TTD uses Windows Media Files. (WMV).
TTD also presents a "Breakout Watch List" that is up dated daily. This list consists of key stocks in position to breakout. A close watch of this list can put you in the stock just as it breaks out. A good idea is to study the list and be ready to move into a stock quickly as it hits its breakpoint.
TTD often suggests using stop buy orders to enter. It is very important to buy a breakout stock as close as possible to the breakpoint. The idea is to get "elbow room" if the stock should follow through to the upside. This is very important in being successful in making big money with breakout stocks.
It is also essential to have a stop loss strategy for all stocks in which positions are taken. Not every stock will work as expected. It is important for investors to "police" their portfolios and avoid getting trapped in any bad positions.
Quality rating of breakout Two key factors: 1 - Stock near all-time high in price or near a 52-week high. 2 - earnings growth current year is strong. The ideal play is a stock with an Above Average Quality Rating. The stock is near a new high and will have strong earnings. TTD's other ratings are Average and Below Average.
TTD also has special feature sections on Educational Tips on Investing.
To email Mr. Leo Fasciocco leo@tickertapedigest.com.
For service, email Beverly Owen owen@tickertapedigest.com. TTD’s Tel: 1-480-878-8381 or 480-704-3331.
Friday - July 29, 2021
TTD's Breakout Stocks
Stock Market Overview
Total Buy Breakout Stocks - 5
Quality of Breakouts - Above Average.
Stocks Screened - 6,500
Bull side - Small list of breakouts but some interesting plays for aggressive bulls.
Stock market - Stocks now in a rally within a bear market. The run has been good so far.
Comment - Key now will be the flow of earnings and forecasts. Bulls remain alert.
See Latest Earnings Reports - A company that tops the Street's highest earnings estimate has potential to go higher. Today's key earnings beats with a stock on the move higher: SLCA, CVX, GTLS,GHM and GWW.
Stock Market Momentum
(Daily is based on a moving average)
|
Market (Daily) |
Market (Weekly) |
Market (Monthly) |
|
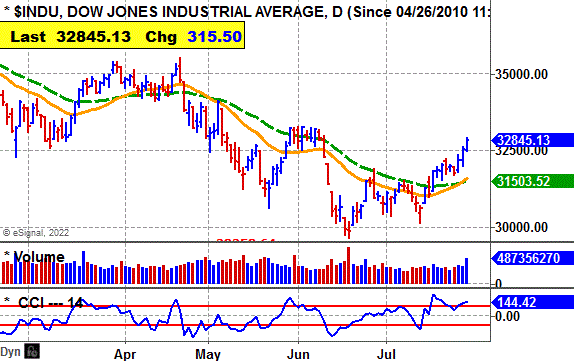
Dow - Bullish |
Dow - Bullish |
Dow - Bearish |
|
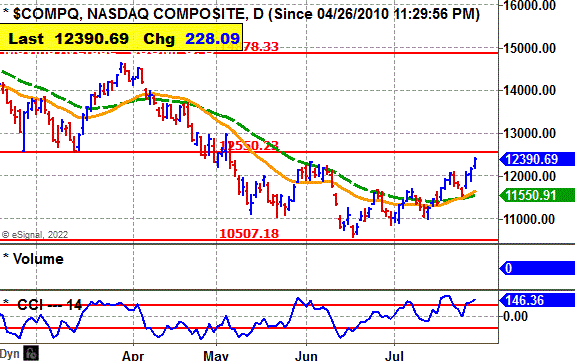
Nasdaq - Bullish |
Nasdaq - Bullish |
Nasdaq - Bearish |
|
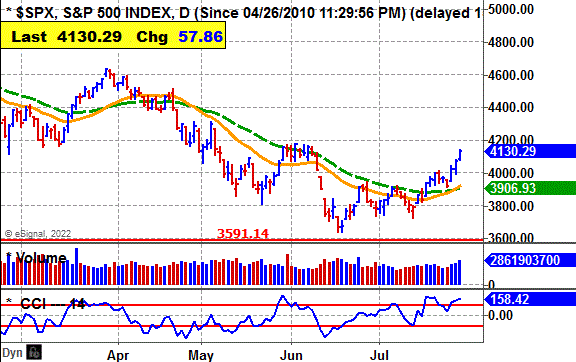
S&P 500 - Bullish |
S&P 500 - Bulli |
S&P 500 - Bearish |
 Ticker Tape Digest's
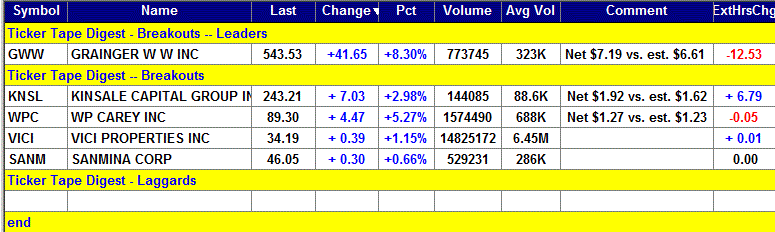
|
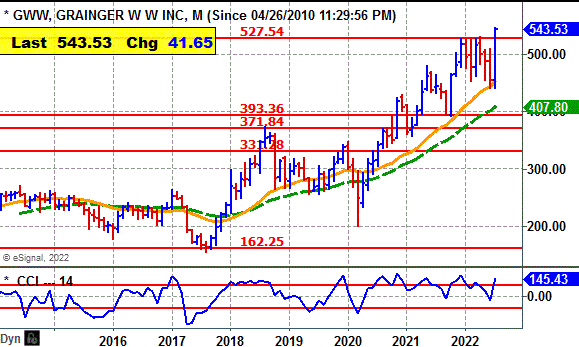
TTD's Quality Rating of Stock - GWW - Above Average |
GWW, based, in Skokie, Il., sells plumbing equipment and also metalworking and hand tools. Annual revenues: $13 billion. GWW's stock surges higher Friday and breaks out from its 8-month flat base. 
The move carries the stock to a new all-time high. It came public back in 1971.
TTD sees potential for more on the upside.
So far today, GWW is trading 773,745 shares, double its average daily volume of 346,000 shares.
GWW's stock gapped higher in the morning and cleared its breakpoint.
The stock then worked steadily higher the rest of the day.
In after-hours trading, the stock was down $12.53 a share. 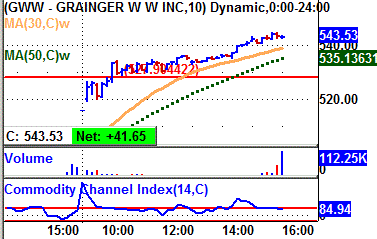
Tape Action
GWW's tape action shows the recent block trades.
One can see the price for the blocks rising from $501 in the prior session to as high as $544.19 by the close.
A key bullish trade came in the morning when a block of 9,599 shares crossed the tape at $520.
That was up from the prior block at $501.88 on 41,818 shares in the prior session.
Near the close a big block of 105,613 shares crossed at $543.53..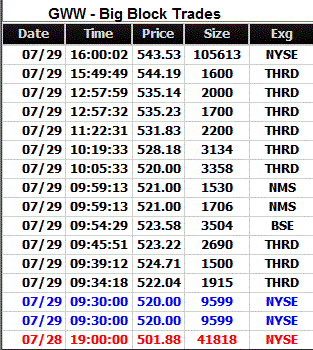
That came on an up tick in the sequence from $542.50.
Business
GWW sells maintenance, repair, and operating products and services with operations in North America, Japan, and the U.K.
The company’s endless assortment segment includes its Zoro Tools, Inc. and MonotaRO Co., Ltd. online channels.
GWW's products include safety and security, material handling and storage, pumps and plumbing equipment, cleaning, and maintenance, metalworking and hand tools.
Charts
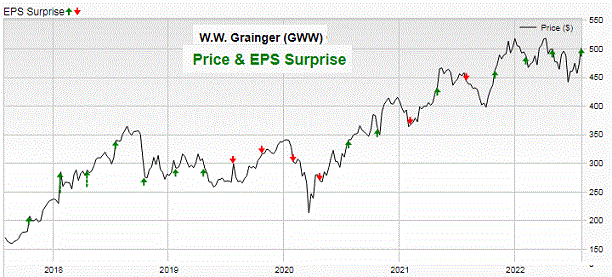
GWW's 12-month performance chart shows the stock up 20% versus a loss of 8% for the stock market.
Insiders were recent buyers using stock options at $248 to 311.
They were sellers at $481 to $509 recently.
GWW's long-term chart shows the stock climbing from $155 a share in 2017 to $372 by early 2018
The stock then fell back to $201 later in 2020 when the stock market fell.
GWW has since surged back to $543. 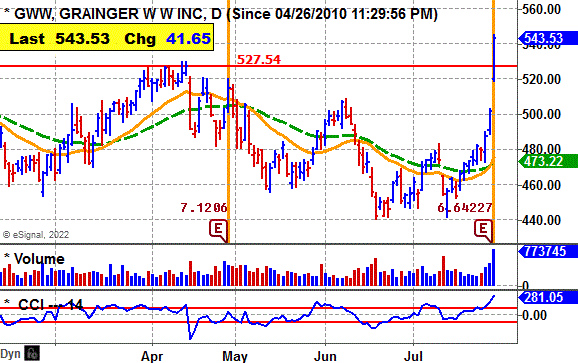
GWW's daily chart shows the stock peaking near $527 in April.
The stock then moved lower to $440 by June.
On a long-term chart the pattern would show as a flat base.
GWW now gaps higher with strong volume to clear its base and reach a new all-time high.
The CCI momentum indicator is strongly bullish..
Earnings Outlook
This year, the Street predicts a 33% surge in net to $26.34 a share from the $19.84 the year before.
Looking ahead to 2023, analysts expect an 8% increase in net to $28.33 from the anticipated $26.34 this year.
Net for the third should rise 13% to $6.44 a share from the $5.65 the year before.
The highest estimate is at $6.78 a share.
The company beat the Street estimate the past four quarters by 47 cents a share 91 cents, 19 cents and 34 cents.
Then in the fourth quarter, net should climb 10% to $6 a share from $5.44 the prior year.
Strategy Opinion: TTD is targeting GWW for a move to $640 within the next few months, or sooner.
A protective stop can be placed near $520.
Intermediate-Term Rating: Average.
Suitability: Average Bulls.
TTD's special research of Stocks Prior Performance:
Breakout Success |
Bullish |
GWW scored some big gains off recent breakouts. |
Response to Net |
Bullish |
GWW rose 12 times after 15 earnings reports. |
Earnings Beats |
Bullish |
GWW beat net estimates 14 times after 20 reports. |
Seasonal Success |
Neutral |
GWW avg. gain 0.6% in Aug., loss 0.6% in Sept. |
Stock's Prior Performance After a Breakout
Stock's % Change from Breakout to peak - prior to cut below 50-day M/A. |
Date of Breakout |
Break point Price |
Stocks Price Peak after Breakout - prior to cut below 50-day M/A |
Date Trade Closed |
10% |
4/26/2021 | 426.67 | 467.06 | 5/10/2021 |
20% |
8/3/2020 | 346.86 | 414.58 | 11/23/2020 |
42% |
3/5/2018 | 257.76 | 365.15 | 8/20/2018 |
(In actual trading, entry and exit points could vary depending on broker execution.
Also, ideal are breakouts to a new 52-week high or better, perhaps all-time highs. Sell point can be a cut below the 50-day M/A.)
TTD's Feature Breakout Stock
|
Long- Term Chart
|
|
Stock's Price Performance after Reporting Earnings
|
|
12 - month Performance Chart vs. S&P 500
|
TTD's Breakout Stock
|
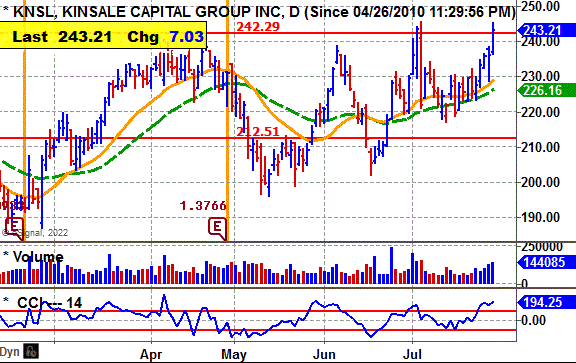
Kinsale Capital Group Inc. (KNSL) - 243.21 Net to Rise 20% This Year, 20% in 2023 |
|
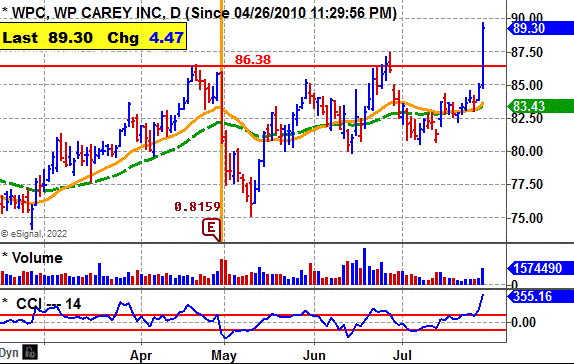
WP Carey Inc. (WPC) - 89.30 Net to Rise 4% this year, 12% in 2023 |
|
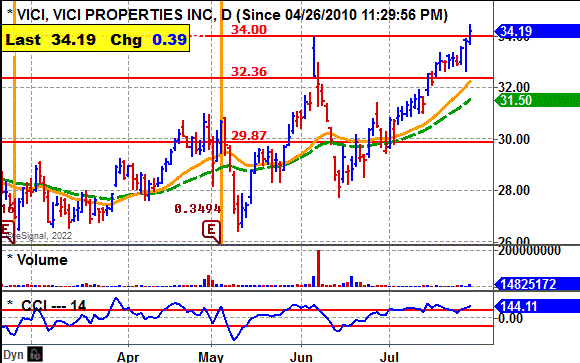
Vici Properties Inc. (VICI) - 34.19 Net to Rise 5% this year, 8% in 2023 |
|
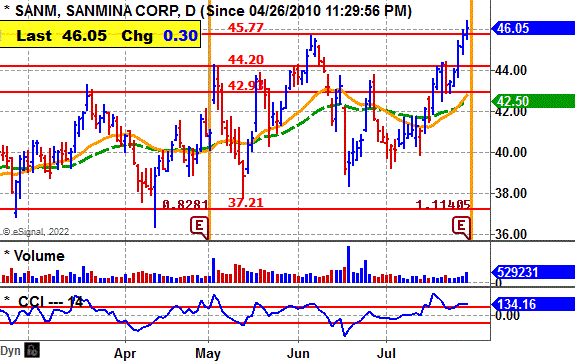
Sanmina Corp. (SANM) - 46.05 Net to Rise 14% in Fiscal 2022 (Sept.), 2% Next Year |
TTD's Feature Stock Under Accumulation
|
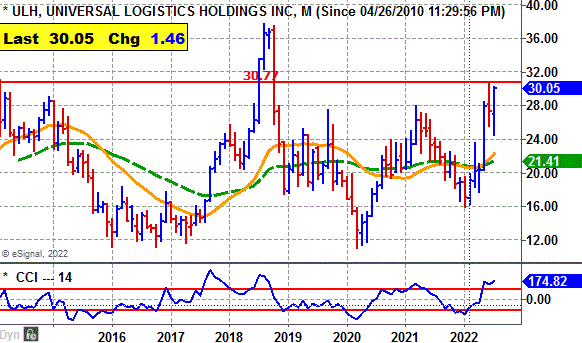
TTD's Quality Rating of Stock - ULH - Average |
ULH, based in Warren, Mich., provides trucking services. Annual revenues: $1.8 billion. ULH's stock moves higher Friday and is in good position to breakout from its two-month, double-bottom base.
 The drive higher was ignited by the company's report of strong earnings.
TTD suggests accumulation in ULH looking toward a potential breakout.
So far today, ULH is trading
ULH's stock gapped higher in the morning and climbed to $30.16
It then pulled back slightly around midday. 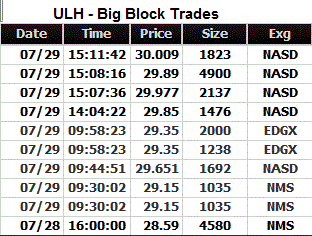
ULH then drove higher in the afternoon to finish with a good gain.
ULH was unchanged in after-hours trading.
ULH came in with earnings for the second quarter of $1.69 a share. That topped the consensus estimate of $1.16 a share.
Tape Action
ULHI's tape action shows the recent block trades.
One can see the prices for ULH's blocks rising from $28.59 in the prior session to as high as $30 by the close.
A key bullish trade came in the morning when a block of 1,035 shares crossed the tape at $29.15.
That was up from the prior block at $28.59 on 4,580 shares in the prior session.
Near the close a block of 1,823 shares crossed at $30.
That was up from the prior block at $29.89 on 4,900 shares.
Business
ULH provides transportation and logistics trucking in the U.S. Mexico, Canada, and Colombia.
The company provides contract logistics services for original equipment manufacturers and retailers on a contractual basis.
Charts
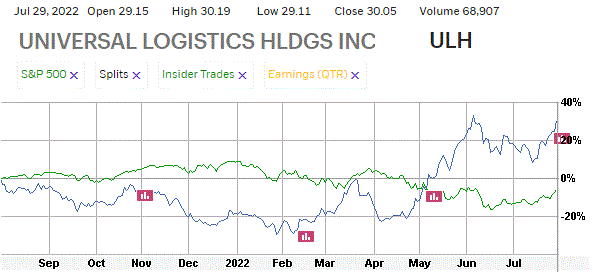
ULH's 12-month performance chart shows the stock up 30% versus an 8% loss for the stock market.
Insider activity was not available.
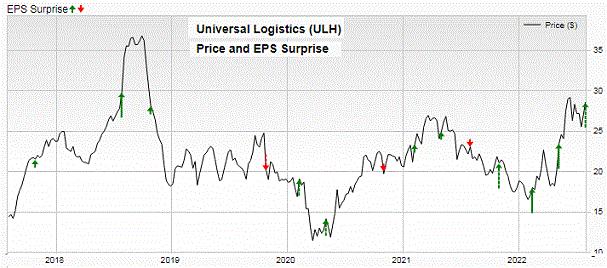
ULH's long-term chart shows the stock rising from $14.30 in 2017 to a peak at $37.67.
The stock then dropped sharply to $11.02 by early 2020 due in part to the bear market.
ULH has since worked back to around $30 and is basing. .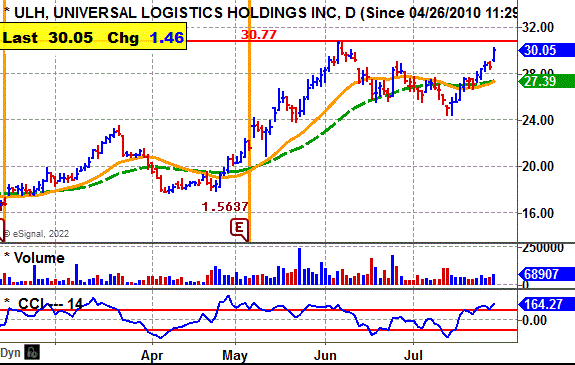
ULH's daily chart shows the stock climbing from $18 in April to a peak near $30 by June.
The stock then pulled back and formed a double-bottom base.
It has now moved across the base and is in good position to breakout.
The CCI momentum indicator is solidly bullish.
Earnings Outlook
This year, analysts project net will climb 41% this year to $4.55 a share from the $3.22 the prior year.
Going out to 2023, the Street sees a 1% decline in net to $4.50 a share from the anticipated $4.55 this year..
Net for the third quarter should climb 12% to 83 cents a share from the 74 cents the year before.
The company beat the Street estimate the past four quarters by a big margin - 53 cents a share, 90 cents, 38 cents and 22 cents a share.
For the fourth quarter, the Street predicts an 8% rise in net to 99 cents a share from the 92 cents the year before.
Strategy Opinion: TTD suggests accumulation in ULH in anticipation of a breakout over $30.90
TTD is targeting ULH for a move to $38 within the next few months after a breakout. A protective stop can be placed near $28 after a breakout.
Intermediate-Term Rating: Average.
Suitability: Average Bulls.
TTD's special research of Stocks Prior Performance:
Breakout Success |
Bullish |
ULH scored big gains off recent breakouts. |
Response to Net |
Bullish |
ULH rose 6 times after 13 earnings reports. |
Earnings Beats |
Bullish |
ULH beat net estimates 7 times after 9 reports. |
Seasonal Success |
Bullish |
ULH avg. gain 7.3% in Aug., 0.2% in Sept. |
Stock's Prior Performance After a Breakout
Stock's % Change from Breakout to peak - prior to cut below 50-day M/A. |
Date of Breakout |
Break point Price |
Stocks Price Peak after Breakout - prior to cut below 50-day M/A |
Date Trade Closed |
10% |
3/1/2021 | 24.16 | 26.58 | 3/29/2021 |
42% |
6/11/2018 | 25.70 | 36.60 | 8/27/2918 |
39% |
9/11/2017 | 17.78 | 24.70 | 1/8/2018 |
(In actual trading, entry and exit points could vary depending on broker execution.
Also, ideal are breakouts to a new 52-week high or better, perhaps all-time highs. Sell point can be a cut below the 50-day M/A.)
|
Stock's Long-term Chart
|
|
Stock's Price Performance after Reporting Earnings
|
|
Stock Performance Chart with Earnings Markers vs. S&P 500 Insider Buying in Green - Insider Selling in Red
|
TTD's Key Stocks Under Accumulation
|
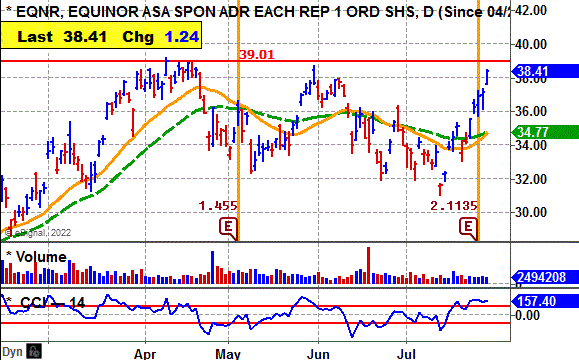
Equinor ASA. (EQNR) - 38.41 Set a Stop Buy at 39.20 to Catch the Breakout Net to Soar 100% This Year
|
|
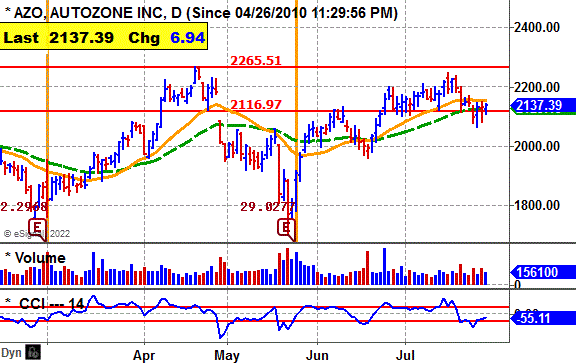
AutoZone Inc. (AZO) - 2137.39 Set a Stop Buy at 2266 to Catch the Breakout Net to Rise 21% For Fiscal 2022 (Aug.) |
 Ticker Tape Digest’s
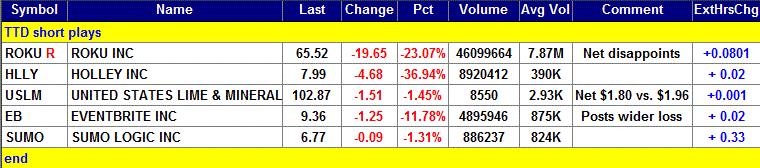
Ticker Tape Digest’s Daily List of “Stocks To Sell or Sell Short” ranks stocks well timed to be sold immediately based on daily trading. The list can be used as an alert to reduce current long-term positions.
Shorts from tape action - 5
Stocks Screened - 6,500
Long-Term Environment for Bears: Favorable.
Bear Side - Small list of shorts as stock market rallies near-term. Bears be watchful and conservative at this time.
|
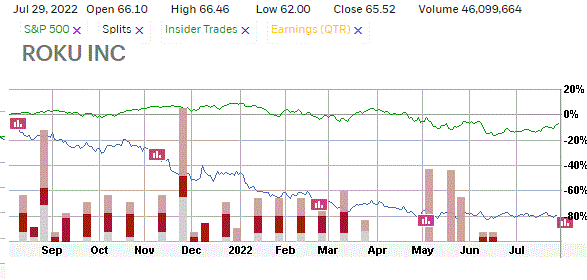
TTD's Quality Rating of Stock - ROKU - Below Average |
ROKU, based in San Jose, Ca., operates a television streaming platform in the U.S., Mexico, and Canada. Annual revenues: $2.8 billion. ROKU's stock falls sharply Friday and undercuts key technical support.
The decline was due to a wider loss than expected for the quarter.
TTD sees potential for more on the downside.
So far today, ROKU is trading 46.1 million shares, four times its average daily volume of 9.9 million shares.
ROKU posted a loss of 82 cents a share for the second quarter. The Street was expecting a loss of 68 cents a share.
ROKU's stock fell sharply in the morning and undercut key technical support. 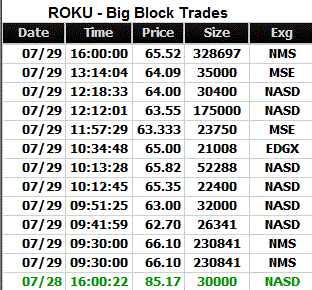
The stock then trended sideways the rest of the day.
ROKU was up 8 cents a share in after hours trading.
Tape Action
ROKU's tape action shows the recent block trades.
One can see the price for the blocks Tumbling from $85.17 in the prior session to as low as $62.70 on Friday.
A key bearish trade came in the morning when a block of 230,841 shares crossed the tape at $66.10.
That was down sharply from the prior block at $85.17 on 30,000 shares in the prior session. .
Business
ROKU. operates a television streaming platform. It operates through two segments: Platform and Player.
Its Platform sells digital advertising including the OneView ad platform, content distribution services, such as subscription and transaction revenue shares, media and entertainment promotional spending, the sale of premium subscriptions and the sale of branded channel buttons.
Its Player segment sells streaming players, audio products and accessories through retail distribution channels.
Its products include Roku Streambars, Roku wireless speakers, Roku TVs and Roku Wireless Subwoofers. Its products are available in approximately 20 countries.
Charts
ROKU's daily chart shows the stock declining from $160 in March to around $73 by April.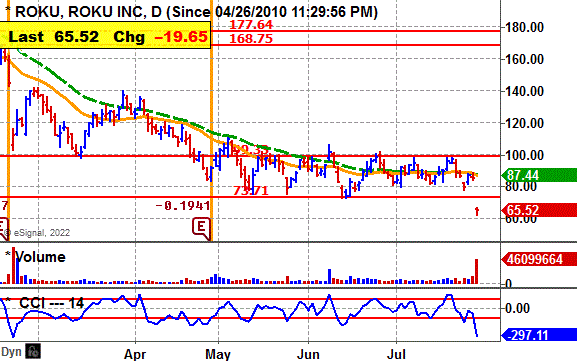
The stock tried to put down a bottom but now gaps lower with big volume.
That is very bearish.
The CCI momentum indicator is very bearish.
Earnings:
This year, analysts expect a big loss of $1.96 a share versus a profit of $1.71 the prior year.
Going out to 2023, the Street predicts a loss of $1.24 a share.
For the second quarter, the Street expects a loss of 76 cents a share compared with a profit of 48 cents the year before.
Then in the third quarter a loss of 31 cents is projected against a profit of 17 cents the previous year.
profits should drop 3% to $2.70 a share from the $2.77 the previous year.
Strategy Opinion: TTD is targeting ROKU for a decline to $55 within the next few months or sooner.
A protective stop buy can be placed near $71.
Suitability: Aggressive Bears.
TTD's Stock Probability research of Prior Performance:
|
Response to Net |
Bullish |
ROKU rose 9 times after 15 earnings reports. |
|
Seasonal Success |
Bullish |
ROKU avg. gain 17.9% in Aug., loss 3.1% in Sept.. |
Stock's Performance Chart with Quarterly Earnings Markers vs. S&P 500
Insider Buying in Green - Insider Selling in Red
Guide: Symbol=Ticker, Name=Corporate name, Entry is the buy price to enter on the breakout, Last=prior close, Change=change from last close to prior, Date=date of price of close etc, Gain in blue is price above breakpoint (entry), Gain in red is price below breakpoint (entry)., % Gain in blue is % over breakpoint (entry), Gain in red is % below breakpoint (entry)
Copyright --- Ticker Tape Digest - 2022
TTD columnist Leo Fasciocco has covered the stock market for over 30 years. His articles appear in many publications. He has also been a speaker at the Money Show conferences. He has been on television and radio. He is author of many educational articles about stock investing and the book “Guide To High-Performance Investing.”

For information to subscribe to the Ticker Tape Digest Services call: Beverly Owen at 1-480-704-3331 or 480-878-8381
Distributed by Corona Publishing Enterprises. Ticker Tape Digest Inc. 1220 W. Sherri, Gilbert, Az. 85233.
TTD “Professional Report” is available on the Web: $100 per month. Password needed. Published daily - around 20 times a month.
TTD Pro Report includes a Morning chart slide show of breakout stocks, a Midsession video-audio show with commentary on breakout stocks and shorts and a Final end of day overall report on breakout stocks for the session, short plays and accumulation plays. There are other features too such as Quick Trades and Long-term Plays.
TTD Daily Report is $39. It covers a Morning slide show of charts of stocks breaking out and a TTD end of day print report covering breakout stocks and shorts.
Credit cards accepted. Payable to Corona Publishing Enterprises.
(The information contained has been prepared from data deemed reliable but there is no guarantee of complete accuracy. Ticker Tape Digest Inc. is not affiliated with any broker, dealer or investment advisor. Nothing in this publication constitutes an offer, recommendation or solicitation to buy or sell any securities. Further research is advised. This report is copyrighted and no redistribution is permitted with out permission.)