|
|
|
Daily - Go to TTD's Chart scroller of Breakout Stocks - Thursday - August 11, 2022 |
|
|
|
(WMV video player download for Google) https://videoconverter.iskysoft.com/play-video/wmv-player-for-chrome.html Go to Video Show - "How to Make Money With Breakout Stocks |
|---|

By Leo Fasciocco -- TTD
Ticker Tape Digest presents its daily stock market report containing stocks to go long as Breakout Trades, Quick Trades, or Bargain Accumulation Trades.
We also feature stocks under Significant Accumulation that are poised to breakout.
|
Ticker Tape Digest's Daily schedule guide for TTD subscribers 1. Pre-market - check Breakout Watch List and Quick Trades. 2. Morning - (11:30 - 12 A.M.) - check breakout stocks tape and breakout chart slide show. 3. Midday (1 P.M.) check TTD Midsession Report and see market video show. 4. After close (4 P.M.) check final TTD Report for day. Trading Strategies Bullish Aggressive Investors Bullish - "Breakout Stocks" - ideally suited for bull markets and special situation stocks. Potential for large returns. (See Performance) Aggressive Investor Bullish- "Quick Trade Stocks" -ideally suited for entry into top performing issues looking for a small quick profit." (See Performance) Conservative Investors "Bargain Buy Trades for the Long Term." Ideally suited for entry into top performing big cap stocks on pullbacks within overall up trend.(See Performance) Bearish Aggressive Bearish Investors - "Breakdown Stocks" to Sell Short. Ideally suited for bear markets or market pull backs. Potential for large returns (See Performance) |
|---|
The TTD report also contains stocks to short as breakdown plays and as bargain (swing trade) shorts.
Investors should tend to try to go with a strategy that fits with the stock market's trend, unless there is a special situation play.
TTD's Breakout Stocks - Long are
most suitable for aggressive investors seeking ideal entry points into leading stocks, especially during bull markets. They can do extremely well in bull markets with gains of as much as several hundred percent. 
These stocks can also do extremely well during strong market rallies, or if they are in a industry group that is performing very well. They tend to have strong earnings outlooks and are near new-52 week, or all-time highs.
TTD Swing - Quick Trade Stocks - Long These are leading issues that have pulled back in recent days, but could move higher soon. They are most suitable for Aggressive Investors willing to trade short term. These stocks will do extremely well during market advances. They have about 74% win rate. During market rally sequences the win rate is even higher. The return is small 3% to 8% in just a few days.
TTD also presents Stocks To Sell or Sell Short. These issues are suitable for aggressive investors willing to take short positions both as trades or for longer-term plays. These stocks will do very well during bear markets or market pull backs.
TTD's Bearish breakdown stocks to sell short. These issues have potential to fall sharply. They often show a technical breakdown and also some fundamental business problem such as weak earnings.
TTD's multi-media updates include a slide-show that presents charts and analysis at midsession. Some times TTD presents feature analysis on stocks and the market. TTD uses Windows Media Files. (WMV).
TTD also presents a "Breakout Watch List" that is up dated daily. This list consists of key stocks in position to breakout. A close watch of this list can put you in the stock just as it breaks out. A good idea is to study the list and be ready to move into a stock quickly as it hits its breakpoint.
TTD often suggests using stop buy orders to enter. It is very important to buy a breakout stock as close as possible to the breakpoint. The idea is to get "elbow room" if the stock should follow through to the upside. This is very important in being successful in making big money with breakout stocks.
It is also essential to have a stop loss strategy for all stocks in which positions are taken. Not every stock will work as expected. It is important for investors to "police" their portfolios and avoid getting trapped in any bad positions.
Quality rating of breakout Two key factors: 1 - Stock near all-time high in price or near a 52-week high. 2 - earnings growth current year is strong. The ideal play is a stock with an Above Average Quality Rating. The stock is near a new high and will have strong earnings. TTD's other ratings are Average and Below Average.
TTD also has special feature sections on Educational Tips on Investing.
To email Mr. Leo Fasciocco leo@tickertapedigest.com.
For service, email Beverly Owen owen@tickertapedigest.com. TTDÆs Tel: 1-480-878-8381 or 480-704-3331.
Thursday - August 11, 2021
TTD's Breakout Stocks
Stock Market Overview
Total Buy Breakout Stocks - 3
Quality of Breakouts - Average.
Stocks Screened - 6,500
Bull side - Small list of breakouts and very selective.
Stock market - Major averages are bullish in all time sectors except the Monthly, Nasdaq.
Comment - Bulls be conservative. Stock market rally holding, but looks vulnerable.
See Latest Earnings Reports - A company that tops the Street's highest earnings estimate has potential to go higher. Today's key earnings beats with a stock on the move higher: BRCC, SOHO, LZ, DRCT and PRPH.
Stock Market Momentum
(Daily is based on a moving average)
|
Market (Daily) |
Market (Weekly) |
Market (Monthly) |
|
Dow - Bullish |
Dow - Bullish |
Dow - Bullish |
|
Nasdaq - Bullish |
Nasdaq - Bullish |
Nasdaq - Bearish |
|
S&P 500 - Bullish |
S&P 500 - Bull |
S&P 500 - Bullish |
 Ticker Tape Digest's
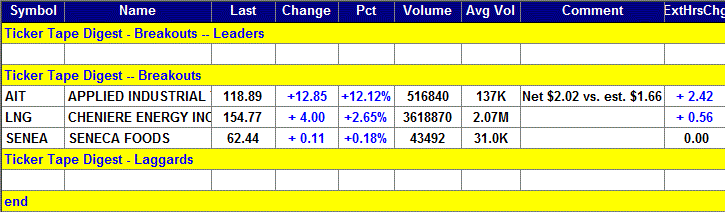
|
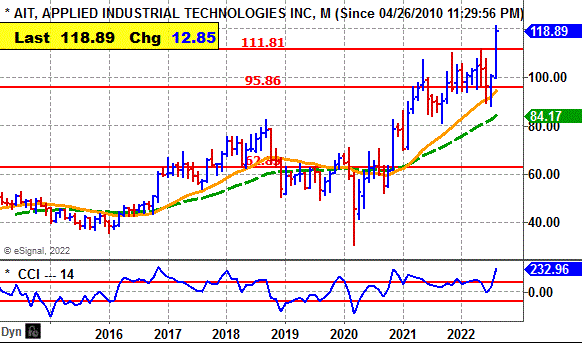
TTD's Quality Rating of Stock - AIT - Average |
AIT, based in Cleveland, sells industrial motion, power, and control technologies products. Annual revenues: $3.2 billion. .AIT's stock gaps higher Thursday and breaks out from its 16-week, cup-and-handle base. 
So far today, AIT is trading a heavy 516,855 shares, four times its average daily volume of 137,000 shares.
TTD sees potential for more on the upside.
AIT's stock gapped higher in the morning and cleared its breakpoint.
The gain was triggered by strong earnings.
The stock then trended sideways the rest of the day.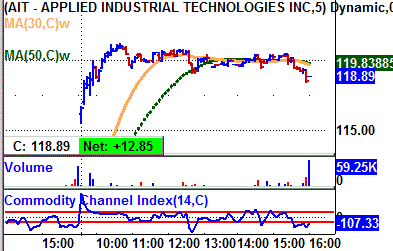
AIT's stock backed off slightly near the close.
In after-hours trading, AIT was up $2.42 a share.
Tape Action
AIT's tape action shows the recent block trades.
One can see the prices for AIT's blocks rising from $106.64 in the prior session to as high as $120.52 later in the morning.
A key bullish trade came in the morning when a block of 5,000 shares crossed the tape at $117.95.
That was up from the prior block at $106.04 on 32,320 shares in the prior session.
Near the close a big block of 57,814 shares crossed at $118.89..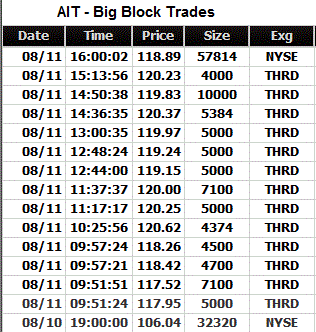
That was down from the prior block at $120.23 on 4,000 shares.
However, the block on the close came on a sequence started by an up tick from $118.47 in the sequence.
Business
AIT sells industrial motion, power, and control technology items. .
They include fluid power & flow control systems.
The firm has distribution operations in North America, Australia and New Zealand.
This business operates through local service centers and distribution centers with products for maintenance and repair of motion control infrastructure and production equipment.
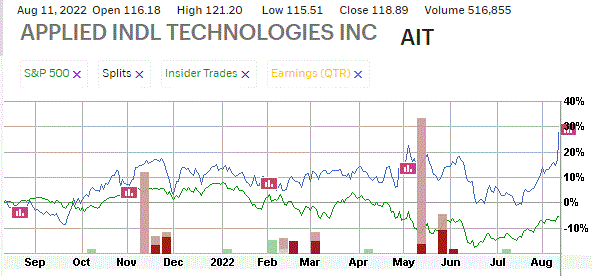
Charts
AIT's 12-month performance chart shows the stock up 28% versus a 5% loss for the stock market.
Insider were buyers at $38 to $48 a share using stock options.
They were sellers at $100 to $108 a share.
AIT's long-term chart shows the stock rising from $37 in 2016 to $82 by 2018.
The stock then dropped sharply to $31 in early 2020 due in part to the bear market.
AIT has since worked higher to $111 this year. 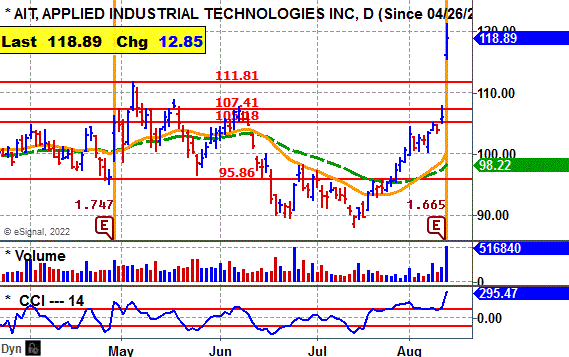
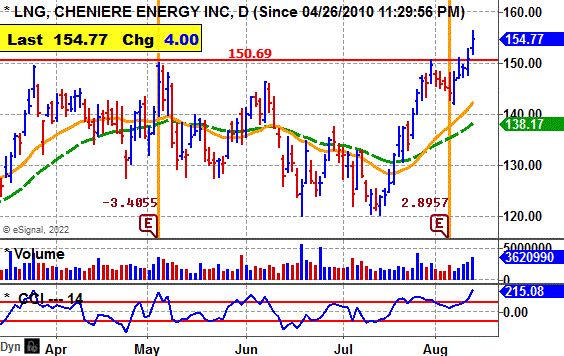
AIT's daily chart shows the stock climbing from $95 in April to a peak near $111 by Mayl.
The stock then back traced to $90 by June, rallied to 107 forming a double-bottom base.
The breakout comes with a gap move and big volume.
It was triggered by a bullish earnings report.
The CCI momentum indicator is strongly bullish.
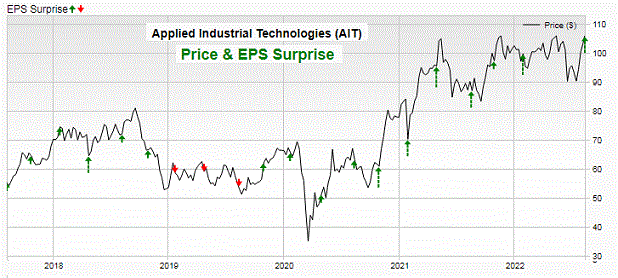
Earnings Outlook
For fiscal 2023 ending in June, analysts predict a 10% increase in earnings to $6.84 a share.
That estimate could be lifted.
For the fiscal first quarter ending in September, the Street projects a 13% jump in net to $1.53 a share from the $1.36 the prior year.
The company beat the Street estimate the past four out of five quarters.
Strategy Opinion: TTD is targeting AIT for a move to $136 within the next few months. A protective stop can be placed near $110.
Intermediate-Term Rating: Average.
Suitability: Average Bulls.
TTD's special research of Stocks Prior Performance:
Breakout Success |
Bullish |
AIT scored modest gains off recent breakouts. |
Response to Net |
Bullish |
AIT rose 9 times after 15 earnings reports. |
Earnings Beats |
Bullish |
AIT beat net estimates 15 times after 19 reports. |
Seasonal Success |
Bullish |
AIT avg. gain 1.1% in Aug., 0.2 in Sept. |
Stock's Prior Performance After a Breakout
Stock's % Change from Breakout to peak - prior to cut below 50-day M/A. |
Date of Breakout |
Break point Price |
Stocks Price Peak after Breakout - prior to cut below 50-day M/A |
Date Trade Closed |
15% |
10/7/2021 | 92.27 | 106.41 | 11/23/2021 |
9% |
4/21/2021 | 96.09 | 105.05 | 5/10/2021 |
14% |
8/6/2020 | 69.72 | 79.16 | 11/23/2020 |
(In actual trading, entry and exit points could vary depending on broker execution.
Also, ideal are breakouts to a new 52-week high or better, perhaps all-time highs. Sell point can be a cut below the 50-day M/A.)
TTD's Feature Breakout Stock
|
Long- Term Chart
|
|
Long-Term Performance Chart
|
|
12 - month Performance Chart vs. S&P 500
|
TTD's Breakout Stock
|
Cheniere Energy Inc. (LNG) - 154.77 Net to Surge 308% This Year |
|
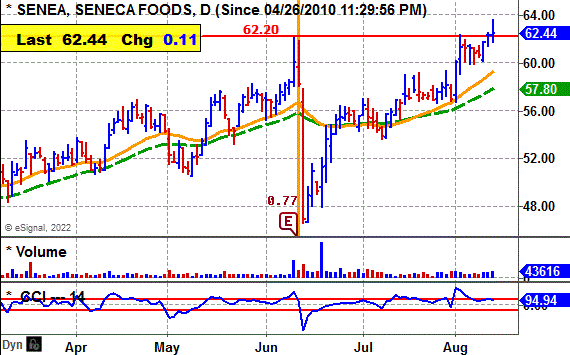
Seneca Foods (SENEA) - 62.44 Posts net of 62 cents a share for fiscal first quarter |
TTD's Feature Stock Under Accumulation
|
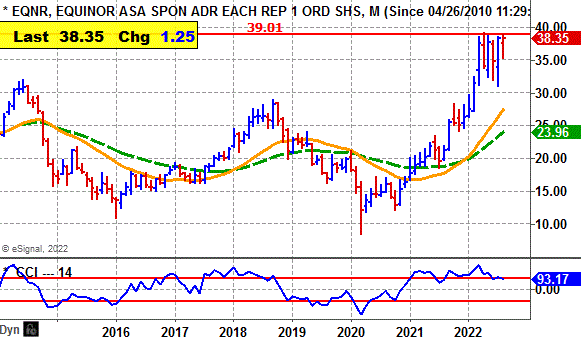
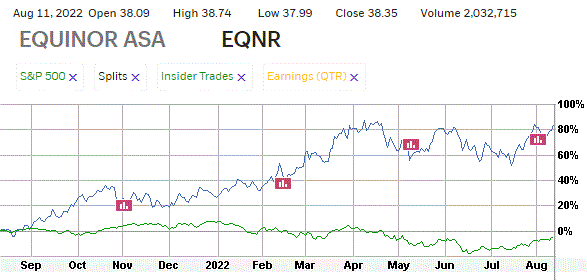
TTD's Quality Rating of Stock - EQNR - Average |
EQNR, based in Norway, produces oil and gas. Annual revenues: $88.7 billion. EQNR's stock moves higher Thursday and now is close to a breakout from its 2-month cup-and-handle base. 
So far today, EQNR is trading 2 million shares. Its average daily volume is 2.5 million shares.
TTD suggests accumulation in anticipation of a breakout. 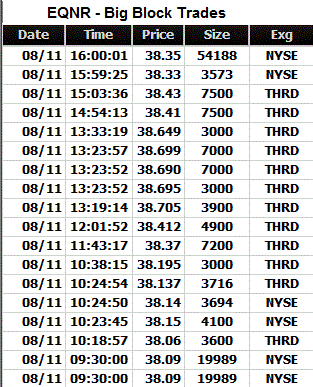
EQNR's stock moved steadily higher in the morning to an intraday peak at $38.73 in the early afternoon.
The stock then backed off in the afternoon, but still held a nice gain for the day.
In after-hours trading, EQNR was up 15 cents a share.
Tape Action
EQNR's tape action shows the recent block trades.
One can see the prices for the blocks rising from $38.06 in the morning to as high as $38.70 in the afternoon.
A key bullish trade came in the morning when a block of 4,100 shares crossed the tape at $38.15.
That was up from the prior block at $38.06 on 3,600 shares.
Near the close a big block of 54,188 shares crossed at $38.35.
That was up from the prior block at $38.33 on 3,573 shares.
Business
EQNR, formerly Statoil ASA, is a Norway-based energy company producing oil and gas.
EQNR manages upstream activities on the Norwegian continental shelf and explores for crude oil, natural gas and natural gas liquids.
Charts
EQNR's 12-month performance chart shows the stock up 82% versus a 5% loss for the stock market.
Insider activity was not available. .
EQNR's long term-chart shows the stock climbing from $11 in 2016 to a peak at $28 by 2018.
The stock then fell back to $8.41 in 2020 due to the bear market back then.
EQNR has since surged strongly to $38.
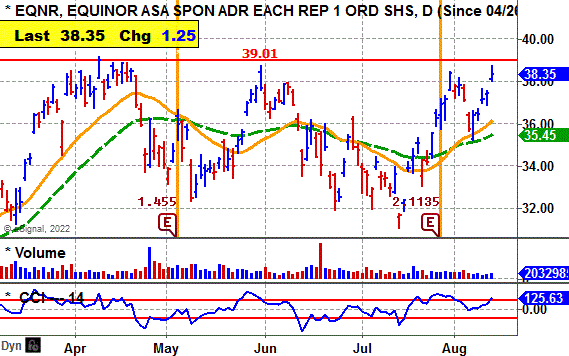
EQNR's daily chart shows the stock rising from $32 in March to a peak near $39 by April.
The stock then pulled back and eventually formed a cup-and-handle base from late May to August.
The stock has rallied now and is close to a breakout.
The CCI momentum indicator is bullish.
Earnings Outlook
This year, analysts predict a 98% jump in profits to $6.09 a share from $3.08 the prior year.
Going out to 2023, the Street sees a 23% decline in profits to $4.72 a share from the expected $6.09 this year.
Net for the third quarter should leap 52% to $1.29 a share from the 85 cents the year before.
For the fourth quarter, the Street projects a 15% gain in net to $1.56 a share from the $1.36 the previous year.
Strategy Opinion: TTD suggests accumulation in EQNR in anticipation of a breakout over $39.20.
TTD is targeting EQNR for a move to $47 within the next few months after a breakout. A protective stop can be placed near $36 after a breakout.
Intermediate -Term Rating: Average.
Suitability: Aggressive Bulls.
TTD's special research of Stocks Prior Performance:
Breakout Success |
Bullish |
EQNR scored some good gains off recent breakouts |
Response to Net |
Bullish |
EQNR rose 8 times after 15 earnings reports. |
Earnings Beats |
Bullish |
EQNR beat net estimates 12 times after 16 reports. |
Seasonal Success |
Bullish |
EQNR avg. gain 2.7% in Aug., 7.2% in Sept. |
Stock's Prior Performance After a Breakout
Stock's % Change from Breakout to peak - prior to cut below 50-day M/A. |
Date of Breakout |
Break point Price |
Stocks Price Peak after Breakout - prior to cut below 50-day M/A |
Date Trade Closed |
37% |
2/3/2022 |
28.41 | 39 | 4/8/2022 |
21% |
9/22/2021 |
23.37 | 28.26 | 10/20/2021 |
11% |
5/6/2021 |
20.86 | 23.18 | 6/7/2021 |
(In actual trading, entry and exit points could vary depending on broker execution.
Also, ideal are breakouts to a new 52-week high or better, perhaps all-time highs. Sell point can be a cut below the 50-day M/A.)
|
Stock's Long-term Chart
|
|
Stock's Price Performance after Reporting Earnings
|
|
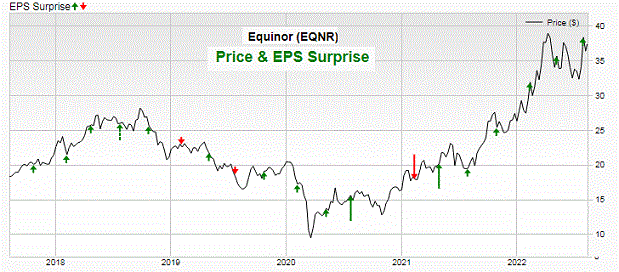
Stock Performance Chart with Earnings Markers vs. S&P 500 Insider Buying in Green
|
TTD's Key Stocks Under Accumulation
|
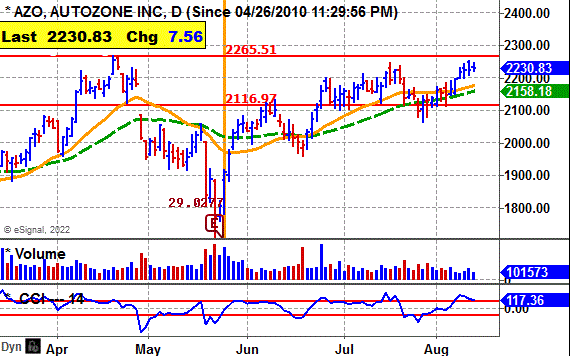
Autozone Inc. (AZO) - 2230.83 Set a Stop Buy at 2266 to Catch the Breakout Net to Soar 98% This year
|
|
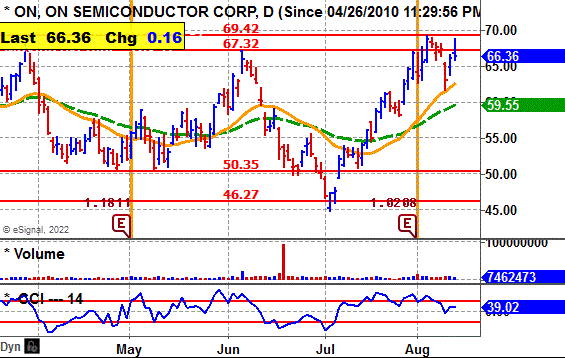
On Semiconductor Corp. - (ON) - 66.36 Set a Stop Buy at 69.60 to Catch the Breakout Net to Surge 75% This Year |
 Ticker Tape DigestÆs
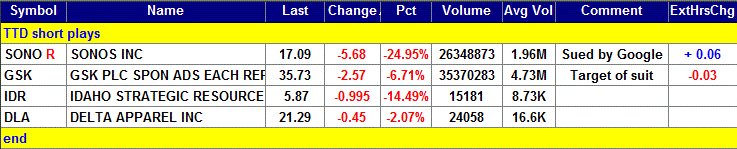
Ticker Tape DigestÆs Daily List of ōStocks To Sell or Sell Shortö ranks stocks well timed to be sold immediately based on daily trading. The list can be used as an alert to reduce current long-term positions.
Shorts from tape action - 4
Stocks Screened - 6,500
Long-Term Environment for Bears: Favorable.
Bear Side - Small list of shorts but some interesting plays for aggressive bears.
|
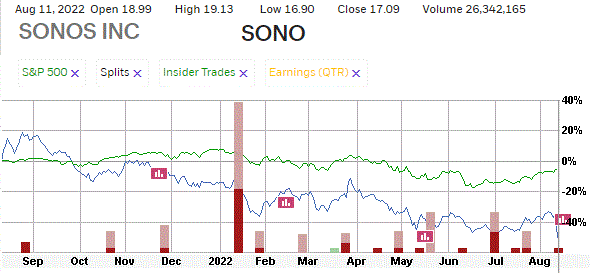
TTD's Quality Rating of Stock - SONO - Below Average |
SONO, based Santa Barbara, Ca., produces wireless multi-room home audio systems. The Company operates as a sound experience brand. Annual revenues: $1.7 billion. SONO's stock falls sharply Thursday and undercuts key technical support. 
The decline was triggered by news Google plans to sue SONO.
So far today, SONO is trading a heavy 26.4 million shares, 13 times its average daily volume of 2 million shares.
The stock was also hurt by disappointing earnings for he quarter. TTD sees potential for more on the downside.
SONO's stock fell sharply in the morning undercutting key technical support.
The stock drifted to an intraday low in the afternoon at $16.90.
In after hours trading the stock was up one cent a share. 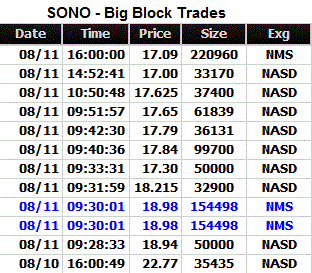
Tape Action
SONO's tape action shows the recent block trades.
One can see the price for the blocks declining from $22.77 in the prior session to as low as $17 in the afternoon.
A key bearish trade came in the morning when a block of 50,000 shares crossed the tape at $18.94.
That was down from the prior block at $22.77 on 35,435 shares in the prior session.
At the close a block of 220,960 shares crossed at $17.09.
That was up from the prior block at $17 on 33,170 shares.
Business
SONO sells speakers, portable speakers, home theatre and components. Its accessories include custom-designed stands, mounts, shelves, cables, chargers, and more.
The Company provides customers with access to voice control, streaming music, Internet radio, podcasts, and audiobook content, enabling them to listen to audio entertainment.
Its products allow customers to convert third-party wired systems, stereo systems and home theater set-ups into its easy-to-use, wirelessly controlled streaming music system.
Its platform is used by a broad set of content providers, including leading streaming music services and third-party developers. The Company's streaming content is available on Apple Music, Pandora, Spotify, and TuneIn.
Charts
SOHO's daily chart shows the stock trending lower from $30 down to $17.50 by July..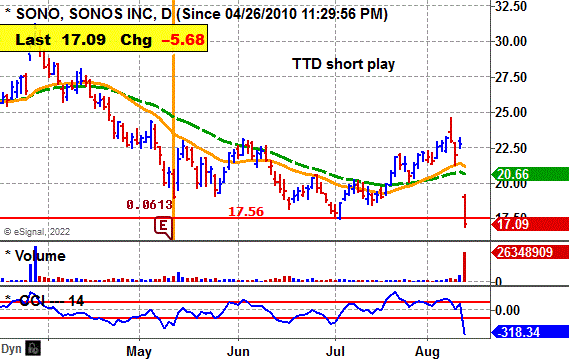
The stock tried to rally but now rolls over and breaks to the downside with big volume.
The move comes with big volume.
. The CCI momentum indicator is very bearish.
Earnings:
This fiscal year ending in September, analyses predict a 38% drop in net to $1.09 a share from the $1.77 the prior year.
For the upcoming fiscal fourth quarter ending in September, analysts were expecting a 50 jump in net to 12 cents a share from the 8 cents the year before.
That forecast will come down.
Strategy Opinion: TTD is targeting SONO for a drop to $13.50 within the next few months or sooner.
A protective stop buy can be placed near $17.50.
Suitability: Aggressive Bears.
TTD's Stock Probability research of Prior Performance:
|
Response to Net |
Bearish |
SONO rose 5 times after 13 earnings reports. |
|
Seasonal Success |
Bullish |
SONO avg. gain 9.3% in Aug., loss 8.8% in Sept. |
Stock's Performance Chart with Quarterly Earnings Markers vs. S&P 500
Insider Buying in Green - Insider Selling in Red
Guide: Symbol=Ticker, Name=Corporate name, Entry is the buy price to enter on the breakout, Last=prior close, Change=change from last close to prior, Date=date of price of close etc, Gain in blue is price above breakpoint (entry), Gain in red is price below breakpoint (entry)., % Gain in blue is % over breakpoint (entry), Gain in red is % below breakpoint (entry)
Copyright --- Ticker Tape Digest - 2022
TTD columnist Leo Fasciocco has covered the stock market for over 30 years. His articles appear in many publications. He has also been a speaker at the Money Show conferences. He has been on television and radio. He is author of many educational articles about stock investing and the book ōGuide To High-Performance Investing.ö

For information to subscribe to the Ticker Tape Digest Services call: Beverly Owen at 1-480-704-3331 or 480-878-8381
Distributed by Corona Publishing Enterprises. Ticker Tape Digest Inc. 1220 W. Sherri, Gilbert, Az. 85233.
TTD ōProfessional Reportö is available on the Web: $100 per month. Password needed. Published daily - around 20 times a month.
TTD Pro Report includes a Morning chart slide show of breakout stocks, a Midsession video-audio show with commentary on breakout stocks and shorts and a Final end of day overall report on breakout stocks for the session, short plays and accumulation plays. There are other features too such as Quick Trades and Long-term Plays.
TTD Daily Report is $39. It covers a Morning slide show of charts of stocks breaking out and a TTD end of day print report covering breakout stocks and shorts.
Credit cards accepted. Payable to Corona Publishing Enterprises.
(The information contained has been prepared from data deemed reliable but there is no guarantee of complete accuracy. Ticker Tape Digest Inc. is not affiliated with any broker, dealer or investment advisor. Nothing in this publication constitutes an offer, recommendation or solicitation to buy or sell any securities. Further research is advised. This report is copyrighted and no redistribution is permitted with out permission.)