|
|
|
Daily - Go to TTD's Chart scroller of Breakout Stocks - Thursday - August 25, 2022 |
|
|
|
(WMV video player download for Google) https://videoconverter.iskysoft.com/play-video/wmv-player-for-chrome.html Go to Video Show - "How to Make Money With Breakout Stocks |
|---|

By Leo Fasciocco -- TTD
Ticker Tape Digest presents its daily stock market report containing stocks to go long as Breakout Trades, Quick Trades, or Bargain Accumulation Trades.
We also feature stocks under Significant Accumulation that are poised to breakout.
|
Ticker Tape Digest's Daily schedule guide for TTD subscribers 1. Pre-market - check Breakout Watch List and Quick Trades. 2. Morning - (11:30 - 12 A.M.) - check breakout stocks tape and breakout chart slide show. 3. Midday (1 P.M.) check TTD Midsession Report and see market video show. 4. After close (4 P.M.) check final TTD Report for day. Trading Strategies Bullish Aggressive Investors Bullish - "Breakout Stocks" - ideally suited for bull markets and special situation stocks. Potential for large returns. (See Performance) Aggressive Investor Bullish- "Quick Trade Stocks" -ideally suited for entry into top performing issues looking for a small quick profit." (See Performance) Conservative Investors "Bargain Buy Trades for the Long Term." Ideally suited for entry into top performing big cap stocks on pullbacks within overall up trend.(See Performance) Bearish Aggressive Bearish Investors - "Breakdown Stocks" to Sell Short. Ideally suited for bear markets or market pull backs. Potential for large returns (See Performance) |
|---|
The TTD report also contains stocks to short as breakdown plays and as bargain (swing trade) shorts.
Investors should tend to try to go with a strategy that fits with the stock market's trend, unless there is a special situation play.
TTD's Breakout Stocks - Long are
most suitable for aggressive investors seeking ideal entry points into leading stocks, especially during bull markets. They can do extremely well in bull markets with gains of as much as several hundred percent. 
These stocks can also do extremely well during strong market rallies, or if they are in a industry group that is performing very well. They tend to have strong earnings outlooks and are near new-52 week, or all-time highs.
TTD Swing - Quick Trade Stocks - Long These are leading issues that have pulled back in recent days, but could move higher soon. They are most suitable for Aggressive Investors willing to trade short term. These stocks will do extremely well during market advances. They have about 74% win rate. During market rally sequences the win rate is even higher. The return is small 3% to 8% in just a few days.
TTD also presents Stocks To Sell or Sell Short. These issues are suitable for aggressive investors willing to take short positions both as trades or for longer-term plays. These stocks will do very well during bear markets or market pull backs.
TTD's Bearish breakdown stocks to sell short. These issues have potential to fall sharply. They often show a technical breakdown and also some fundamental business problem such as weak earnings.
TTD's multi-media updates include a slide-show that presents charts and analysis at midsession. Some times TTD presents feature analysis on stocks and the market. TTD uses Windows Media Files. (WMV).
TTD also presents a "Breakout Watch List" that is up dated daily. This list consists of key stocks in position to breakout. A close watch of this list can put you in the stock just as it breaks out. A good idea is to study the list and be ready to move into a stock quickly as it hits its breakpoint.
TTD often suggests using stop buy orders to enter. It is very important to buy a breakout stock as close as possible to the breakpoint. The idea is to get "elbow room" if the stock should follow through to the upside. This is very important in being successful in making big money with breakout stocks.
It is also essential to have a stop loss strategy for all stocks in which positions are taken. Not every stock will work as expected. It is important for investors to "police" their portfolios and avoid getting trapped in any bad positions.
Quality rating of breakout Two key factors: 1 - Stock near all-time high in price or near a 52-week high. 2 - earnings growth current year is strong. The ideal play is a stock with an Above Average Quality Rating. The stock is near a new high and will have strong earnings. TTD's other ratings are Average and Below Average.
TTD also has special feature sections on Educational Tips on Investing.
To email Mr. Leo Fasciocco leo@tickertapedigest.com.
For service, email Beverly Owen owen@tickertapedigest.com. TTDÆs Tel: 1-480-878-8381 or 480-704-3331.
Thursday - August 25, 2021
TTD's Breakout Stocks
Stock Market Overview
Total Buy Breakout Stocks - 5
Quality of Breakouts - Above Average.
Stocks Screened - 6,500
Bull side - Small list of breakouts, but some interesting plays for aggressive bulls.
Stock market - Major averages turn bullish in many time sectors.
Comment - Stock market rallies as it tries to form a near-term bottom. Bulls remain alert. September tends to be bearish.
See Latest Earnings Reports - A company that tops the Street's highest earnings estimate has potential to go higher. Today's key earnings beats with a stock on the move higher: LANC, WDAY, TITN, ULTA and MOV.
Stock Market Momentum
(Daily is based on a moving average)
|
Market (Daily) |
Market (Weekly) |
Market (Monthly) |
|
Dow - Bullish |
Dow - Bullish |
Dow - Bullish |
|
Nasdaq - Bullish |
Nasdaq - Bullish |
Nasdaq - Bearish |
|
S&P 500 - Bullish |
S&P 500 - Bullish |
S&P 500 - Bullish |
 Ticker Tape Digest's
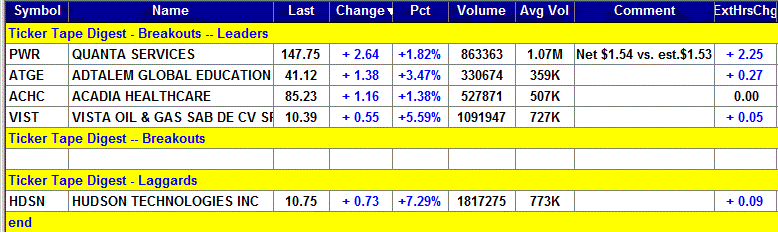
|
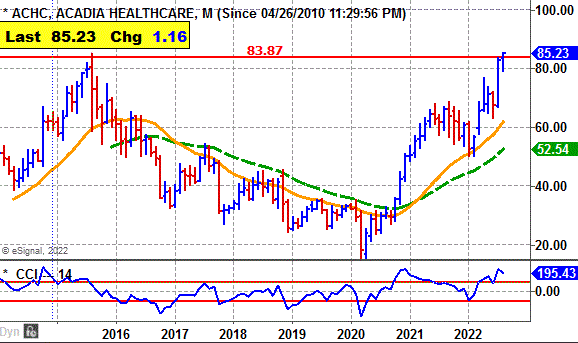
TTD's Quality Rating of Stock - ACHC - Average |
 ACHC, based in Franklin, Ten., provides behavioral healthcare services in the U.S. ACHC's stock moves higher Thursday and breaks out from a 5-week, flat base.
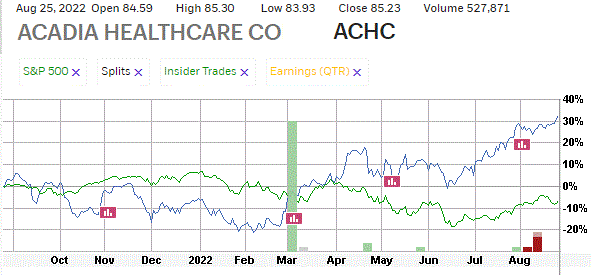
So far today ACHC is trading 527,871 shares. Its average daily volume is 507,000 shares.
TTD sees potential for more on the upside.
ACHC's stock broke out in the morning getting to $85.29.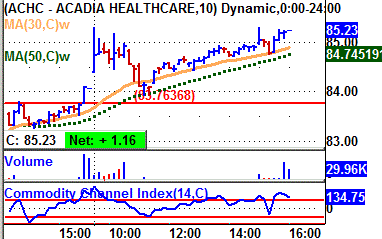
The stock then slipped back a bit to $83.93. However, it then worked steadily higher the rest of the day.
It closed near its high for the session.
In after-hours trading, ACHC was unchanged.
Tape Action
ACHC's tape action shows the recent block trades.
One can see the price for ACHC's blocks rising from $84.07 in the prior session to as high as $85.23 by the close.
A key bullish trade came in the morning when a block of 1,941 shares crossed the tape at $84.59.
That was up from the prior block at $84.07 on 2,631 shares..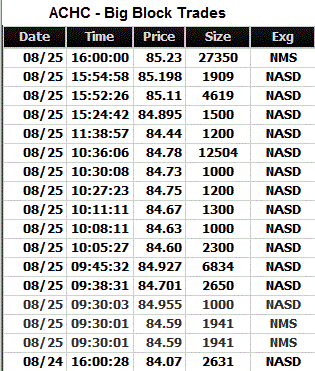
Near the close a big block of 27,350 shares crossed at $85.23.
That was up from the prior block trade at 85.19 on 1,909 shares.
Business
ACHC provides behavioral healthcare services in the U.S.
It operates inpatient psychiatric facilities, residential treatment centers, group homes, substance abuse facilities and outpatient behavioral healthcare services.
Its specialty treatment facilities include residential recovery facilities, eating disorder facilities and comprehensive treatment centers.
Charts
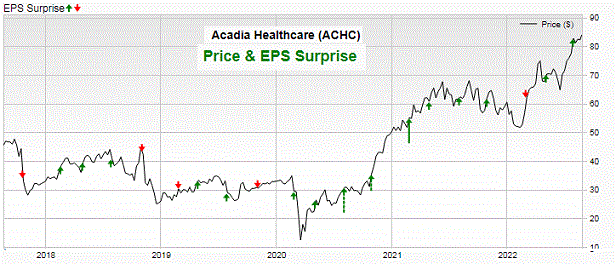
ACHC's 12-month performance chart shows the stock up 32% versus a 5% loss for the stock market.
Insiders were buyers recently at $50.75 using stock options.
They were sellers at $80 to $83 a share.
ACHC's long-term chart shows the stock declining from $54 in 2017 to $11.09 by early 2020.
The
stock then rose steadily to a peak at $85. It is in a strong long-term up trend..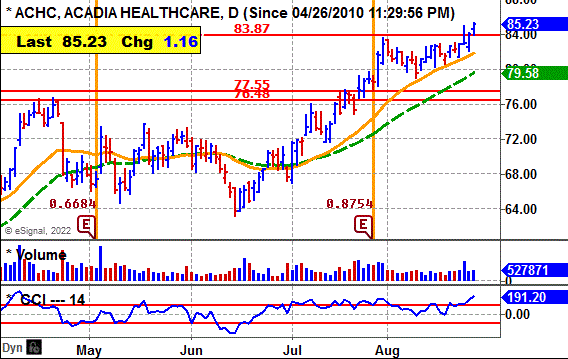
ACHC's daily chart shows the stock climbing from $64 in June to a peak at $83 by late July.
The stock put down a five-week flat base above its 30-day Moving average line.
ACHC now breaks out with modest volume.
The CCI momentum indicator is strongly bullish.
Earnings Outlook
This year, analysts forecast a 20%rise in net to $3.08 a share from the $2.56 the prior year.
For 2023, analysts project a 10 rise in earnings to $3.40 a share from the anticipated $3.08 this year.
For the third quarter, the Street predicts an 11% increase in net to $80 cents a share from the 72 cents the prior year.
Then in the fourth quarter analysts expect an 18% rise in net to 79 cents a share from the 67 cents the prior year.
Strategy Opinion: TTD is targeting ACHC for a move to $100 within the next few months or sooner. A protective stop can be placed near $80.
Intermediate-Term Rating: Average.
Suitability: Average Bulls.
TTD's special research of Stocks Prior Performance:
Breakout Success |
Bullish |
ACHC scored a big gain off a recent breakout. |
Response to Net |
Bullish |
ACHC rose 11 times after 15 earnings reports. |
Earnings Beats |
Bullish |
ACHC beat net estimates 13 times after 20 reports. |
Seasonal Success |
Bearish |
ACHC avg. loss 1.5% in Sept, gain 6.1%i n Oct. |
Stock's Prior Performance After a Breakout
Stock's % Change from Breakout to peak - prior to cut below 50-day M/A. |
Date of Breakout |
Break point Price |
Stocks Price Peak after Breakout - prior to cut below 50-day M/A |
Date Trade Closed |
15% |
7/15/2022 | 73.91 | 85.23 | Still in play |
61% |
10/30/2020 | 32.87 | 52.98 | 1/7/2021 |
(In actual trading, entry and exit points could vary depending on broker execution.
Also, ideal are breakouts to a new 52-week high or better, perhaps all-time highs. Sell point can be a cut below the 50-day M/A.)
TTD's Feature Breakout Stock
|
Long- Term Chart
|
|
Long-Term Performance Chart
|
|
12 - month Performance Chart vs. S&P 500
|
|
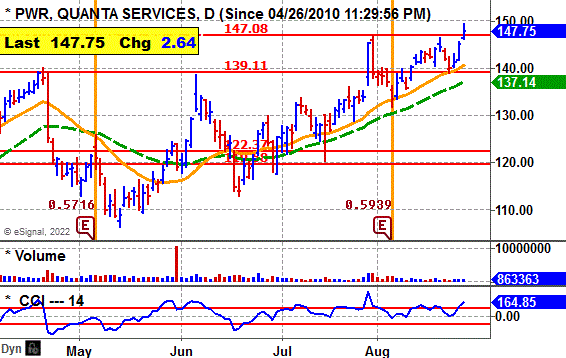
Quanta Services Inc. (PWR) - 147.75 Net to Jump 27% This Year |
|
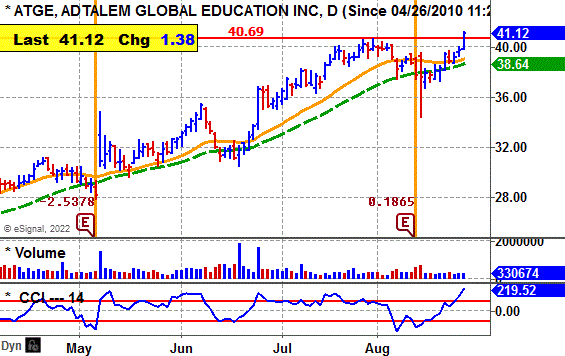
Adtalem Global Education Inc. (ATGE) - 41.12 Net to Climb 26% For fiscal 2023 (June) |
|
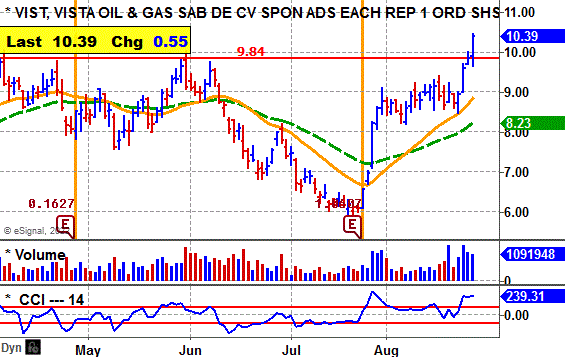
Vista Oil & Gas Inc. (VIST) - 10.39 Net to Surge 344% This Year, 23% in 2023 |
|
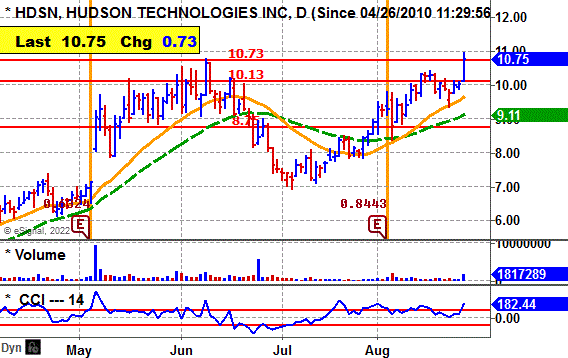
Hudson Technologies Inc.(HDSN) - 10.75 Net to Jump 159% This Year |
TTD's Feature Stock Under Accumulation
|
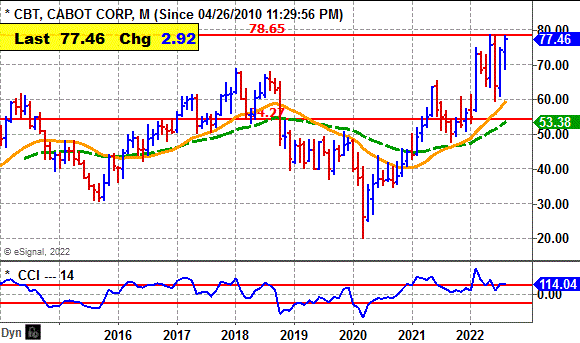
TTD's Quality Rating of Stock - CBT - Average |
CBT, base in Boston, makes specialty chemicals. Annual revenues: $4 billion. CBT's stock rises sharply Thursday. 
CBT is now close to breaking out from its three-month, cup-and-handle base.
TTD suggests accumulation in anticipation of a breakout.
CBT's stock moved higher in the morning to $77.46.
The stock then pulled back slightly and consolidated the rest of the morning.
CBT then worked steadily higher the rest of the day and closed near its high for the year. 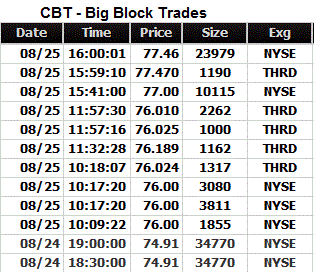
The stock was unchanged in after-hours trading.
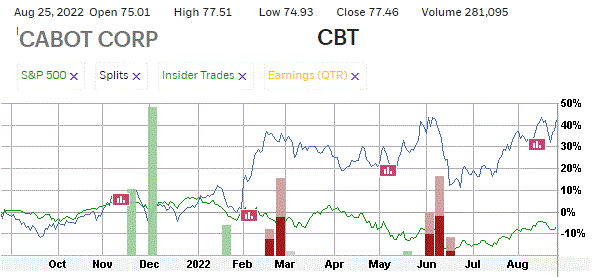
Tape Action
CBT's tape action shows the recent block trades.
One can see the prices for the blocks rising from $74.91 in the prior session to as high as $77.47 near the close.
A key bullish trade came in the morning when a block of 1,855 shares crossed the tape at $76.
That was up from the prior block at $74.91 on 34,770 shares.
Business
CBT produces specialty chemicals and performance materials.
The reinforcement Materials segment combines the reinforcing carbons and engineered elastomer composites product lines.
The performance chemicals segment is made up of specialty carbons, fumed metal oxides, battery materials and aerogel products
The company serves the transportation, infrastructure, environment and consumer markets.
Charts
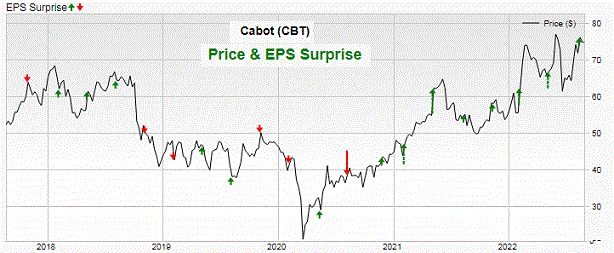
CBT's 12-month performance chart shows the stock up 41% versus an 8% loss for the stock market.
Insider were buyers at $35.25 to $62.24 a share using stock options.
They were sellers at $69 to $78.13 a share.
CBT's long-term chart shows the stock climbing from $36 in 2016 to a peak at $68 by late 2018. 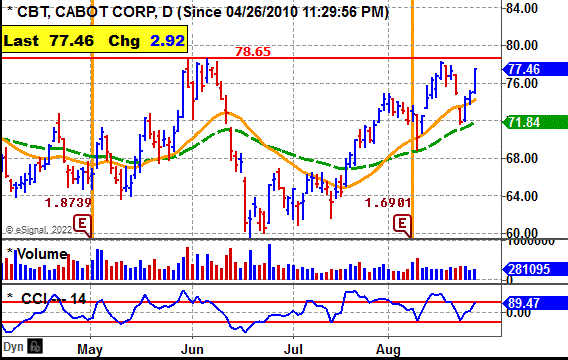
However, the stock took a dive down to $20 during the bear market in early 2020.
Since, then CBT has worked higher to $77.
CBT's daily chart shows the stock peaking at $78 in June.
The stock fell back and rallied back to $77,
CBT moves higher today and now is close to a breakout.
The CCI momentum indicator is bullish.
Earnings Outlook
This fiscal year ending in September, analysts project a 23% jump in earnings to $6.19 a share from the $5.02 a year ago.
Going out to fiscal 2023 ending in September, the Street predicts a 17% rise in net to $7.16 a share from the anticipated $6.19 this year.
For the fiscal fourth quarter ending in September, net should leap 37% to $1.52 a share from the $1.11 the prior year.
Then for the fiscal first quarter of 2023 ending in December the Street predicts a 72% surge in net to $2.22 a share from the $1.29 the previous year.
That is bullish - an acceleration quarterly earnings growth.
Strategy Opinion: TTD suggests accumulation in CBT in anticipation of a breakout over $78.88.
TTD is targeting CBT for a move to $94 within the next few months after a breakout. A protective stop can be placed near $75 after a breakout.
Intermediate -Term Rating: Average.
Suitability: Aggressive Bulls.
TTD's special research of Stocks Prior Performance:
Breakout Success |
Bullish |
CBT scored small gains off recent breakouts. |
Response to Net |
Bullish |
CBT rose 10 times after 15 earnings report. |
Earnings Beats |
Bullish |
CBT beat net estimate 13 times in 20 quarters. |
Seasonal Success |
Bearish |
CBT avg. gain 0.3% in Sept., loss 3.6% in Oct.. |
Stock's Prior Performance After a Breakout
Stock's % Change from Breakout to peak - prior to cut below 50-day M/A. |
Date of Breakout |
Break point Price |
Stocks Price Peak after Breakout - prior to cut below 50-day M/A |
Date Trade Closed |
14% |
2/8/2022 |
65.13 | 74.10 | 2/18/2022 |
16% |
4/27/2021 |
55.84 | 64.76 | 6/1/2021 |
12% |
12/23/2020 |
43.65 | 48.93 | 1/14/2021 |
(In actual trading, entry and exit points could vary depending on broker execution.
Also, ideal are breakouts to a new 52-week high or better, perhaps all-time highs. Sell point can be a cut below the 50-day M/A.)
|
Long-Term Performance Chart
|
|
Stock's Price Performance after Reporting Earnings
|
|
Stock Performance Chart with Earnings Markers vs. S&P 500 Insider Buying in Green
|
TTD's Key Stocks Under Accumulation
|
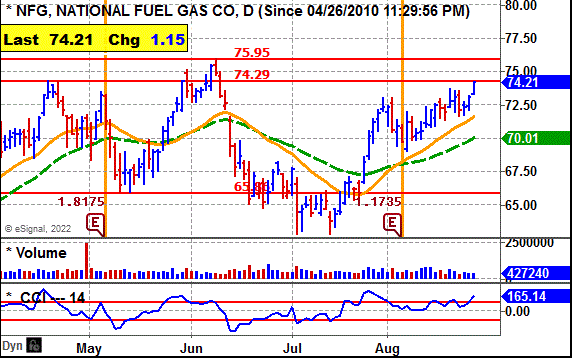
National Fuel Gas Co. (NFG) - 74.21 Set a Stop Buy at 76.20 to Catch the Breakout Net to Climb 38% for Fiscal 2022 (Sept.)
|
|
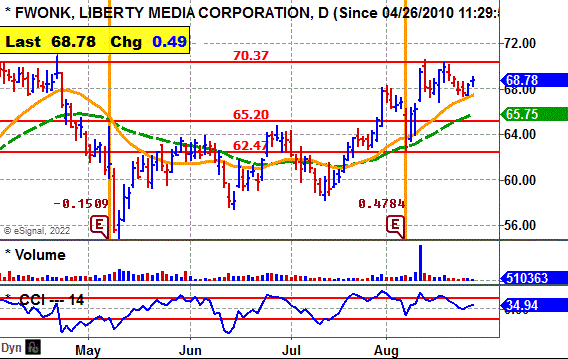
Liberty Media Corp. (FWONK) - 68.78 Set a Stop Buy at 70.60 to Catch the Breakout Net to Rise This Year, Soar 71% in 2023 |
 Ticker Tape DigestÆs
Ticker Tape DigestÆs Daily List of ōStocks To Sell or Sell Shortö ranks stocks well timed to be sold immediately based on daily trading. The list can be used as an alert to reduce current long-term positions.
Shorts from tape action - Stocks Screened - 6,500
Long-Term Environment for Bears: 1
Bear Side - Only one short play bears be conservative.
|
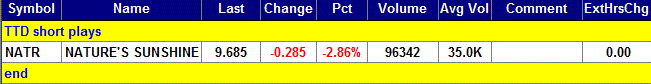
TTD's Quality Rating of Stock - NATR - Below Average |
NATR, based in Lehi, Utah, makes and sells nutritional and personal care products. Annual revenues: $444 million. NATR's stock moves lower Thursday and undercuts key technical support. 
So far today, NATR is trading 96,342 shares, more than double its average daily volume of 35,000 shares.
TTD sees more on the downside.
NATR's stock fell sharply in the morning and undercut key technical support.
The stock then trended sideways through most of the day.
There was some selling near the close. 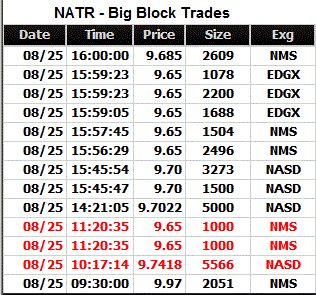
Tape Action
NATR's tape action shows the recent block trades.
One can see the price for the blocks falling from $9.97 in the morning to as low as $9.65.
A key bearish trade came in the morning when a block of 5,568 shares crossed at $9.74. That was down from the prior block at $9.97 on 2,051 shares at the opening.
Business
NATR sells nutritional and personal care products.
The company has four segments: Asia, Europe, North America, and Latin America.
Its segments operate under the Nature's Sunshine Products and Synergy WorldWide brands.
Its products are grouped into six principal categories, such as general health, immune, cardiovascular, digestive, personal care and weight management.
Charts
NATR's daily chart shows the stock cutting below key technical support. .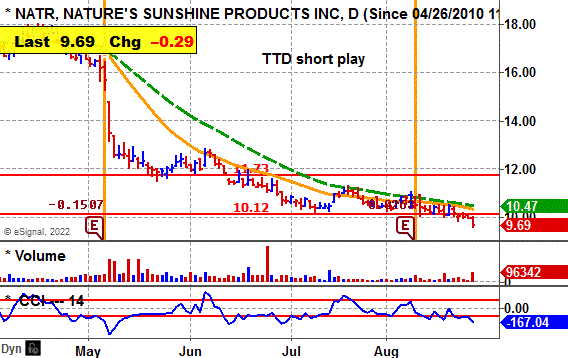
The decline comes with a pickup in volume. move resumes the stock's down trend.
NATR's CCI momentum indicator is very bearish.
Earnings:
This year, analysts expect a profit of 25 cents a share, down from the $1.41 the prior year.
It recently reported second quarter net of 3 cents a share compared with 32 cents the prior year.
Strategy Opinion: TTD is targeting NATR for a decline to $7.80 within the next few months or sooner.
A protective stop buy can be placed near $10.20.
Suitability: Aggressive Bears.
TTD's Stock Probability research of Prior Performance:
|
Response to Net |
Bearish |
NATR rose 4 times after 9 earnings reports. |
|
Seasonal Success |
Bearish |
NATR avg. loss 6.1% in Sept.., gain 3.2% in Oct. |
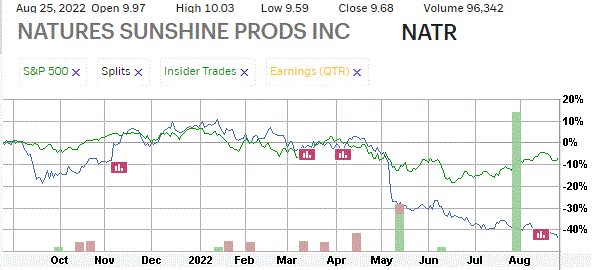
Stock's Performance Chart with Quarterly Earnings Markers vs. S&P 500
Insider Buying in Green - Insider Selling in Red
Guide: Symbol=Ticker, Name=Corporate name, Entry is the buy price to enter on the breakout, Last=prior close, Change=change from last close to prior, Date=date of price of close etc, Gain in blue is price above breakpoint (entry), Gain in red is price below breakpoint (entry)., % Gain in blue is % over breakpoint (entry), Gain in red is % below breakpoint (entry)
Copyright --- Ticker Tape Digest - 2022
TTD columnist Leo Fasciocco has covered the stock market for over 30 years. His articles appear in many publications. He has also been a speaker at the Money Show conferences. He has been on television and radio. He is author of many educational articles about stock investing and the book ōGuide To High-Performance Investing.ö

For information to subscribe to the Ticker Tape Digest Services call: Beverly Owen at 1-480-704-3331 or 480-878-8381
Distributed by Corona Publishing Enterprises. Ticker Tape Digest Inc. 1220 W. Sherri, Gilbert, Az. 85233.
TTD ōProfessional Reportö is available on the Web: $100 per month. Password needed. Published daily - around 20 times a month.
TTD Pro Report includes a Morning chart slide show of breakout stocks, a Midsession video-audio show with commentary on breakout stocks and shorts and a Final end of day overall report on breakout stocks for the session, short plays and accumulation plays. There are other features too such as Quick Trades and Long-term Plays.
TTD Daily Report is $39. It covers a Morning slide show of charts of stocks breaking out and a TTD end of day print report covering breakout stocks and shorts.
Credit cards accepted. Payable to Corona Publishing Enterprises.
(The information contained has been prepared from data deemed reliable but there is no guarantee of complete accuracy. Ticker Tape Digest Inc. is not affiliated with any broker, dealer or investment advisor. Nothing in this publication constitutes an offer, recommendation or solicitation to buy or sell any securities. Further research is advised. This report is copyrighted and no redistribution is permitted with out permission.)