|
|
|
Daily - Go to TTD's Chart scroller of Breakout Stocks - Wednesday - October 26, 2022 |
|
|
|
(WMV video player download for Google) https://videoconverter.iskysoft.com/play-video/wmv-player-for-chrome.html Go to Video Show - "How to Make Money With Breakout Stocks |
|---|

By Leo Fasciocco -- TTD
Ticker Tape Digest presents its daily stock market report containing stocks to go long as Breakout Trades, Quick Trades, or Bargain Accumulation Trades.
We also feature stocks under Significant Accumulation that are poised to breakout.
|
Ticker Tape Digest's Daily schedule guide for TTD subscribers 1. Pre-market - check Breakout Watch List and Quick Trades. 2. Morning - (11:30 - 12 A.M.) - check breakout stocks tape and breakout chart slide show. 3. Midday (1 P.M.) check TTD Midsession Report and see market video show. 4. After close (4 P.M.) check final TTD Report for day. Trading Strategies Bullish Aggressive Investors Bullish - "Breakout Stocks" - ideally suited for bull markets and special situation stocks. Potential for large returns. (See Performance) Aggressive Investor Bullish- "Quick Trade Stocks" -ideally suited for entry into top performing issues looking for a small quick profit." (See Performance) Conservative Investors "Bargain Buy Trades for the Long Term." Ideally suited for entry into top performing big cap stocks on pullbacks within overall up trend.(See Performance) Bearish Aggressive Bearish Investors - "Breakdown Stocks" to Sell Short. Ideally suited for bear markets or market pull backs. Potential for large returns (See Performance) |
|---|
The TTD report also contains stocks to short as breakdown plays and as bargain (swing trade) shorts.
Investors should tend to try to go with a strategy that fits with the stock market's trend, unless there is a special situation play.
TTD's Breakout Stocks - Long are
most suitable for aggressive investors seeking ideal entry points into leading stocks, especially during bull markets. They can do extremely well in bull markets with gains of as much as several hundred percent. 
These stocks can also do extremely well during strong market rallies, or if they are in a industry group that is performing very well. They tend to have strong earnings outlooks and are near new-52 week, or all-time highs.
TTD Swing - Quick Trade Stocks - Long These are leading issues that have pulled back in recent days, but could move higher soon. They are most suitable for Aggressive Investors willing to trade short term. These stocks will do extremely well during market advances. They have about 74% win rate. During market rally sequences the win rate is even higher. The return is small 3% to 8% in just a few days.
TTD also presents Stocks To Sell or Sell Short. These issues are suitable for aggressive investors willing to take short positions both as trades or for longer-term plays. These stocks will do very well during bear markets or market pull backs.
TTD's Bearish breakdown stocks to sell short. These issues have potential to fall sharply. They often show a technical breakdown and also some fundamental business problem such as weak earnings.
TTD's multi-media updates include a slide-show that presents charts and analysis at midsession. Some times TTD presents feature analysis on stocks and the market. TTD uses Windows Media Files. (WMV).
TTD also presents a "Breakout Watch List" that is up dated daily. This list consists of key stocks in position to breakout. A close watch of this list can put you in the stock just as it breaks out. A good idea is to study the list and be ready to move into a stock quickly as it hits its breakpoint.
TTD often suggests using stop buy orders to enter. It is very important to buy a breakout stock as close as possible to the breakpoint. The idea is to get "elbow room" if the stock should follow through to the upside. This is very important in being successful in making big money with breakout stocks.
It is also essential to have a stop loss strategy for all stocks in which positions are taken. Not every stock will work as expected. It is important for investors to "police" their portfolios and avoid getting trapped in any bad positions.
Quality rating of breakout Two key factors: 1 - Stock near all-time high in price or near a 52-week high. 2 - earnings growth current year is strong. The ideal play is a stock with an Above Average Quality Rating. The stock is near a new high and will have strong earnings. TTD's other ratings are Average and Below Average.
TTD also has special feature sections on Educational Tips on Investing.
To email Mr. Leo Fasciocco leo@tickertapedigest.com.
For service, email Beverly Owen owen@tickertapedigest.com. TTD’s Tel: 1-480-878-8381 or 480-704-3331.
Wednesday - October 26, 2022
TTD's Breakout Stocks
Stock Market Overview
Total Buy Breakout Stocks - 4
Quality of Breakouts - Below Average.
Stocks Screened - 6,500
Bull side - Small list of breakouts and very selective. Bulls be conservative.
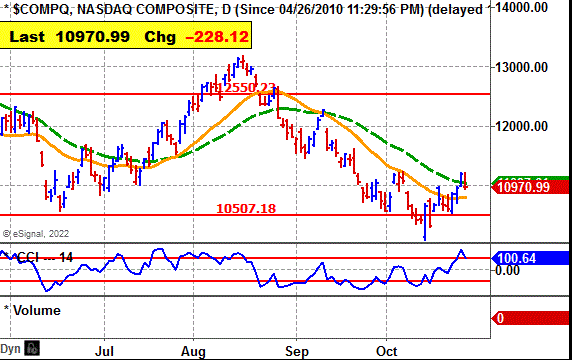
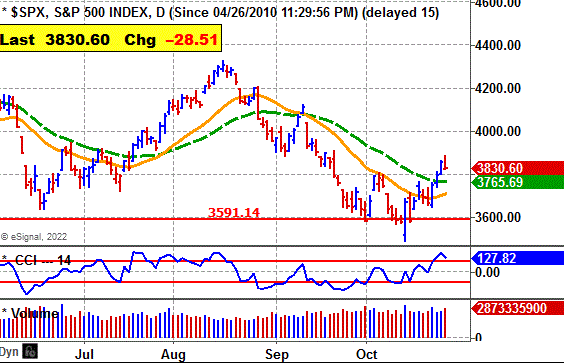
Stock market - Major averages are bullish daily, and the Dow weekly. Other averages are bearish.
Comment - Stock market rally is now running out of gas. Market vulnerable.
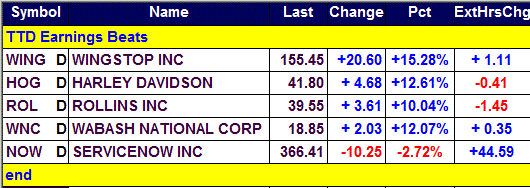
See Latest Earnings Reports - A company that tops the Street earnings estimate has good chances to move higher.
Key Earnings Beats - Wednesday
Stock Market Momentum
(Daily is based on a moving average)
|
Market (Daily) |
Market (Weekly) |
Market (Monthly) |
|
Dow - Bullish |
Dow - Bullish |
Dow - Bearish |
|
Nasdaq - Bullish |
Nasdaq - Bearish |
Nasdaq - Bearish |
|
S&P 500 - Bullish |
S&P 500 - Bearish |
S&P 500 - Bearish |
 Ticker Tape Digest's
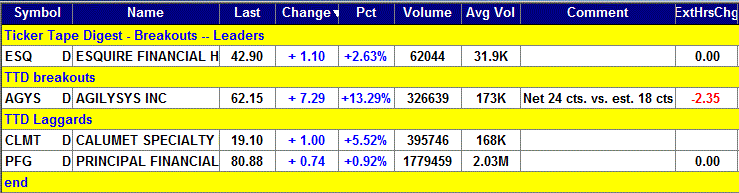
|
TTD's Quality Rating of Stock - ESQ - Above Average |
ESQ, based in Jericho, N.Y., operates through its subsidiary, Esquire Bank.Annual revenues $41.5 million. ESQ's stock moves higher Thursday clearing its 2-month, cup-and-handle base. 
So far today, ESQ is trading 62,044 shares, double its average daily volume of 32,000 shares.
ESQ is a small cap play. However, TTD sees potential for more on the upside.
ESQ's stock had a gap move higher in the morning to clear its base.
The stock reached an intraday peak in the early afternoon.
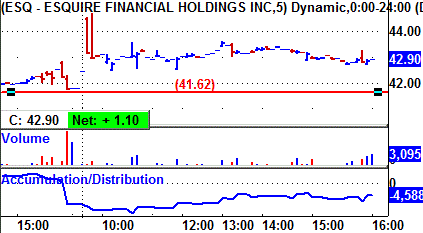
The stock then drifted back a bit in the afternoon. The stock was unchanged in after hours trading.
Tape Action
ESQ's tape action chart shows steady buying through most of the morning sending the stock slightly higher.
In the afternoon, the stock showed light selling pressure.
Late in the day, there was good buying near the close.
Business
ESQ operates through its subsidiary, Esquire Bank (the Bank.
The bank is a full-service commercial bank serving the financial needs of the legal industry and small businesses nationally, as well as retail customers in the New York.
The Bank offers tailored products and solutions to the legal community and their clients, as well as payment processing to small businesses.
Its services include law firm banking services, merchant services, commercial real estate services, and business and personal banking services.
The Bank operates a payment processing platform through third party independent sales organizations.
Charts
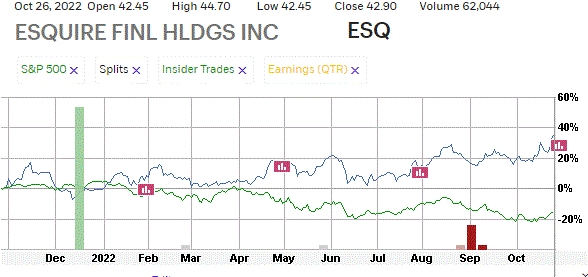
ESQ's 12-month performance chart shows the stock up 35% versus a 16% loss for the stock market.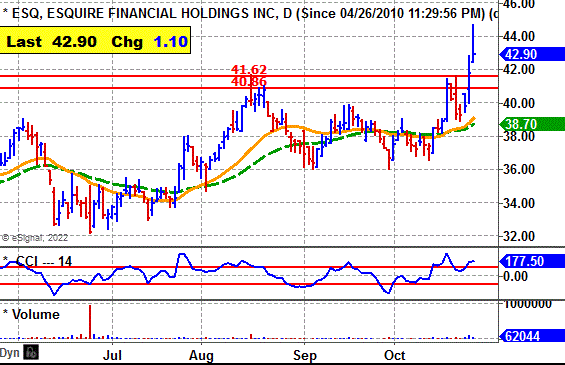
Insiders were buyers recently at $12.50 using stock options.
They were sellers at $37 to $38 a share.
ESQ's long-term chart shows the stock rising from $15 in 2017 to $29 by 2018.
The stock then fell back to $10.83 in 2020 due to the bear market.
ESQ has since rallied strongly to $42.
FIX's daily chart shows the stock rising from $31 in June to a peak at $41 by August.
The stock based and now breaks out clearing a break point zone.
The CCI momentum indicator is strongly bullish.
Earnings Outlook
This year, analysts forecast a 52% jump in net to $3.21 a share from the $2.11 the prior year.
For 2023, analysts predict a 19% gain in earnings to $3.81 a share from the anticipated $3.21 this year.
For the fourth quarter, the Street predicts a 32% increase in net to 91 cents a share from the 69 cents the year before.
Then in the first quarter of 2023 analysts expect a 35% rise in net to 89 cents a share from 66 cents the year before.
Strategy Opinion: TTD is targeting ESQ for a move to $50 within the next few months or sooner.
A protective stop can be placed near $39.
Intermediate-Term Rating: Average.
Suitability: Conservative Bulls.
TTD's special research of Stocks Prior Performance:
Breakout Success |
Bullish |
ESQ scored a big gain off a recent breakout. |
Response to Net |
Bullish |
ESQ rose 9 times after 9 earnings reports. |
Earnings Beats |
Bullish |
ESQ beat net estimates 7 times after 11 reports. |
Seasonal Success |
Bullish |
ESQ avg. gain 6.6% in Nov., loss 1.9% in Dec. |
Stock's Prior Performance After a Breakout
Stock's % Change from Breakout to peak - prior to cut below 50-day M/A. |
Date of Breakout |
Break point Price |
Stocks Price Peak after Breakout - prior to cut below 50-day M/A |
Date Trade Closed |
7% |
8/9/2022 | 38.20 | 40.76 | 8/19/2022 |
9% |
11/10/2021 | 33.91 | 36.98 | 11/15/2021 |
84% |
9/28/2021 | 20.06 | 36.98 | 11/15/2021 |
TTD's Feature Breakout Stock
|
Long- Term Chart
|
|
Long-Term Performance Chart |
|
12 - month Performance Chart vs. S&P 500
|
|
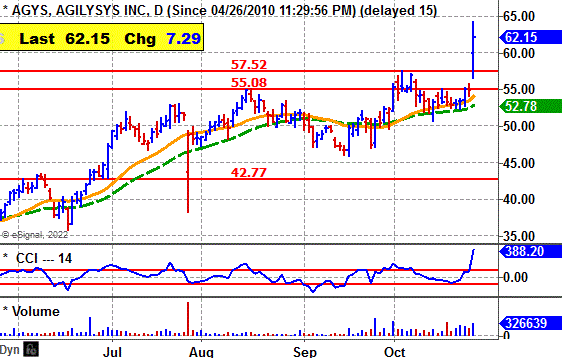
Agilysys Inc. (AGYS) - 62.15 Breakpoint - 57.52 Profits To Rise 10% For Fiscal 2023 (March)
|
|
Calumet Specialty Products (CLMT) - 19.10 Breakpoint - 18.47 Small Loss seen This year, big jump in Net in 2023
|
|
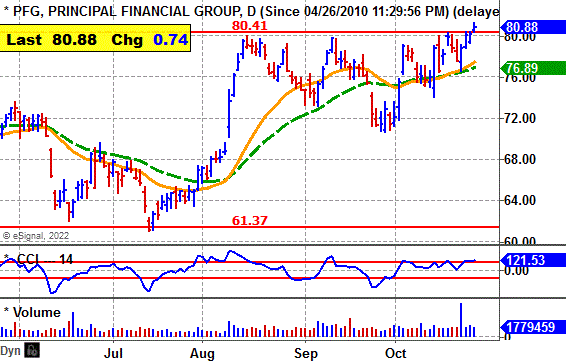
Principal Financial Group (PFG) - 80.88 Breakpoint - 80.41 Net To Decline 7% This Year, Climb 12% for 2023
|
TTD's Feature Stock Under Accumulation
|
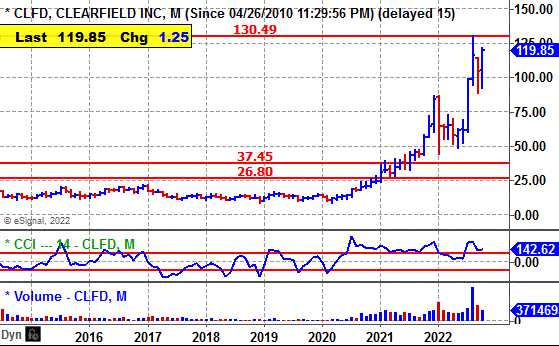
TTD's Quality Rating of Stock - CLFD - Average |
CLFD, based in  Plymouth, Min., makes fiber optic management, protection, and delivery products for communications networks. Annual revenues: $141 million. CLFD's stock moves higher Wednesday and is close to breaking out from its 2-month, cup-and-handle base.
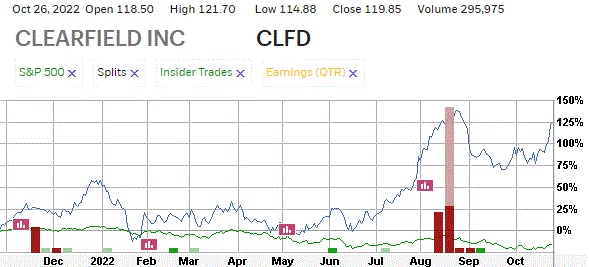
So far today, CLFD is trading 295,998 shares. Its average daily volume is 226,000 shares.
TTD suggests accumulation in anticipation of a breakout.
CLFD's stock fell in the morning to $114.88. However, the stock bounced back and climbed to an intraday high of $121.69 later in the morning.
The stock pulled back again later in the early afternoon It once again rallied back.
Tape Action
CLFD's tape action shows good accumulation in the morning.
However,there was selling at midday.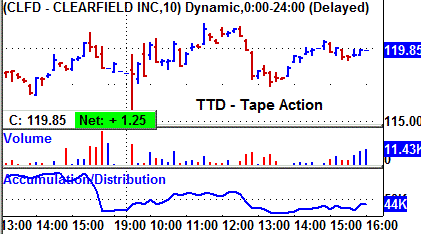
Late in the day the stock lifted with a pick up in buying in the final hour.
Business
CLFD makes fiber optic management, protection, and delivery products for communications networks.
It provides fiber management, fiber protection, and fiber delivery products that accelerate the turn-up of gigabit speed bandwidth to residential homes, businesses, and network infrastructure in the wireline and wireless access network.
It provides contract manufacturing services for its customers which include original equipment manufacturers requiring copper and fiber cable assemblies built to their specifications.
Charts
CLFD's 12-month performance chart shows the stock up 125% versus a 14% loss for the stock market.
Insiders were sellers at $102 to $110 a share
They were buyers at $12 using stock options. They bought in the open market at $57.
CLFD's long-term chart shows the stock rising from $8.22 back in 2020 to a peak at $86 by late 2021.
The stock based and then broke out and climbed to an all-time high of $130 in August. It is now basing. 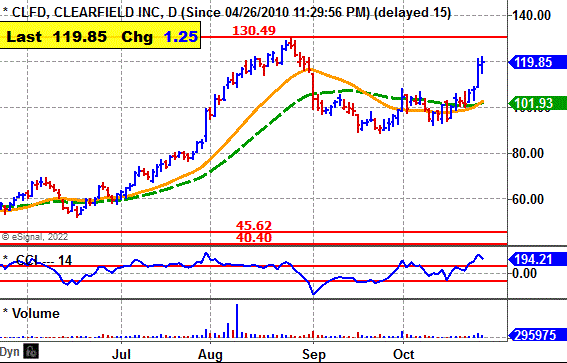
CLFD's daily chart shows the stock rising from $60 in June to a peak at $130 by late August.
The stock has since pulled back and has now forming a cup-and-handle base.
The CCI momentum indicator is strongly bullish.
Earnings Outlook
This year, analysts forecast a 113% jump in net to $3.13 a share from the $1.47 the prior year.
Going out to 2023, they see net rising 15% to $3.60 a share from the anticipated $3.13 this year.
Quarterly net will be very strong.
For the third quarter, the Street predicts a 51% jump in net to 80 cents a share from the 53 cents the year before.
Then in the fourth quarter, net should be up 13% to 85 cents a share from 75 cents the prior year.
Strategy Opinion: TTD suggests accumulation CLFD in anticipation of a breakout. TTD is targeting CLFD for a move to $145 within the next few months or sooner after a breakout.
A protective stop can be placed near $114.
Intermediate-Term Rating: Average.
Suitability: Aggressive Bulls.
TTD's special research of Stocks Prior Performance:
Breakout Success |
Bullish |
CLFD scored big gains off recent breakouts. |
Response to Net |
Bullish |
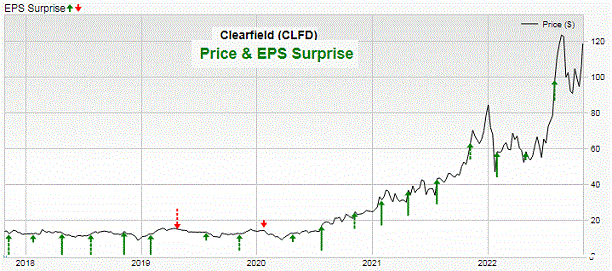
CLFD rose 10 times after 15 earnings reports. |
Earnings Beats |
Bullish |
CLFD beat net estimates 17 times after 20 reports. |
Seasonal Success |
Bullish |
CLFD avg. gain 7.9% in Nov., gain 10.2% in Dec. |
Stock's Prior Performance After a Breakout
Stock's % Change from Breakout to peak - prior to cut below 50-day M/A. |
Date of Breakout |
Break point Price |
Stocks Price Peak after Breakout - prior to cut below 50-day M/A |
Date Trade Closed |
83% |
7/7/2022 | 69.47 | 127.28 | 8/24/2022 |
19% |
12/15/2021 | 70.51 | 84.09 | 12/29/2021 |
49% |
10/5/2021 | 47.16 | 70.25 | 11/12/2021 |
(In actual trading, entry and exit points could vary depending on broker execution.
Also, ideal are breakouts to a new 52-week high or better, perhaps all-time highs. Sell point can be a cut below the 50-day M/A.)
|
Long-Term Performance Chart
|
|
Stock's Price Performance after Reporting Earnings
|
|
Stock Performance Chart with Earnings Markers vs. S&P 500 -Insider Buying
|
TTD's Key Stocks Under Accumulation
|
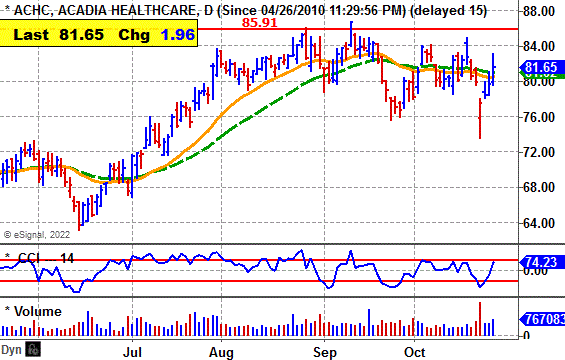
Acadia Healthcare Co. (ACHC) - 81.65 Set a Stop Buy at 86.20 to Catch the Breakout Profits To Rise 20% This Year, 10% in 2023
|
|
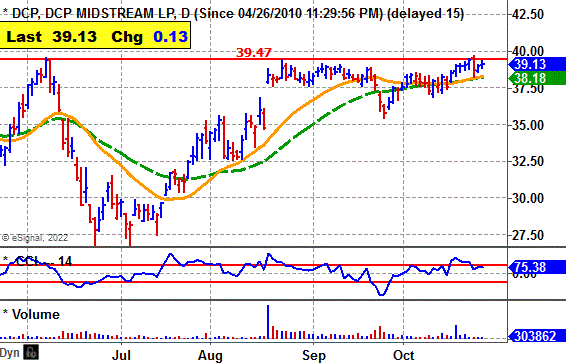
DCP Midstream Lp (DCP) - 39.13 Set a Stop Buy at 39.60 to Catch the Breakout Net to Soar 130% This Year, 28% in 2023 |
 Ticker Tape Digest’s
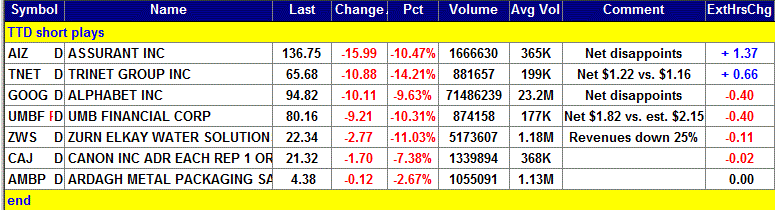
Ticker Tape Digest’s Daily List of “Stocks To Sell or Sell Short” ranks stocks well timed to be sold immediately based on daily trading. The list can be used as an alert to reduce current long-term positions.
Shorts from tape action - 7
Stocks Screened - 6,500
Long-Term Environment for Bears: Favorable.
Bear Side - Small list of shorts, but some interesting plays. Nasdaq rally run now looks to be out of gas.
|
TTD's Quality Rating of Stock - GOOG - Below Average |
GOOG, based in Mountain View, CA., is known as Alphabet Inc. It is a holding company for Alphabet Inc. It is a holding company for Google Services, Google Cloud, and Other Bets
GOOG reports disappointing earnings due to a slow down in ad revenues.
So far today, GOOG is trading a heavy 71.7 million shares, triple its average daily volume of 23 million shares.
TTD sees more on the downside.
GOOG recently went through a 20-for-1 stock split recently. 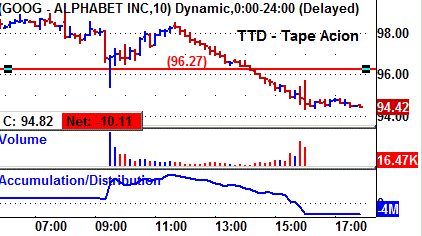
GOOG rose slightly in the morning. However, at that the stock trended lower.
Tape Action
GOOG's tape action chart shows the AD falling sharply late in the morning with light volume.
The stock continued lower and there was heavy selling into the final bell.
Business
GOOG's operations include Google Services, Google Cloud, and Other Bets. The Google Services segment includes products and services such as ads, Android, Chrome, hardware, Google Maps, Google Play, Search, and YouTube.
Google Cloud includes Google's infrastructure and platform services and collaboration tools.
The Other Bets segment includes earlier stage technologies that are further afield from its core Google business, and it includes the sale of health technology and Internet services.
Charts
GOOG's long-term chart shows the stock soaring from $51 in 2019 to a peak at $151 in 2021. 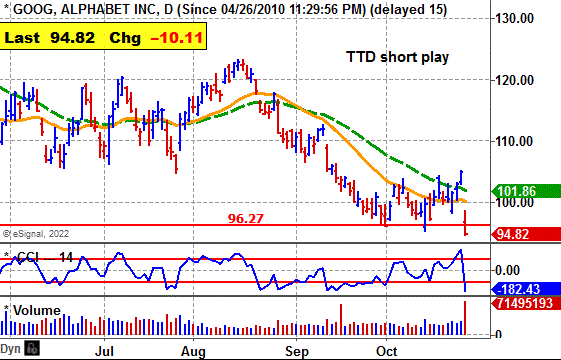
The stock has since tumbled to $94.
GOOG's daily chart shows the stock peaking at $123 in August and then falling to $96 by September. .
The stock tried to rally but now gaps lower with big volume.
.The move undercuts key technical support at $96.27.
That is very bearish.
The CCI momentum indicator is extremely bearish too.
Earnings:
This year, the Street sees GOOG's net falling 9% to $5.08 a share from the $5.61 the prior year.
For 2023, they see net rising 14% to $5.79 a share from the anticipated $5.08 this year.
Net for the fourth quarter should drop 10% to $1.38 a share from the $1.53 the year before.
Then in the first quarter of 2023, they see a 12% rise in net to $1.38 a share from the $1.23 the prior year.
However, GOOG missed on earnings the past three quarters.
Strategy Opinion: TTD is targeting GOOG for a decline to $80 within the next few months or sooner.
A protective stop buy can be placed near $100.
Suitability: Aggressive Bears.
TTD's Stock Probability research of Prior Performance:
|
Response to Net |
Bullish |
GOOG rose 9 times after 13 earnings report |
|
Seasonal Success |
Bullish |
GOOG avg. gain 2.5% in Nov., loss 0.5% in Dec. |
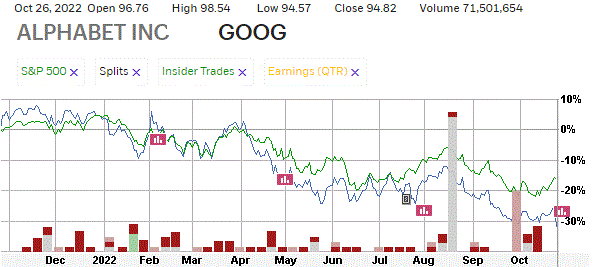
Stock's Performance Chart with Quarterly Earnings Markers vs. S&P 500
Insider Buying in Green - Insider Selling in Red
Guide: Symbol=Ticker, Name=Corporate name, Entry is the buy price to enter on the breakout, Last=prior close, Change=change from last close to prior, Date=date of price of close etc, Gain in blue is price above breakpoint (entry), Gain in red is price below breakpoint (entry)., % Gain in blue is % over breakpoint (entry), Gain in red is % below breakpoint (entry)
Copyright --- Ticker Tape Digest - 2022
TTD columnist Leo Fasciocco has covered the stock market for over 30 years. His articles appear in many publications. He has also been a speaker at the Money Show conferences. He has been on television and radio. He is author of many educational articles about stock investing and the book “Guide To High-Performance Investing.”

For information to subscribe to the Ticker Tape Digest Services call: Beverly Owen at 1-480-704-3331 or 480-878-8381
Distributed by Corona Publishing Enterprises. Ticker Tape Digest Inc. 1220 W. Sherri, Gilbert, Az. 85233.
TTD “Professional Report” is available on the Web: $100 per month. Password needed. Published daily - around 20 times a month.
TTD Pro Report includes a Morning chart slide show of breakout stocks, a Midsession video-audio show with commentary on breakout stocks and shorts and a Final end of day overall report on breakout stocks for the session, short plays and accumulation plays. There are other features too such as Quick Trades and Long-term Plays.
TTD Daily Report is $39. It covers a Morning slide show of charts of stocks breaking out and a TTD end of day print report covering breakout stocks and shorts.
Credit cards accepted. Payable to Corona Publishing Enterprises.
(The information contained has been prepared from data deemed reliable but there is no guarantee of complete accuracy. Ticker Tape Digest Inc. is not affiliated with any broker, dealer or investment advisor. Nothing in this publication constitutes an offer, recommendation or solicitation to buy or sell any securities. Further research is advised. This report is copyrighted and no redistribution is permitted with out permission.)