|
|
|
Daily - Go to TTD's Chart scroller of Breakout Stocks - Friday - November 4, 2022 |
|
|
|
(WMV video player download for Google) https://videoconverter.iskysoft.com/play-video/wmv-player-for-chrome.html
Go to Video Show - "How to Make Money With Breakout Stocks |
|---|

By Leo Fasciocco -- TTD
Ticker Tape Digest presents its daily stock market report containing stocks to go long as Breakout Trades, Quick Trades, or Bargain Accumulation Trades.
We also feature stocks under Significant Accumulation that are poised to breakout.
|
Ticker Tape Digest's Daily schedule guide for TTD subscribers 1. Pre-market - check Breakout Watch List and Quick Trades. 2. Morning - (11:30 - 12 A.M.) - check breakout stocks tape and breakout chart slide show. 3. Midday (1 P.M.) check TTD Midsession Report and see market video show. 4. After close (4 P.M.) check final TTD Report for day. Trading Strategies Bullish Aggressive Investors Bullish - "Breakout Stocks" - ideally suited for bull markets and special situation stocks. Potential for large returns. (See Performance) Aggressive Investor Bullish- "Quick Trade Stocks" -ideally suited for entry into top performing issues looking for a small quick profit." (See Performance) Conservative Investors "Bargain Buy Trades for the Long Term." Ideally suited for entry into top performing big cap stocks on pullbacks within overall up trend.(See Performance) Bearish Aggressive Bearish Investors - "Breakdown Stocks" to Sell Short. Ideally suited for bear markets or market pull backs. Potential for large returns (See Performance) |
|---|
The TTD report also contains stocks to short as breakdown plays and as bargain (swing trade) shorts.
Investors should tend to try to go with a strategy that fits with the stock market's trend, unless there is a special situation play.
TTD's Breakout Stocks - Long are most suitable for aggressive investors seeking ideal entry points into leading stocks, especially during bull markets. They can do extremely well in bull markets with gains of as much as several hundred percent.
These stocks can also do extremely well during strong market rallies, or if they are in a industry group that is performing very well. They tend to have strong earnings outlooks and are near new-52 week, or all-time highs.
TTD Swing - Quick Trade Stocks - Long These are leading issues that have pulled back in recent days, but could move higher soon. They are most suitable for Aggressive Investors willing to trade short term. These stocks will do extremely well during market advances. They have about 74% win rate. During market rally sequences the win rate is even higher. The return is small 3% to 8% in just a few days.
TTD also presents Stocks To Sell or Sell Short. These issues are suitable for aggressive investors willing to take short positions both as trades or for longer-term plays. These stocks will do very well during bear markets or market pull backs.
TTD's Bearish breakdown stocks to sell short. These issues have potential to fall sharply. They often show a technical breakdown and also some fundamental business problem such as weak earnings.
TTD's multi-media updates include a slide-show that presents charts and analysis at midsession. Some times TTD presents feature analysis on stocks and the market. TTD uses Windows Media Files. (WMV).
TTD also presents a "Breakout Watch List" that is up dated daily. This list consists of key stocks in position to breakout. A close watch of this list can put you in the stock just as it breaks out. A good idea is to study the list and be ready to move into a stock quickly as it hits its breakpoint.
TTD often suggests using stop buy orders to enter. It is very important to buy a breakout stock as close as possible to the breakpoint. The idea is to get "elbow room" if the stock should follow through to the upside. This is very important in being successful in making big money with breakout stocks.
It is also essential to have a stop loss strategy for all stocks in which positions are taken. Not every stock will work as expected. It is important for investors to "police" their portfolios and avoid getting trapped in any bad positions.
Quality rating of breakout Two key factors: 1 - Stock near all-time high in price or near a 52-week high. 2 - earnings growth current year is strong. The ideal play is a stock with an Above Average Quality Rating. The stock is near a new high and will have strong earnings. TTD's other ratings are Average and Below Average.
TTD also has special feature sections on Educational Tips on Investing.
To email Mr. Leo Fasciocco leo@tickertapedigest.com.
For service, email Beverly Owen owen@tickertapedigest.com. TTD’s Tel: 1-480-878-8381 or 480-704-3331.
Friday - November 4, 2022
TTD's Breakout Stocks
Stock Market Overview
Total Buy Breakout Stocks - 1
Quality of Breakouts - Above Average
Stocks Screened - 6,500
Bull side - Just one breakout stock. One needs to watch earnings very closely now. About 1,500 earnings to be reported the coming week.
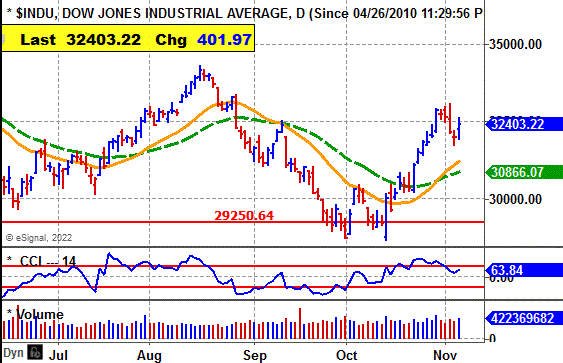
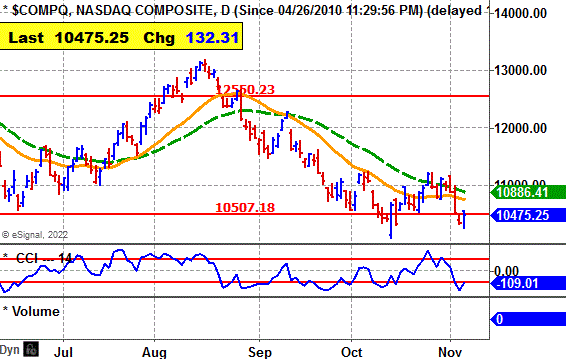
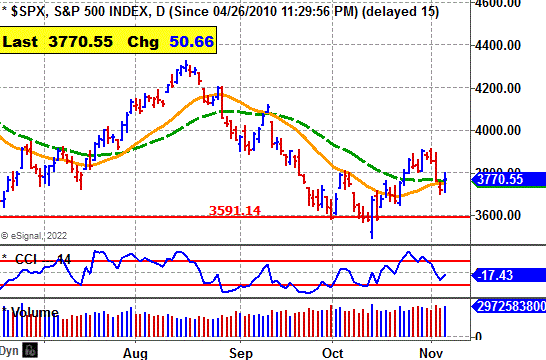
Stock market - Dow and S&P 500 bullish daily and weekly. The key is the Nasdaq is bearish in all time sectors.
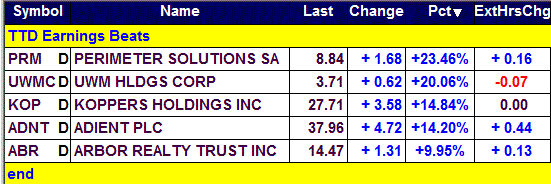
See Latest Earnings Reports - A company that tops the Street earnings estimate has good chances to move higher.
Key Earnings Beat Stocks For The session
Stock Market Momentum
(Data is based on a moving average)
|
Market (Daily) |
Market (Weekly) |
Market (Monthly) |
|
Dow - Bullish |
Dow - Bullish |
Dow - Bearish |
|
Nasdaq - Bearish |
Nasdaq - Bearish |
Nasdaq - Bearish |
|
S&P 500 - Bullish |
S&P 500 - Bullish |
S&P 500 - Bearish |
 Ticker Tape Digest's
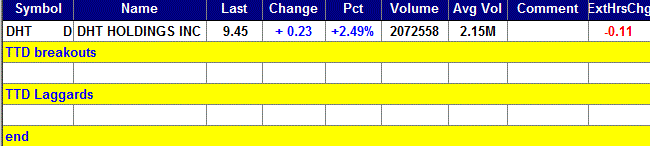
|
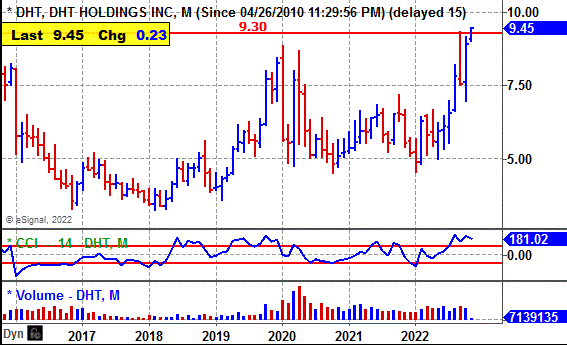
TTD's Quality Rating of Stock - DHT - Above Average |
DHT, based in Hamilton, the Bahamas, operates a fleet of oil tankers. Annual revenues: $296 million. DHT's stock moves higher Friday and breaks out from a 7-week, cup-and-handle base.

So far today, DHT is trading 2.1 million shares. Its average daily volume is 2.2 million hares.
Oil tanker stocks are hot. TTD sees potential for more on the upside.
DHT's stock moved higher in the morning and cleared its breakpoint line.
However the stock faded in the late morning and dropped to $9.30.
Then it came on steadily the rest of the day to clear its breakpoint line
It finished near its high for the session of $9.46. That is bullish.
Tape Action
DHT's tape action shows the stock moving higher in the morning with light accumulation. 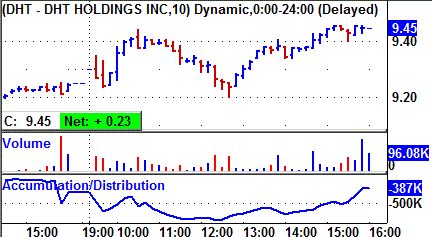
Then later in the morning it fell back and the ADline went south
However, in the afternoon, DHT reversed course.
The stock steamed higher very good accumulation.
The close on the high for the day is bullish.
Business
DHT operates 26 large oil tankers.
The company operates through integrated management companies in Monaco, Singapore and Norway.
DHT’s operating VLCCs has a combined carrying capacity of 8,043,657 deadweight tons (dwt). The Company's VLCCs fleets operates in time charters and spot market.
Charts
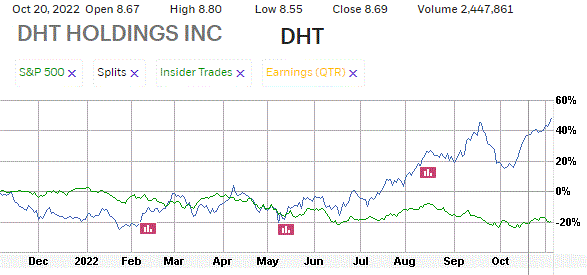
DHT's 12-month performance chart shows the stock up 48% versus a 19% loss for the stock market.
DHT's long-term chart shows the stock rising from $3.60 in 2019 to $8.83 by late 2019.
It fell to $4.50 in early 2020. However, it has since worked to $9.45. 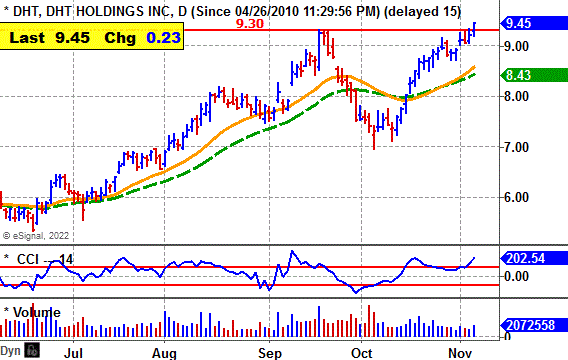
The daily chart shows the stock climbing from $5.80 in June to $9.30 by September..
DHT pulled back and formed a cup-and-handle base.
The breakout clears the base with a pickup in volume.
The CCI momentum indicator is bullish.
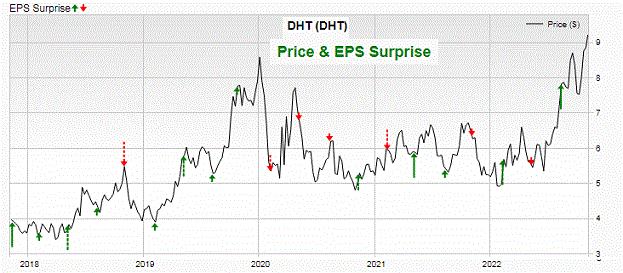
Earnings Outlook
This year, analysts predict a profit of 9 cents a share versus a loss of 23 cents the prior year.
Going out to 2023, the Street projects a big jump in net to $1.03 a share from the anticipated 9 cents this year.
.For the third quarter, net should come in at 4 cents a share versus a loss of 15 cents the year before.
Then in the fourth quarter net should jump to 25 cents a share from the loss of 5 cents the prior year.
The company beat the Street estimate two out of the past four quarters..
Strategy Opinion: TTD is targeting DHT for a move to $12 within the next few months. A protective stop can be placed near $8.50.
Intermediate -Term Rating: Above Average.
Suitability: Aggressive Bulls.
TTD's special research of Stocks Prior Performance:
Breakout Success |
Bullish |
DHT scored big gains off recent breakouts. |
Response to Net |
Bullish |
DHT rose 8 times after 15 earnings report. |
Earnings Beats |
Bearish |
DHT beat net estimate 8 times in 20 quarters. |
Seasonal Success |
Bearish |
DHT avg. loss 2.5% in Nov., Loss 1.2% in Dec.. |
Stock's Prior Performance After a Breakout
Stock's % Change from Breakout to peak - prior to cut below 50-day M/A. |
Date of Breakout |
Break point Price |
Stocks Price Peak after Breakout - prior to cut below 50-day M/A |
Date Trade Closed |
34% |
7/18/2022 |
6.49 | 8.71 | 9/16/2022 |
28% |
10/2/2019 |
6.24 | 7.96 | 10/30/2019 |
TTD's Feature Breakout Stock
|
Long- Term Chart
|
|
Long-Term Performance Chart |
|
12 - month Performance Chart vs. S&P 500
|
TTD's Feature Stock Under Accumulation
|
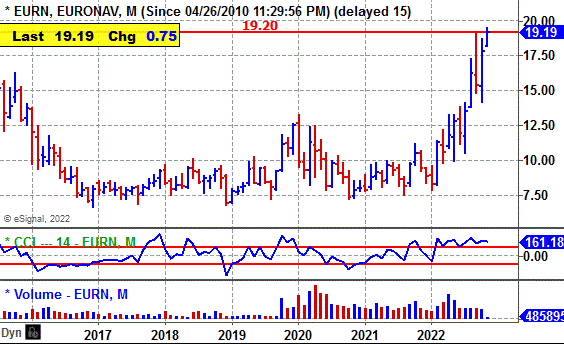
TTD's Quality Rating of Stock - EURN - Above Average |
EURN, based in Antwerpen, Belgium, transports and stores crude oil and petroleum products. Annual revenues: $420 million. EURN's stock moves higher Friday and breaks out from its 8-week, cup-and-handle base.

So far today, EURN is trading 1.1 million shares, the same as its average daily volume.
EURN's stock has been in a strong up trend like many oil related stocks this year.
TTD sees potential for more on the upside.
EURN's stock drove sharply higher in the morning and reached an intraday high of $19.44.
The stock fell back around midday to its low for the session of $18.68.
However, the stock came on again and pushed higher in the afternoon. 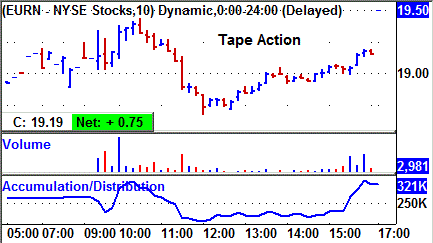
In after-hours trading the stock was up 26 cents a share.
Tape Action
EURN's tape action shows the stock rising in the morning with strong accumulation.
However, the stock was pulled lower later in the morning with some heavy selling pressure.
Nevertheless, it worked higher in the afternoon.
Late in the day it showed strong accumulation. That is bullish.
Business
EURN transports and stores petroleum products. The company provides shipping via its fleet of large tankers.
The company operates crude oil tankers on the international markets and the floating production, storage and offloading operations.
. Its group companies include Euronav Ship Management SAS, Euronav Shipping NV, Euronav Tankers NV, Euronav SAS, Euronav UK Ltd., Euronav Hong Kong Ltd. and Great Hope Enterprises Ltd.
Charts
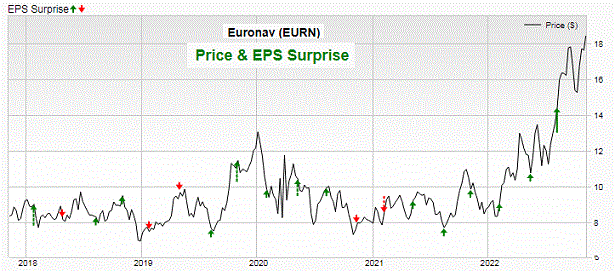
EURN's 12-month performance chart shows the stock up 80% versus an 18% loss for the stock market.
Insider activity was not available
EURN's long-term chart shows the stock rising from $7.20 in 2020 when the bear market hit to as high $14 by mid-2020.
It based and then ran up to $19.44.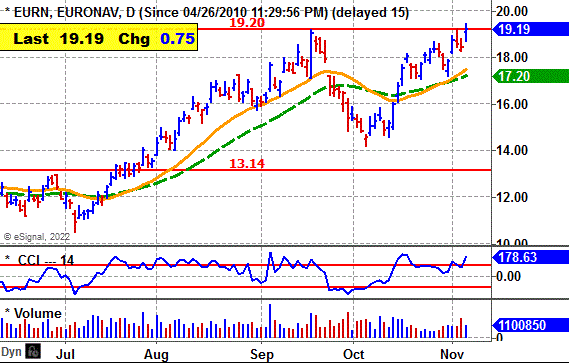
The stock has now put down a cup-and-handle base. That is very bullish.
EURN's daily chart shows the stock rising from $11 in July to $19 in September.
The stock has now formed a very good cup-and-handle base.
The CCI momentum indicator is bullish.
Earnings Outlook
This year, analysts forecast a profit of 50 cents a share versus a loss of $1.75 a share he year before.
That gives the stock a p/e ratio of just 38.
For 2023, analysts project a big 268% surge in earnings to $1.84 a share from the anticipated 50 cents this year.
For the fourth quarter, the Street predicts a profit of 17 cents a share from the loss of 53 cents the year before.
Then in the fourth quarter net should come in at 57 cents a share versus a loss of 38 cents the year before.
Strategy Opinion: TTD suggests accumulation EURN in anticipation of a breakout. TTD is targeting EURN for a move to $25 within the next few months or sooner after a breakout.
A protective stop can be placed near $17.90.
Intermediate-Term Rating: Average.
TTD's special research of Stocks Prior Performance:
Breakout Success |
Bullish |
EURN scored big gains off recent breakouts. |
Response to Net |
Bullish |
EURN rose 8 times after 15 earnings reports. |
Earnings Beats |
Bullish |
EURN beat net estimates 13 times after 20 reports. |
Seasonal Success |
Bullish |
EURN avg. loss 0.2% in Nov. loss 2.6% in Dec. |
Stock's Prior Performance After a Breakout
Stock's % Change from Breakout to peak - prior to cut below 50-day M/A. |
Date of Breakout |
Break point Price |
Stocks Price Peak after Breakout - prior to cut below 50-day M/A |
Date Trade Closed |
46% |
8/1/2022 | 13 | 19.02 | 9/19/2022 |
24% |
2/11/2022 | 9.53 | 11.84 | 3/8/2022 |
24% |
9/22/2021 | 8.97 | 11.11 | 10/19/2021 |
(In actual trading, entry and exit points could vary depending on broker execution.
Also, ideal are breakouts to a new 52-week high or better, perhaps all-time highs. Sell point can be a cut below the 50-day M/A.)
|
Long-Term Performance Chart
|
|
Stock's Price Performance after Reporting Earnings
|
|
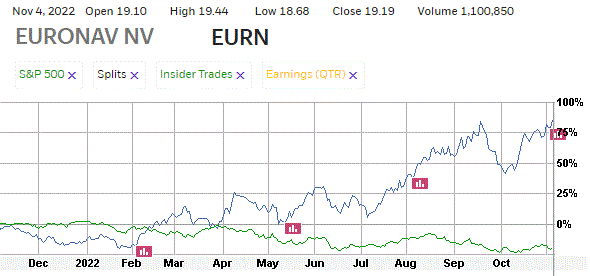
Stock Performance Chart with Earnings Markers vs. S&P 500 -Insider Buying
|
TTD's Key Stocks Under Accumulation
|
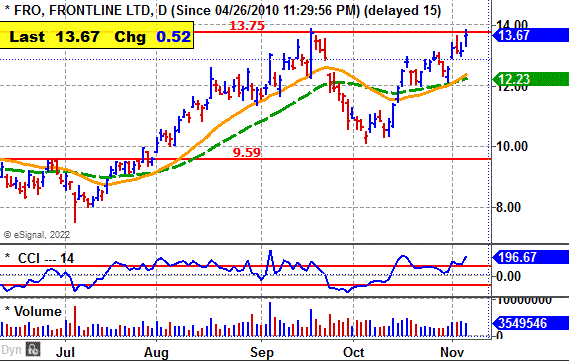
Frontline Ltd. (FRO) - 13,67 Set a Stop Buy at 13.90 to Catch the Breakout Profits To Jump This Year , Spurt 79% Next Year
|
|
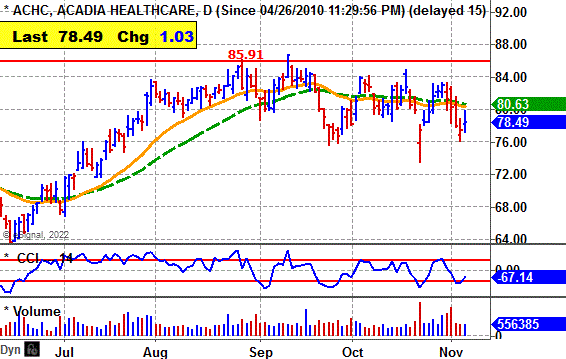
Acadia Healthcare Co, (ACHC) - 78.49 Set a Stop Buy at 86.10 to Catch the Breakout Net to Climb 21% This Year, Rise 9% in 2023 |
 Ticker Tape Digest’s
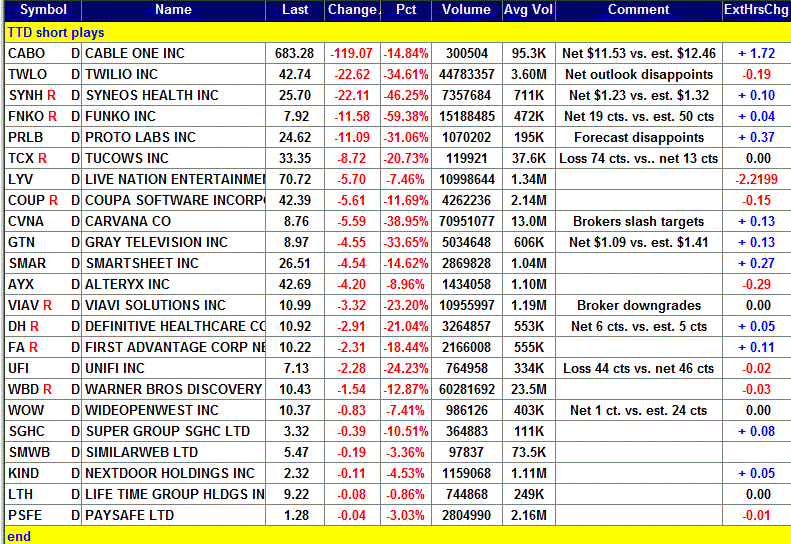
Ticker Tape Digest’s Daily List of “Stocks To Sell or Sell Short” ranks stocks well timed to be sold immediately based on daily trading. The list can be used as an alert to reduce current long-term positions.
Shorts from tape action - 23
Stocks Screened - 6,500
Long-Term Environment for Bears: Favorable.
Bear Side - Large list of shorts as many stocks breakdown due to earnings disappointments.
|
TTD's Quality Rating of Stock - FNKO - Below Average |
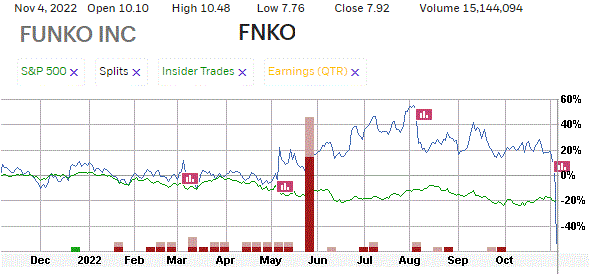
FNKO, based in Everett, Wa., sells pop culture consumer products, featuring characters from media and entertainment content, including movies. Annual revenues: $1 billion. FNKO's stock plunges Friday and undercuts key technical support. 
TTD sees more on the downside.
Annual revenues: $1.5 billion. MED's stock falls sharply Thursday and undercuts key technical support.
FNKO's stock fell in the morning and undercut support.
The stock trended lower into mid-afternoon . It then trended sideways into the final bell.
In after-hours trading FNKO was up 3 cents a share. 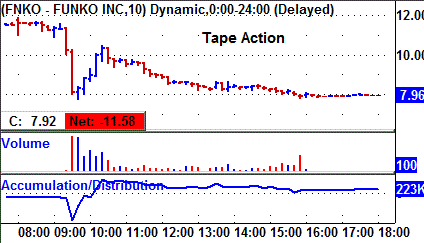
Tape Action
FNKO's tape action chart shows the stock falling sharply in the morning with heavy volume.
However, the stock lifted. The tape would indicate is was probably short covering or bargain hunting.
However, the stock then worked lower the rest of the day with modest selling pressure.
The stock was unchanged in after-hours trading.
Business
FNKO sells pop culture consumer products, featuring characters from a range of media and entertainment content, including movies, TV shows, video games, music and sports.
It also sells fashion accessories including bags, backpacks and wallets; apparel; board games, keychains, pens and pins. It also sells t-shirts and hats; homewares including drinkware and other home accessories.
;The firm sells through a network of retail customers, including specialty retailers, mass-market retailers, and e-commerce sites.
Charts
FNKO's stock gapped sharply to the downside. The big drop came on big volume too. 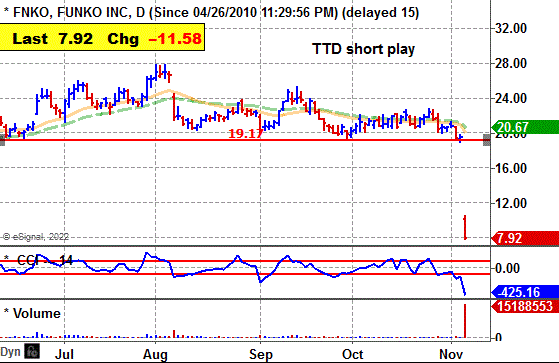
The CCI momentum indicator is extremely bearish.
Earnings:
This year, analysts have been forecasting a 34% increase in net to $1.90 a share from the $1.42 the prior year.
However, FNKO reported net for the third quarter of 28 cents a share, down from the 39 cents the year before.
The Street was estimating net at 50 cents a share.
So, it was a big miss and the stock fell hard.
Strategy Opinion: TTD is targeting FNKO for a further decline to $6.30 within the next few months or sooner.
A protective stop buy can be placed near $8.80.
Suitability: Aggressive Bears.
TTD's Stock Probability research of Prior Performance:
|
Response to Net |
Bullish |
FNKO rose 19 times after 20 earnings report |
|
Seasonal Success |
Bearish |
FNKO avg. loss 12.9% in Nov., gain 10.3% in Dec. |
Stock's Performance Chart with Quarterly Earnings Markers vs. S&P 500
Insider Buying in Green - Insider Selling in Red
Guide: Symbol=Ticker, Name=Corporate name, Entry is the buy price to enter on the breakout, Last=prior close, Change=change from last close to prior, Date=date of price of close etc, Gain in blue is price above breakpoint (entry), Gain in red is price below breakpoint (entry)., % Gain in blue is % over breakpoint (entry), Gain in red is % below breakpoint (entry)
Copyright --- Ticker Tape Digest - 2022
TTD columnist Leo Fasciocco has covered the stock market for over 30 years. His articles appear in many publications. He has also been a speaker at the Money Show conferences. He has been on television and radio. He is author of many educational articles about stock investing and the book “Guide To High-Performance Investing.”

For information to subscribe to the Ticker Tape Digest Services call: Beverly Owen at 1-480-704-3331 or 480-878-8381
Distributed by Corona Publishing Enterprises. Ticker Tape Digest Inc. 1220 W. Sherri, Gilbert, Az. 85233.
TTD “Professional Report” is available on the Web: $100 per month. Password needed. Published daily - around 20 times a month.
TTD Pro Report includes a Morning chart slide show of breakout stocks, a Midsession video-audio show with commentary on breakout stocks and shorts and a Final end of day overall report on breakout stocks for the session, short plays and accumulation plays. There are other features too such as Quick Trades and Long-term Plays.
TTD Daily Report is $39. It covers a Morning slide show of charts of stocks breaking out and a TTD end of day print report covering breakout stocks and shorts.
Credit cards accepted. Payable to Corona Publishing Enterprises.
(The information contained has been prepared from data deemed reliable but there is no guarantee of complete accuracy. Ticker Tape Digest Inc. is not affiliated with any broker, dealer or investment advisor. Nothing in this publication constitutes an offer, recommendation or solicitation to buy or sell any securities. Further research is advised. This report is copyrighted and no redistribution is permitted with out permission.)