|
|
|
Daily - Go to TTD's Chart scroller of Breakout Stocks - Wednesday - November 9, 2022 |
|
|
|
(WMV video player download for Google) https://videoconverter.iskysoft.com/play-video/wmv-player-for-chrome.html Go to Video Show - "How to Make Money With Breakout Stocks |
|---|

By Leo Fasciocco -- TTD
Ticker Tape Digest presents its daily stock market report containing stocks to go long as Breakout Trades, Quick Trades, or Bargain Accumulation Trades.
We also feature stocks under Significant Accumulation that are poised to breakout.
|
Ticker Tape Digest's Daily schedule guide for TTD subscribers 1. Pre-market - check Breakout Watch List and Quick Trades. 2. Morning - (11:30 - 12 A.M.) - check breakout stocks tape and breakout chart slide show. 3. Midday (1 P.M.) check TTD Midsession Report and see market video show. 4. After close (4 P.M.) check final TTD Report for day. Trading Strategies Bullish Aggressive Investors Bullish - "Breakout Stocks" - ideally suited for bull markets and special situation stocks. Potential for large returns. (See Performance) Aggressive Investor Bullish- "Quick Trade Stocks" -ideally suited for entry into top performing issues looking for a small quick profit." (See Performance) Conservative Investors "Bargain Buy Trades for the Long Term." Ideally suited for entry into top performing big cap stocks on pullbacks within overall up trend.(See Performance) Bearish Aggressive Bearish Investors - "Breakdown Stocks" to Sell Short. Ideally suited for bear markets or market pull backs. Potential for large returns (See Performance) |
|---|
The TTD report also contains stocks to short as breakdown plays and as bargain (swing trade) shorts.
Investors should tend to try to go with a strategy that fits with the stock market's trend, unless there is a special situation play.
TTD's Breakout Stocks - Long are most suitable for aggressive investors seeking ideal entry points into leading stocks, especially during bull markets. They can do extremely well in bull markets with gains of as much as several hundred percent.
These stocks can also do extremely well during strong market rallies, or if they are in a industry group that is performing very well. They tend to have strong earnings outlooks and are near new-52 week, or all-time highs.
TTD Swing - Quick Trade Stocks - Long These are leading issues that have pulled back in recent days, but could move higher soon. They are most suitable for Aggressive Investors willing to trade short term. These stocks will do extremely well during market advances. They have about 74% win rate. During market rally sequences the win rate is even higher. The return is small 3% to 8% in just a few days.
TTD also presents Stocks To Sell or Sell Short. These issues are suitable for aggressive investors willing to take short positions both as trades or for longer-term plays. These stocks will do very well during bear markets or market pull backs.
TTD's Bearish breakdown stocks to sell short. These issues have potential to fall sharply. They often show a technical breakdown and also some fundamental business problem such as weak earnings.
TTD's multi-media updates include a slide-show that presents charts and analysis at midsession. Some times TTD presents feature analysis on stocks and the market. TTD uses Windows Media Files. (WMV).
TTD also presents a "Breakout Watch List" that is up dated daily. This list consists of key stocks in position to breakout. A close watch of this list can put you in the stock just as it breaks out. A good idea is to study the list and be ready to move into a stock quickly as it hits its breakpoint.
TTD often suggests using stop buy orders to enter. It is very important to buy a breakout stock as close as possible to the breakpoint. The idea is to get "elbow room" if the stock should follow through to the upside. This is very important in being successful in making big money with breakout stocks.
It is also essential to have a stop loss strategy for all stocks in which positions are taken. Not every stock will work as expected. It is important for investors to "police" their portfolios and avoid getting trapped in any bad positions.
Quality rating of breakout Two key factors: 1 - Stock near all-time high in price or near a 52-week high. 2 - earnings growth current year is strong. The ideal play is a stock with an Above Average Quality Rating. The stock is near a new high and will have strong earnings. TTD's other ratings are Average and Below Average.
TTD also has special feature sections on Educational Tips on Investing.
To email Mr. Leo Fasciocco leo@tickertapedigest.com.
For service, email Beverly Owen owen@tickertapedigest.com. TTD’s Tel: 1-480-878-8381 or 480-704-3331.
Wednesday - November 9, 2022
TTD's Breakout Stocks
Stock Market Overview
Total Buy Breakout Stocks - 1
Quality of Breakouts - Average.
Stocks Screened - 6,500
Bull side - Only one breakout as stock market falls sharply. Bulls be conservative.
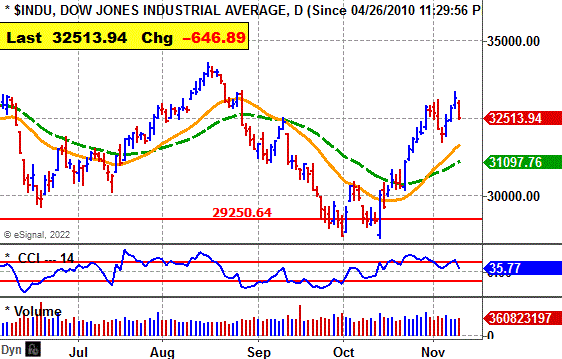
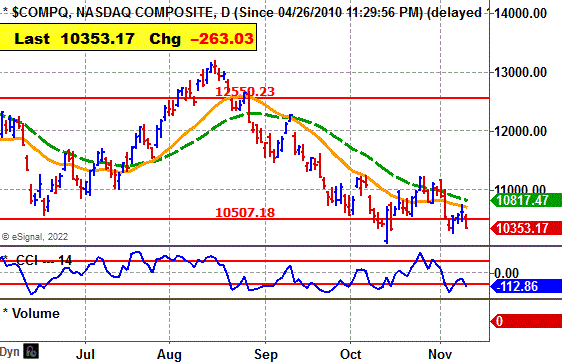
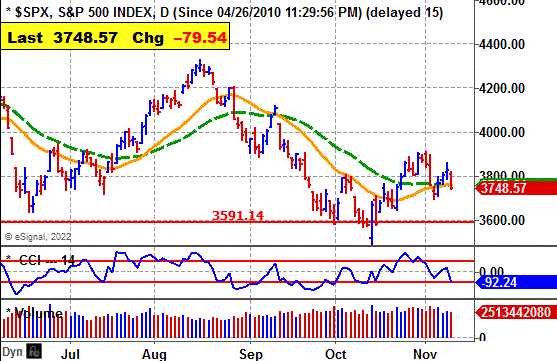
Stock market - Major averages bearish in all sectors, except the Dow daily and weekly which is bullish. Market vulnerable to more on the downside.
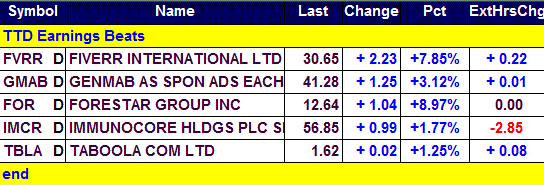
See Latest Earnings Reports - A company that tops the Street earnings estimate has good chances to move higher.
Key "Earnings Beat" Stocks For Wednesday
Stock Market Momentum
(Data is based on a moving average)
|
Market (Daily) |
Market (Weekly) |
Market (Monthly) |
|
Dow - Bullish |
Dow - Bullish |
Dow - Bearish |
|
Nasdaq - Bearish |
Nasdaq - Bearish |
Nasdaq - Bearish |
|
S&P 500 - Bearish |
S&P 500 - Bearish |
S&P 500 - Bearish |
 Ticker Tape Digest's
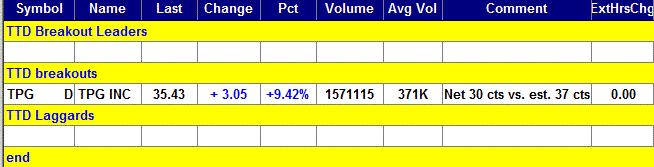
|
TTD's Quality Rating of Stock - TPG - Below Average |
TPG, based in Fort Worth, Tex., is a global asset management firm. Annual revenues:$5.3 billion. TPG's stock moves higher Wednesday and breaks out from its 2-month, cup-and-handle base.

The move carries the stock to a new all-time high. It came public late last year.
TPG is a speculative breakout because of its weak earnings outlook. The positive side is that the stock is show strong technical action.
So far today, TPG is showing strong volume.
TPG's stock moved higher in the morning and cleared its breakpoint.
It then trended sideways the rest of the day.
Tape Action
TPG's tape action chart shows strong accumulation in the morning when the stock drove higher. 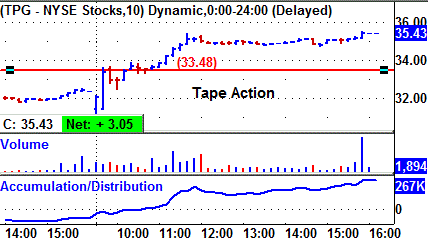
Then through the rest of the price edged higher and the accumulation picked up again the afternoon.
The close at the high of the day is very bullish, even though the stock is a bit speculative.
Business
TPG invests mostly in real estate. . The Company has five multi-product investment platforms: Capital, Growth, Impact, Real Estate and Market Solutions.
Its Capital is a large-scale private equity investing platform. Its Capital products include TPG Capital, TPG Asia, TPG Healthcare Partners and Continuation Vehicles.
Its Growth products include TPG Growth, TPG Tech Adjacencies and TPG Digital Media.
Charts
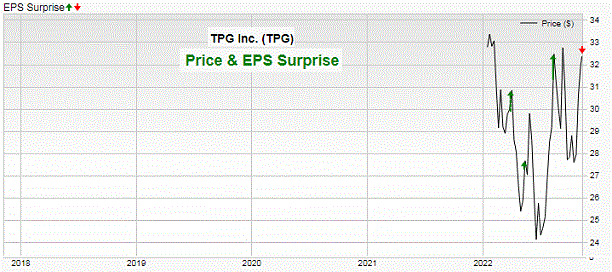
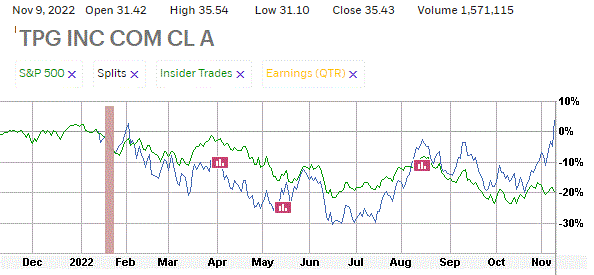
TPG's 12-month performance chart shows the stock up a big 2% versus a 19% loss for the stock market.
TPG's long-term chart shows the stock declining from $35 back in January to $25 by June.
Since then the stock has worked higher to $35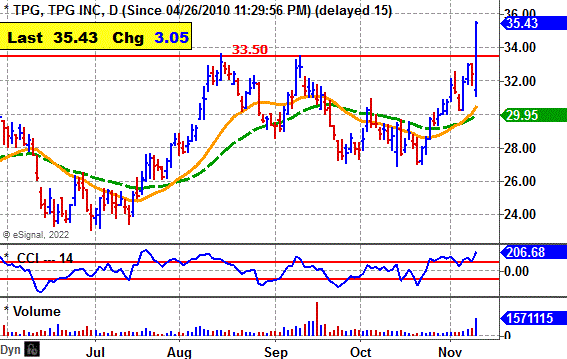
The daily chart shows the stock climbing from $24 in July to $33 by August..
TPG then pulled back and formed a cup-and-handle base.
The breakout clears the base with a good widening of the daily spread. That is technically bullish.
The CCI momentum indicator is strongly bullish.
Earnings Outlook
This year, analysts predict a 33% decline in net to $1.86 a share from the $2.79 the prior year.
Then in 2023, they see a 6% increase in net to $1.96 a share from the anticipated $1.86 this year.
Quarterly net will be weak.
Net for the fourth quarter should decline 14% to 48 cents a share from the 56 cents the year before.
Strategy Opinion: TTD is targeting EURN for a move to $31 within the next few months. A protective stop can be placed near $33.
Intermediate -Term Rating: Below Average.
Suitability: Aggressive Bulls.
TTD's special research of Stocks Prior Performance:
Breakout Success |
Bullish |
TPG scored modest gains off recent breakouts. |
Response to Net |
Neutral |
TPG rose 1 time after 2 earnings report. |
Earnings Beats |
Bullish |
TPG beat net estimate 3 times in 4 quarters. |
Seasonal Success |
Bullish |
TPG avg. gain 15.2% Breakeven in Dec. |
Stock's Prior Performance After a Breakout
Stock's % Change from Breakout to peak - prior to cut below 50-day M/A. |
Date of Breakout |
Break point Price |
Stocks Price Peak after Breakout - prior to cut below 50-day M/A |
Date Trade Closed |
% |
11/9/2022 |
38.50 | Still in play |
TTD's Feature Breakout Stock
|
Long- Term Chart
|
|
Long-Term Performance Chart
|
|
12 - month Performance Chart vs. S&P 500
|
TTD's Feature Stock Under Accumulation
|
TTD's Quality Rating of Stock - ENPH - Above Average |
ENPH, based in Fremont, Ca., is a supplier of microinverter-based solar and battery systems that enable people to harness the sun to make, their own power, and control it all with a smart mobile application. Annual revenues: $1.4 billion. ENPH's stock moves higher Wednesday and is in closer position to breakout from its two-month, cup-and-handle base.

So far today, ENPH is trading 3.3 million shares. Its average daily volume is 3.9 million shares.
TTD suggests accumulation in anticipation of a breakout.
ENPH's stock spiked higher in the morning
It reached an intraday high of $295.90.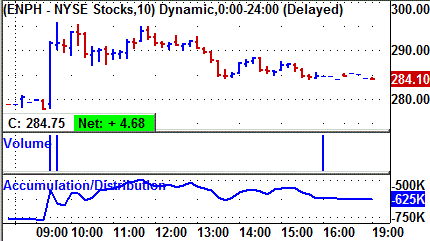
The stock then drifted back a bit in the afternoon.
In after-hours trading, the stock was down 45 cents a share.
Tape Action
ENPH's tape action shows strong buying in the morning when the stock shot higher,
The AD line was very strong.
However,it drifted back during the day with just light volume
A bullish key was strong accumulation near the close.
Business
ENPH is an energy technology company.
The firm is a supplier of microinverter-based solar and battery systems that enable people to harness the sun to make, save, and sell their own power, and control it all with a smart mobile application.
The company's semiconductor-based microinverter converts energy at the individual solar module level and, combined with its networking and software technologies that provides advanced energy monitoring and control.
Its Enphase Home Energy Solution with IQ platform, which is an integrated solar, storage and energy management offering, uses a single technology platform.
Charts
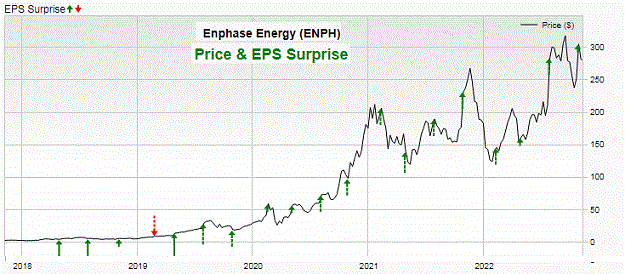
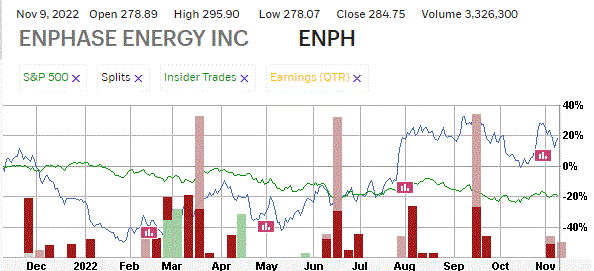
ENPH's 12-month performance chart shows the stock up 22% versus an 18% loss for the stock market.
Insider were buyers using stock options at 70 cents to $1.31 a share.
They were sellers at $193 to $297 a share.
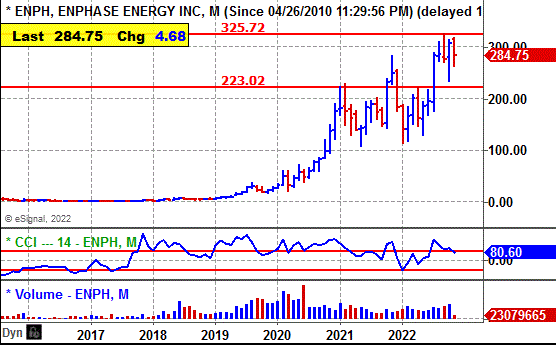
ENPH's long-term chart shows the stock rising from $17 back in 2019 to $282 by late 2021
However, the stock pulled back to $113 in early 2022. It has since come on again and is at $284.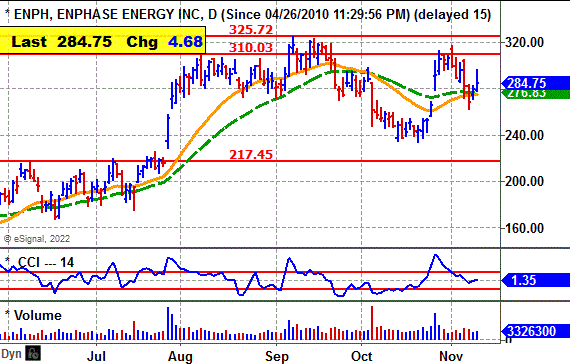
ENPH's daily chart shows the stock rising from $163 in June to $325 by September
The stock pulled back and then rallied.
The result was a good cup-and-handle base.
The CCI momentum indicator is neutral..
Earnings Outlook
This year, analysts predict a 78% jump in net to $4.28 a share from the $2.41 the prior year.
That gives the stock a p/e ratio of just 67..
For 2023, analysts project a 27% rise in earnings to $5.42 a share from the anticipated $4.28 this year.
Net for the fourth quarter should soar 71% to $1.25 a share from the 73 cents the prior year.
For the fourth quarter, the Street predicts a 44% increase in net to $1.11 a share from the 77 cents the prior year.
Strategy Opinion: TTD suggests accumulation in ENPH in anticipation of a breakout. TTD is targeting ENPH for a move to $390 within the next few months or sooner after a breakout.
A protective stop can be placed near $305 after a breakout.
Intermediate-Term Rating: Average.
TTD's special research of Stocks Prior Performance:
Breakout Success |
Bullish |
ENPH scored big gains off recent breakouts. |
Response to Net |
Bullish |
ENPH rose 12 times after 15 earnings reports. |
Earnings Beats |
Bullish |
ENPH beat net estimates 17 times after 19 reports. |
Seasonal Success |
Bullish |
ENPH avg. gain 14.3% in Nov., gain 2.2% in Dec. |
Stock's Prior Performance After a Breakout
Stock's % Change from Breakout to peak - prior to cut below 50-day M/A. |
Date of Breakout |
Break point Price |
Stocks Price Peak after Breakout - prior to cut below 50-day M/A |
Date Trade Closed |
42% |
7/27/2022 | 223 | 317.41 |
9/8/2022 |
36% |
10/26/21 | 196.40 | 267.74 |
11/19/2021 |
163% |
9/28/2020 | 81.14 | 213.76 |
1/7/2021 |
(In actual trading, entry and exit points could vary depending on broker execution.
Also, ideal are breakouts to a new 52-week high or better, perhaps all-time highs. Sell point can be a cut below the 50-day M/A.)
|
Long-Term Performance Chart
|
|
Stock's Price Performance after Reporting Earnings
|
|
Stock Performance Chart with Earnings Markers vs. S&P 500 -Insider Buying
|
TTD's Key Stocks Under Accumulation
|
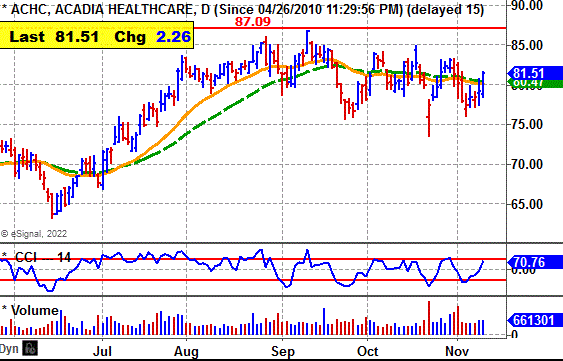
Acadia Healthcare Co. (ACHC) - 81.51 Set a Stop Buy at 87.30 to Catch the Breakout Profits To Rise 21% This Year, 8% in 2023
|
|
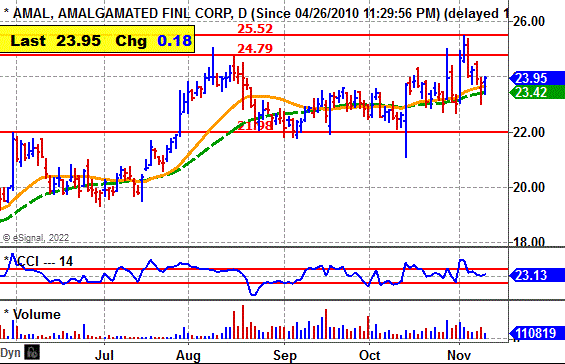
Amalgamated Financial Corp. (AMAL) - 23.95 Set a Stop Buy at 25.70 to Catch the Breakout Net to Surge 52% This Year, Climb 21% in 2023 |
 Ticker Tape Digest’s
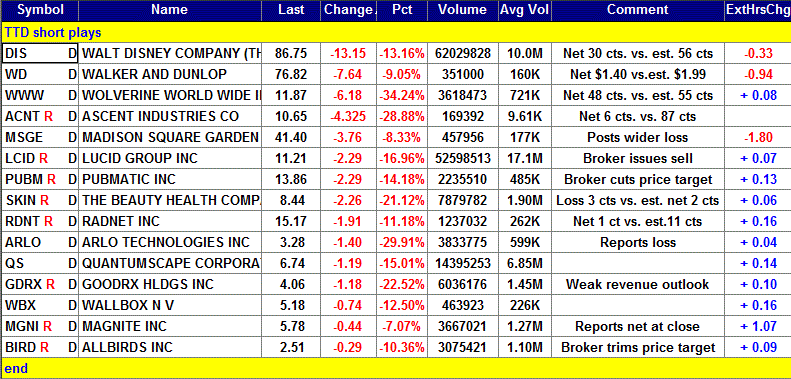
Ticker Tape Digest’s Daily List of “Stocks To Sell or Sell Short” ranks stocks well timed to be sold immediately based on daily trading. The list can be used as an alert to reduce current long-term positions.
Shorts from tape action - 15
Stocks Screened - 6,500
Long-Term Environment for Bears: Favorable.
Bear Side - Large list of shorts as stock market falls sharply. Aggressive bears can be venturesome.
|
TTD's Quality Rating of Stock - DIS - Below Average |
DIS, based in Burbank, Ca., operates theme parks and produces movies and other entertainment. Annual revenues: $67.4 billion. DIS's stock falls sharply Wednesday after reporting disappointing earnings.

So far today, DIS is trading 62 million shares , six times its average daily volume of 10 million shares.
The sharp drop came because of a big earnings miss.
TTD sees potential for more on the downside.
DIS reported net for the fiscal fourth quarter ending in September of 30 cents a share. That was well below Street estimates of 56 cents a share.
DIS's stock fell in the morning and undercut key technical support.
The stock trended lower most of the day and finished near its low for the session. That is very bearish. 
In after-hours trading, DIS was down 33 cents a share.
Tape Action
DIS's tape action chart shows the stock falling in the morning.
That was followed by clear distribution throughout the day.
There was no signs of accumulation.
That is very bearish.
Business
DIS is a worldwide entertainment company. The Company’s segments include Disney Media and Entertainment,and Disney Parks, Experiences and Products.
The company has a global film and episodic television content production unit.
DIS's DMED’s lines of business consists of Linear Networks, Direct-to-Consumer and Content Sales/Licensing.
Charts
DIS's stock gapped to the downside on a big drop. It had been in a down trend for two months and was trying to bottom and rally. However, it now rolls over with big volume. 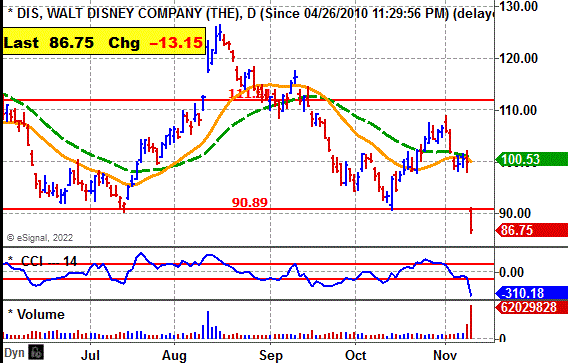
The CCI momentum indicator is extremely bearish.
Earnings:
This fiscal year ending in September of next year, analysts have been forecasting a 40% jump in net to $4.94 a share from the $3.53 the prior year.
Going out to fiscal 2024, the Street sees an 8% rise in net to $5.33 a share from the anticipated $4.94 this fiscal .
However, with the big earnings miss for the quarter, those estimates should come down.
For the fiscal first quarter ending in December, the Street predicts flat earnings at $1.06 a share.
Strategy Opinion: TTD is targeting DIS for a decline to $75 within the next few months or sooner.
A protective stop buy can be placed near $90.
Suitability: Aggressive Bears.
TTD's Stock Probability research of Prior Performance:
|
Response to Net |
Bullish |
DIS rose 8 times after 15 earnings report |
|
Seasonal Success |
Bullish |
DIS avg. gain 1.3% in Nov., gain 5.2% in Dec. |
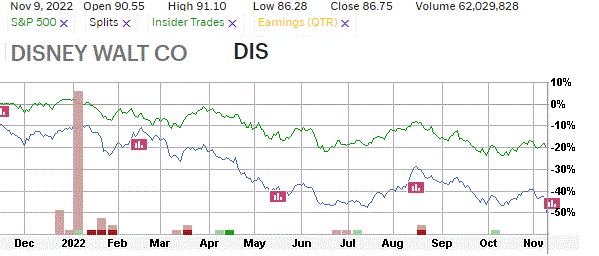
Stock's Performance Chart with Quarterly Earnings Markers vs. S&P 500
Insider Buying in Green - Insider Selling in Red
Guide: Symbol=Ticker, Name=Corporate name, Entry is the buy price to enter on the breakout, Last=prior close, Change=change from last close to prior, Date=date of price of close etc, Gain in blue is price above breakpoint (entry), Gain in red is price below breakpoint (entry)., % Gain in blue is % over breakpoint (entry), Gain in red is % below breakpoint (entry)
Copyright --- Ticker Tape Digest - 2022
TTD columnist Leo Fasciocco has covered the stock market for over 30 years. His articles appear in many publications. He has also been a speaker at the Money Show conferences. He has been on television and radio. He is author of many educational articles about stock investing and the book “Guide To High-Performance Investing.”

For information to subscribe to the Ticker Tape Digest Services call: Beverly Owen at 1-480-704-3331 or 480-878-8381
Distributed by Corona Publishing Enterprises. Ticker Tape Digest Inc. 1220 W. Sherri, Gilbert, Az. 85233.
TTD “Professional Report” is available on the Web: $100 per month. Password needed. Published daily - around 20 times a month.
TTD Pro Report includes a Morning chart slide show of breakout stocks, a Midsession video-audio show with commentary on breakout stocks and shorts and a Final end of day overall report on breakout stocks for the session, short plays and accumulation plays. There are other features too such as Quick Trades and Long-term Plays.
TTD Daily Report is $39. It covers a Morning slide show of charts of stocks breaking out and a TTD end of day print report covering breakout stocks and shorts.
Credit cards accepted. Payable to Corona Publishing Enterprises.
(The information contained has been prepared from data deemed reliable but there is no guarantee of complete accuracy. Ticker Tape Digest Inc. is not affiliated with any broker, dealer or investment advisor. Nothing in this publication constitutes an offer, recommendation or solicitation to buy or sell any securities. Further research is advised. This report is copyrighted and no redistribution is permitted with out permission.)