Daily - Go to TTD's Tape of Stock Charts - Tuesday, February 3, 2015
|
Daily - Go to TTD's Tape of Stock Charts - Tuesday, February 3, 2015 |
|
Weekly - Bullish Conservative Investors - Go To TTD Long-Term Plays - Monday, January 26, 2015 |
|
Go to Video Show - "How to Make Money With Breakout Stocks" |
|---|

By Leo Fasciocco -- TTD
Ticker Tape Digest presents its daily stock market report containing stocks to go long as breakout trades, quick trades, or bargain trades. We also feature stocks under Significant Accumulation that are poised to breakout.
|
Ticker Tape Digest's Daily schedule guide for TTD subscribers 1. Pre-market - check Breakout Watch List and Quick Trades. 2. Morning - (11:30 - 12 A.M.) - check breakout stocks tape and breakout chart slide show. 3. Midday (1 P.M.) check TTD Midsession Report and see market video show. 4. After close (4 P.M.) check final TTD Report for day. Trading Strategies Bullish Aggressive Investors Bullish - "Breakout Stocks" - ideally suited for bull markets and special situation stocks. Potential for large returns. (See Performance) Aggressive Investor Bullish- "Quick Trade Stocks" -ideally suited for entry into top performing issues looking for a small quick profit." (See Performance) Conservative Investors "Bargain Buy Trades for the Long Term." Ideally suited for entry into top performing big cap stocks on pullbacks within overall up trend.(See Performance) Bearish Aggressive Bearish Investors - "Breakdown Stocks" to Sell Short. Ideally suited for bear markets or market pull backs. Potential for large returns (See Performance) |
|---|
The TTD report also contains stocks to short as breakdown plays and as bargain (swing trade) shorts.
Investors should tend to try to go with a strategy that fits with the stock market's trend, unless there is a special situation play.
TTD's Breakout Stocks - Long are
most suitable for aggressive investors seeking ideal entry points into leading stocks, especially during bull markets. They can do extremely well in bull markets with gains of as much as several hundred percent. 
These stocks can also do extremely well during strong market rallies, or if they are in a industry group that is performing very well. They tend to have strong earnings outlooks and are near new-52 week, or all-time highs.
TTD Quick Trade Stocks - Long These are leading issues that have pulled back in recent days, but could move higher soon. They are most suitable for Aggressive Investors willing to trade short term. These stocks will do extremely well during market advances. They have about 74% win rate. During market rally sequences the win rate is even higher. The return is small 3% to 8% in just a few days.
TTD's Bargain Buy Trades - Long - Long Term. These are for conservative bullish Investors These long-term buys are ideally suited for entry into stocks on pull backs within overall up trend. These stocks can give a good return long-term especially during a bull market.
TTD also presents Stocks To Sell or Sell Short. These issues are suitable for aggressive investors willing to take short positions both as trades or for longer-term plays. These stocks will do very well during bear markets or market pull backs.
TTD's Bearish breakdown stocks to sell short. These issues have potential to fall sharply. They often show a technical breakdown and also some fundamental business problem such as weak earnings.
TTD's multi-media updates include a slide-show that presents charts and analysis at midsession. Some times TTD presents feature analysis on stocks and the market. TTD uses Windows Media Files. (WMV).
TTD also presents a "Breakout Watch List" that is up dated daily. This list consists of key stocks in position to breakout. A close watch of this list can put you in the stock just as it breaks out. A good idea is to study the list and be ready to move into a stock quickly as it hits its breakpoint.
TTD often suggests using stop buy orders to enter. It is very important to buy a breakout stock as close as possible to the breakpoint. The idea is to get "elbow room" if the stock should follow through to the upside. This is very important in being successful in making big money with breakout stocks.
It is also essential to have a stop loss strategy for all stocks in which positions are taken. Not every stock will work as expected. It is important for investors to "police" their portfolios and avoid getting trapped in any bad positions.
Quality rating of breakout Two key factors: 1 - Stock near all-time high in price or near a 52-week high. 2 - earnings growth current year is strong. The ideal play is a stock with an Above Average Quality Rating. The stock is near a new high and will have strong earnings. TTD's other ratings are Average and Below Average.
TTD also has special feature sections on Educational Tips on Investing.
To email Mr. Leo Fasciocco leo@tickertapedigest.com.For service, email Beverly Owen owen@tickertapedigest.com. TTD’s Tel: 1-480-926-1680.
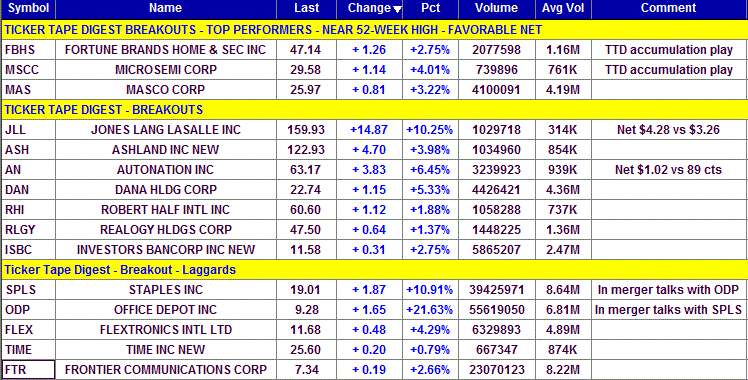
Breakout Stocks
Total Buy Breakouts so far today - 15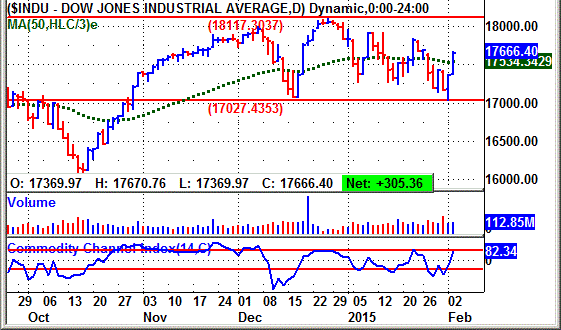
Overall Quality of Breakouts - AVERAGE
Stocks Screened - 8,300
Bull side - Breakout list large with some good looking plays. Stock market rallies back as oil plays trigger advance. Market still in a trading range.
(Put mouse on Dow chart to see Nasdaq chart)
Long Term Environment for bulls: Favorable
Stock Market Momentum
Market (Daily) - NYSE Bullish, Nasdaq Bullish
Market (Weekly) - NYSE Bullish, Nasdaq Bearish
Market (Monthly) - NYSE Bullish, Nasdaq Bullish
Ticker Tape Digest's
|
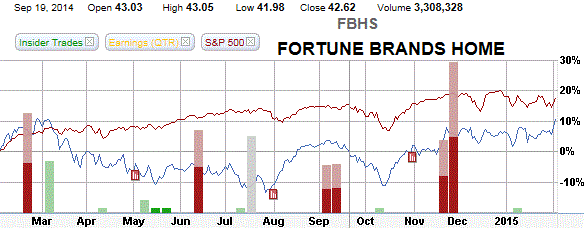
TTD's Quality Rating of Stock - FBHS - ABOVE AVERAGE |
FBHS, based in Deerfield , Il., makes home security products and home items. Annual revenues: $4.4 billion. FBHS's stock breaks out Tuesday from an 11-week flat base. The move puts FBGS within range to a make a new all-time high. That is bullish. So far today, FBHS is trading 2.1 million shares, almost double its average daily volume of 1.2 million shares. 
FBHS is a leader and top performer since coming public back in late 2011.
FBHS's stock lifted slightly in the morning and hung just above its breakpoint line (see 10-minute chart).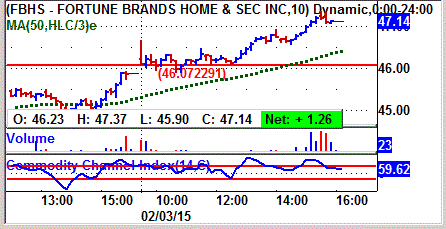
Then in the afternoon, the stock turned higher and rallied strongly into the close. It finished comfortably above its breakpoint line.
TTD's clip of the tape shows the recent big block trades.
One can see the price for the blocks working higher from $45.07 in the prior session to $45.54 on Friday.
A key bullish trade came Tuesday morning when a block of 24,600 shares crossed the tape $4620.
That was up form the prior block trade at $45.8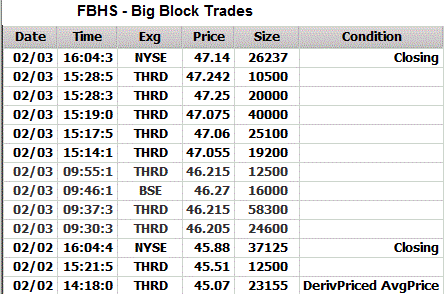 8.
8.
FBHS provides home and security products in the United States.
It makes custom, semi-custom, and stock cabinetry for the kitchen, bath, and other parts of the house.
The company also makes fiberglass and steel entry door systems, vinyl-framed windows and patio doors and urethane millwork product lines under the Therma-Tru, Simonton, and Fypon brand names in the United States and Canada.
FBHS also produces locks, safety, and security devices and tool storage and garage organization products.
FBHS's 12-month performance chart shows the stock appreciating 11% versus and 18% gain for the stock market.
FBHS has lagged because it has been in a long-term basing pattern.
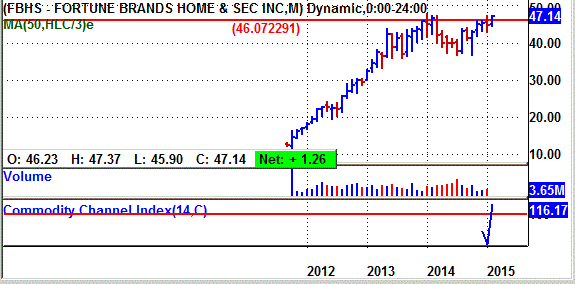
FBHS's long-term chart shows the stock coming public in 2012 and trading around 11.
The stock rose steadily to a peak of 47.92 in early 2014. Since then the stock has been trending sideways in a long-term basing pattern. The stock is in position to potentially make a new high. That would be very bullish. It needs to get over 47.52.
FBHS's daily chart shows the stock climbing from 37 in October to 46 by November. The stock then put down a tight flat base.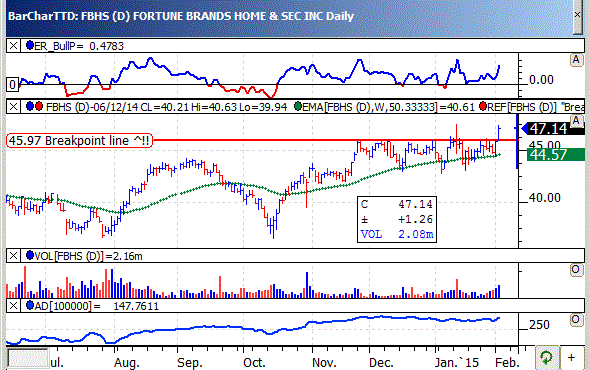
FBHS attempted a breakout in January, but faded back.
Tuesday, the stock pushes out of the base with a good expansion in volume and a widening of the daily trading spread. (range from high to low)
The stock's TTD momentum indicator (top of chart) is solidly bullish.
The accumulation-distribution line (bottom of chart) has been in an overall up trend since July.
For 2014, analysts project a 23% jump in profits to $1.85 a share from $1.50 a year ago.
The stock sells with a price-earnings ratio of 25.
TTD sees that as reasonable.
Going out to 2015, Wall Street looks for a 25% gain in profits to $2.31 a share from the anticipated $1.85 this year.
Near-term analysts look for an acceleration in quarterly earnings growth. That is very bullish and could be the fundamental driver to send FBHS higher.
For the upcoming fourth quarter, net should climb 31% to 50 cents a share from 38 cents a year ago.
The highest estimate on the Street is at 50 cents a share out of six analysts.
Net for the first quarter of 2015 should jump 65% - an acceleration in quarterly earnings.
The Street looks for net of 41 cents a share, up from 25 cents a year ago.
Strategy Opinion: TTD is targeting FBHS for a move to 58. A protective stop can be placed near 43.
TTD rates FBHS a good intermediate-term play that can play catch up in its performance.
Sponsorship: Good. The largest fund holder is 4-star rated Artisan Mid Cap Fund with a 3.2% stake. It was a recent seller of 75,306 shares.
Also, the 5-star rated JP Morgan Mid Cap Value Inst. Fund has a 1.9% stake. It has held its position steady.
The largest fund buyer recently was the 5-star rated JPMorgan US Equity Inst. Fund which purchased 70,113 shares. It has a 0.75% stake.
FBHS has 157 million shares outstanding. Institutions hold 89% of the stock. Insiders have just 1%
Insider Activity: Neutral. Insiders were recent buyers from $13.76 using stock options. They were recent sellers at $42.
Currently, 16 analysts follow the stock, 8 have a buy, the same as three months ago. FBHS has a book value of $14.81.
Stock Performance Chart with Quarterly Earnings Markers.
| TTD's Breakout Profile
Rating Fortune Brands Home & Security Inc. - (FBHS) |
| TTD Check List | Bullish | Bearish | Neutral |
| Near 52-week High | YES | ||
| Volume | YES | ||
| Tick Volume | YES | ||
| Price Trend - Daily | YES | ||
| Price Trend - Long Term | YES | ||
| Price Daily Spread | YES | ||
| Base Structure | YES | ||
| Base - A-D | YES | ||
| Earnings-Quarterly | YES | ||
| Earnings-Long Term | YES | ||
| Earnings Outlook | YES | ||
| Industry Group | YES | ||
| Prior Breakout Success | YES | ||
| Fund Sponsorship | YES | ||
| Total Score | 13 | 0 | 1 |
Charts of Selected Breakout Stocks
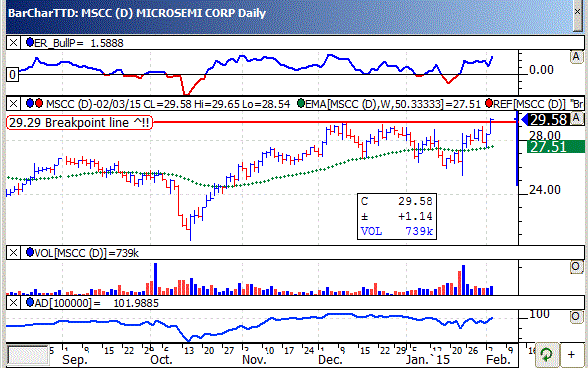
| TTD's Quality Rating of Stock - MSCC - ABOVE AVERAGE |
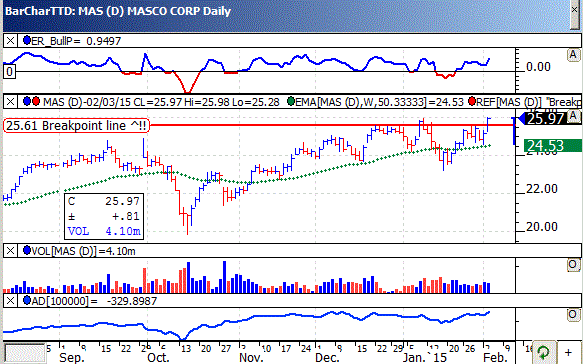
| TTD's Quality Rating of Stock - MAS - ABOVE AVERAGE |
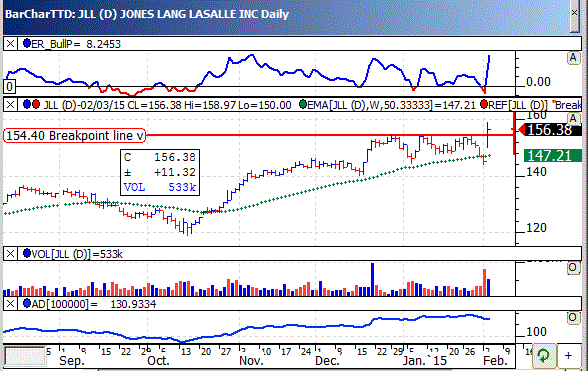
| TTD's Quality Rating of Stock - JLL - AVERAGE |
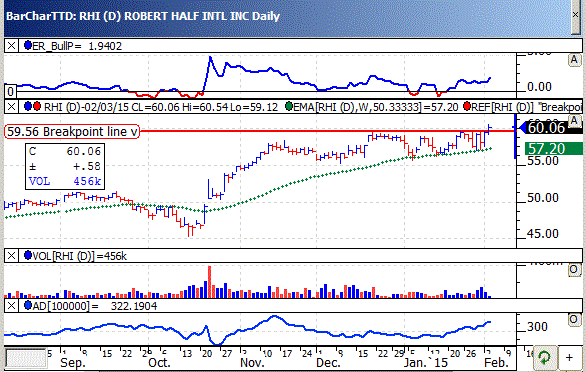
| TTD's Quality Rating of Stock - RHI - AVERAGE |

Ticker Tape Digest’s Daily List of “Stocks To Sell or Sell Short” ranks stocks well timed to be sold immediately based on daily trading. The list can be used as an alert to reduce current long-term positions.
Shorts from tape action so far today - 3
Stocks Screened - 8,300
Long-Term Environment for bears: Unfavorable.
Bear Side - Only one short today. Stock market continues to rally. Bears remain conservative.
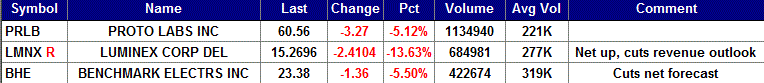
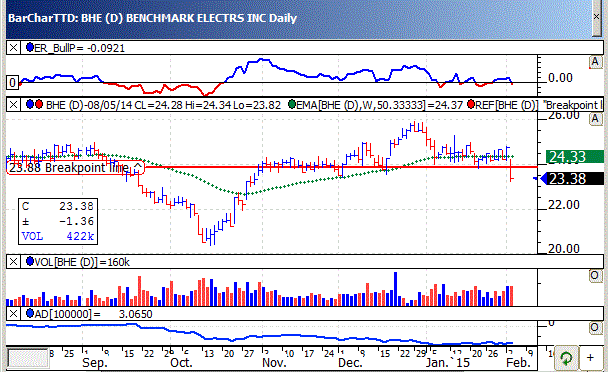
BHE, based in Angleton, Tex., provides contract electronics manufacturing and design services. Annual revenues: $2.8 billion. BHE's stock falls sharply Tuesday after the company lowered its earnings outlook for the upcoming first quarter. TTD sees more on the downside. 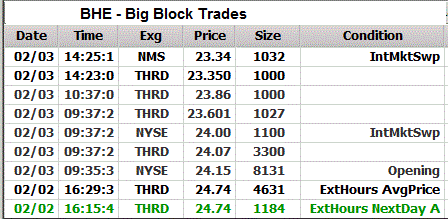
TTD highlighted BHE as a short at our midsession video show on the web Tuesday.
So far today, BHE is trading a heavy 727,192 shares, double its average daily volume of 319,000 shares.
BHE fell sharply in the morning and continued South into the afternoon. So far it has made an intraday low of 23.10 and has failed to rally.
BHE's tape action shows the recent block trades.
One can see the price for the blocks falling from $24.74 in the prior session to as low as $23.34.
A key bearish trade came in the morning when a block of 8,131 shares crossed at $24.15. That was down sharply from the prior block trade at $24.75 on 4,631 shares.
BHE said earnings for the upcoming first quarter would be 30 to 34 cents a share.
That is down from the consensus estimate on the Street of 38 cents a share. A year before, BHE earned 35 cents a share.
BHE develops medical devices, communications equipment, industrial and business computers, testing instrumentation and industrial controls.
The firm makes complex printed circuit board assemblies with computer-automated equipment using surface mount and pin-through-hole interconnection technologies for customers requiring low to medium volume production.
This year, analysts were forecasting a 6% increase in net to $1.75 a share from $1.65 a year ago. However, that estimate should come down to around $1.70.
BHE's daily chart shows the stock breaking below key technical support. The stock's accumulation - distribution line (bottom of chart) is in a down trend indicating clear selling pressure for the past few months.
Strategy Opinion: TTD is targeting BHE for a decline to 19 within the next few months or sooner. A protective stop buy can be placed near 24.60.
| TTD's Quality Rating of Stock - BHE - BELOW AVERAGE |
TTD columnist Leo Fasciocco has covered the stock market for over 20 years. His articles appear in many publications. He is also a speaker at the Intershow conferences. He has been on television and radio. He is author of many educational articles about stock investing and the book “Guide To High-Performance Investing.”

For information to subscribe to the Ticker Tape Digest Services call: Beverly Owen at 1-480-926-1680. Distributed by Corona Publishing Enterprises. Ticker Tape Digest Inc. P.O. Box 2044 Chandler, Az. 85244-2044. TTD “Professional Report” is available on the World Wide Web: $100 per month. Password needed. “TTD Professional“ Faxed is $200 per month. The TTD
Daily Report is $39.95. Credit cards accepted.
(The information contained has been prepared from data deemed reliable but there is no guarantee of complete accuracy. Ticker Tape Digest Inc. is not affiliated with any broker, dealer or investment advisor. Nothing in this publication constitutes an offer, recommendation or solicitation to buy or sell any securities. Further research is advised. This report is copyrighted and no redistribution is permitted with out permission.)