Daily - Go to TTD's Tape of Stock Charts - Wednesday, February 5, 2014
|
Daily - Go to TTD's Tape of Stock Charts - Wednesday, February 5, 2014 |
|
Weekly - Bullish Conservative Investors - Go To TTD Long-Term Plays - Monday, February 3, 2013 |
|
Go to Video Show - "How to Make Money With Breakout Stocks" |
|---|

By Leo Fasciocco -- TTD
Ticker Tape Digest presents its daily stock market report containing stocks to go long as breakout trades, quick trades, or bargain trades. We also feature stocks under Significant Accumulation that are poised to breakout.
|
Ticker Tape Digest's Daily schedule guide for TTD subscribers 1. Pre-market - check Breakout Watch List and Quick Trades. 2. Morning - (11:30 - 12 A.M.) - check breakout stocks tape and breakout chart slide show. 3. Midday (1 P.M.) check TTD Midsession Report and see market video show. 4. After close (4 P.M.) check final TTD Report for day. Trading Strategies Bullish Aggressive Investors Bullish - "Breakout Stocks" - ideally suited for bull markets and special situation stocks. Potential for large returns. (See Performance) Aggressive Investor Bullish- "Quick Trade Stocks" -ideally suited for entry into top performing issues looking for a small quick profit." (See Performance) Conservative Investors "Bargain Buy Trades for the Long Term." Ideally suited for entry into top performing big cap stocks on pullbacks within overall up trend.(See Performance) Bearish Aggressive Bearish Investors - "Breakdown Stocks" to Sell Short. Ideally suited for bear markets or market pull backs. Potential for large returns (See Performance) |
|---|
The TTD report also contains stocks to short as breakdown plays and as bargain (swing trade) shorts.
Investors should tend to try to go with a strategy that fits with the stock market's trend, unless there is a special situation play.
TTD's Breakout Stocks - Long are most suitable for aggressive investors seeking ideal entry points into leading stocks, especially during bull markets. They can do extremely well in bull markets with gains of as much as several hundred percent.
These stocks can also do extremely well during strong market
rallies, or if they are in a industry group that is performing very well. They tend to have strong earnings outlooks and are near new-52 week, or all-time highs. 
TTD Quick Trade Stocks - Long These are leading issues that have pulled back in recent days, but could move higher soon. They are most suitable for Aggressive Investors willing to trade short term. These stocks will do extremely well during market advances. They have about 74% win rate. During market rally sequences the win rate is even higher. The return is small 3% to 8% in just a few days.
TTD's Bargain Buy Trades - Long - Long Term. These are for conservative bullish Investors These long-term buys are ideally suited for entry into stocks on pull backs within overall up trend. These stocks can give a good return long-term especially during a bull market.
TTD also presents Stocks To Sell or Sell Short. These issues are suitable for aggressive investors willing to take short positions both as trades or for longer-term plays. These stocks will do very well during bear markets or market pull backs.
TTD's Bearish breakdown stocks to sell short. These issues have potential to fall sharply. They often show a technical breakdown and also some fundamental business problem such as weak earnings.
TTD's multi-media updates include a slide-show that presents charts and analysis at midsession. Some times TTD presents feature analysis on stocks and the market. TTD uses Windows Media Files. (WMV).
TTD also presents a "Breakout Watch List" that is up dated daily. This list consists of key stocks in position to breakout. A close watch of this list can put you in the stock just as it breaks out. A good idea is to study the list and be ready to move into a stock quickly as it hits its breakpoint.
TTD often suggests using stop buy orders to enter. It is very important to buy a breakout stock as close as possible to the breakpoint. The idea is to get "elbow room" if the stock should follow through to the upside. This is very important in being successful in making big money with breakout stocks.
It is also essential to have a stop loss strategy for all stocks in which positions are taken. Not every stock will work as expected. It is important for investors to "police" their portfolios and avoid getting trapped in any bad positions.
Quality rating of breakout Two key factors: 1 - Stock near all-time in price or near a 52-week high. 2 - earnings growth current year is strong. The ideal play is a stock with an Above Average Quality Rating. The stock is near a new high and will have strong earnings. TTD's other ratings are Average and Below Average.
TTD also has special feature sections on Educational Tips on Investing.
To email Mr. Leo Fasciocco leo@tickertapedigest.com.For service, email Beverly Owen owen@tickertapedigest.com. TTD’s Tel: 1-480-926-1680.
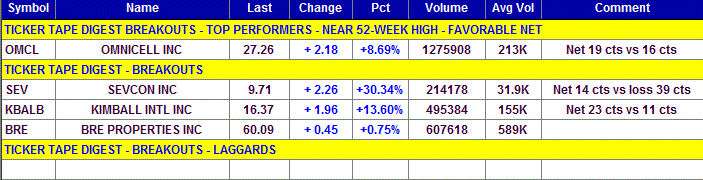
Breakout Stocks
Total Buy Breakouts so far today - 4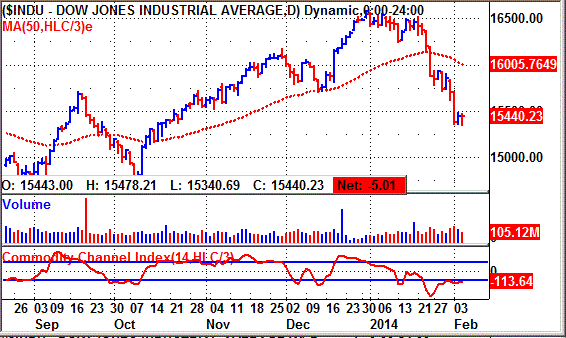
Overall Quality of Breakouts - AVERAGE
Stocks Screened - 8,300
Bull side - Breakout list small as stock market closes lower and remains bearish. Bulls be patient and conservative.
(Put mouse on Dow chart to see Nasdaq chart)
Long Term Environment for bulls: Favorable
Stock Market Momentum
Market (Daily) - NYSE Bearish, Nasdaq Bearish
Market (Weekly) - NYSE Bearish, Nasdaq Bearish
Market (Monthly) - NYSE Bearish, Nasdaq Bearish
Ticker Tape Digest's
|
TTD's Quality Rating of Stock - OMCL - ABOVE AVERAGE |
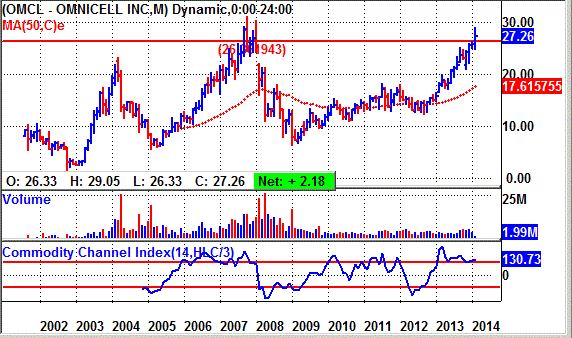
OMCL, based in Mountain View, Ca., provides automated systems for healthcare firms to dispense medication. Annual revenues: $365 million. OMCL's stock breaks out today from a seven-week flat base. The move carries the stock to a six-year high. So far today, OMCL is trading a heavy 1.3 million shares, six times its average daily volume of 213,000 shares. 
TTD highlighted OMCL as a breakout at our midsession video show on the Web Wednesday.
The company reported earnings for the fiscal second quarter ending in December rose to 19 cents a share from 16 cents a year ago. They were in line with Street estimates. 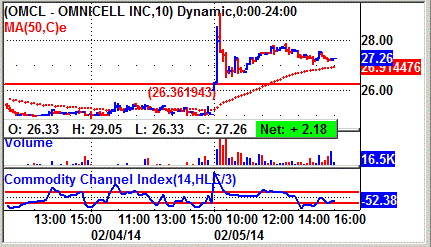
OMCL's stock shot higher at the opening bucking the stock market's decline.
The stock cleared its breakpoint and hit an intraday peak of 29.05.
The stock then pulled back, but rallied again into midday. It then coasted home holding above its breakpoint.
OMCL's t ape action shows the recent big block trades.
One can see the price for the blocks advancing from $25.03 a few sessions ago to as high as $27.39.
A key bullish rade came in the morning when a block of 14,314 shares crossed the tape at $26.80. 
That was up sharply from the prior block at $25.08. That showed aggressive institutional buying.
OMCL provides clinical infrastructure and workflow automation solutions that enable healthcare firms to acquire, manage, dispense, and deliver medications and supplies effectively.
Its automation, analytics and medication adherence solutions enable healthcare facilities to acquire, manage, dispense and administer medications and medical-surgical supplies and enhance patient safety, reduce medication errors, reduce operating costs, improve workflow and increase operational efficiency.
About 2,700 hospitals and 6,000 institutional and retail pharmacies use the company’s products and services.
The Company’s business is organized into two operating business segments: Acute Care, which primarily includes sold to hospitals and non-acute care for customers outside of hospitals
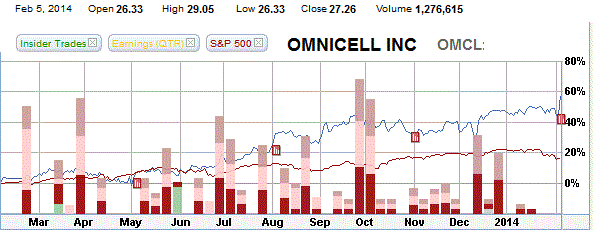
OMCL's 12-month performance chart shows the stock appreciating 58% versus and 18% gain for the S&P 500 index. The red bars show steady insider selling.
OMCL's long-term chart shows the stock coming public in 2001 and trading around 8. The stock eventually worked its way to an all-time high of 31.12 in 2007, the peak in the prior bull market.
The stock then fell back to 6 during the following bear market in 2009. However, since then OMCL as recovered and is now in position to challenge its all-time high.
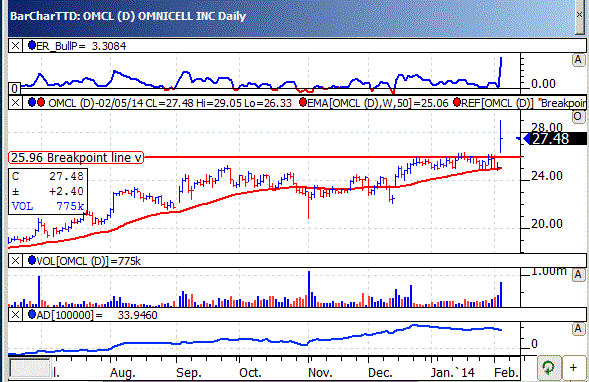
OMCL's daily chart shows the stock gaping higher and out of its flat base. The move comes with a widening of the spread (range from low to high) and an expansion in volume.
That is bullish.
OMCL's TTD momentum indicator (top of chart) is strongly bullish.
The accumulation - distribution line (bottom of chart) is in an overall up trend and compliments the action of the stock.
The company finished 2013 with a 38% gain in earnings.
Going out to 2014, the Street is looking for a 21% increase in net to 93 cents a share. The stock sells with a price earnings ratio of 29.
Profits for the first quarter should leap 60% to 16 cents a share from 10 cents a year ago. The highest estimate on the Street is at 17 cents a share. 
Looking ahead to the second quarter of 2014, the Street looks for a 16% gain in net to 22 cents a share from 19 cents a year before.
Strategy Opinion: TTD is targeting OMCL for a move to 34 off this breakout. A protective stop can be placed near 24.50.
TTD rates OMCL an average intermediate-term play with a lot depending on its earnings.
Sponsorship: Excellent. The largest fund buyer recently was 5-star rated Buffalo Emerging Opportunities Fund which purchased 155,300 shares. It has a 0.80% stake.
The largest fund holder is Pioneer Oak Ridge Small Cap Growth Fund with a 4.2% stake. The 3-star fund has held its position steady.
OMCL has 35.6 million shares outstanding.
Insider Activity: Slightly Bearish. Insider have been light sellers of the stock recently. Some have bought with options from$3.70 to $13.15.
Currently, 6 analysts follow the stock, 3 have a buy, up from 2 three months ago.
Stock Performance Chart with Quarterly Earnings Markers.
| TTD's Breakout Profile
Rating Omnicell Inc. - (OMCL) |
| TTD Check List | Bullish | Bearish | Neutral |
| Near 52-week High | YES | ||
| Volume | YES | ||
| Tick Volume | YES | ||
| Price Trend - Daily | YES | ||
| Price Trend - Long Term | YES | ||
| Price Daily Spread | YES | ||
| Base Structure | YES | ||
| Base - A-D | YES | ||
| Earnings-Quarterly | YES | ||
| Earnings-Long Term | YES | ||
| Earnings Outlook | YES | ||
| Industry Group | YES | ||
| Prior Breakout Success | YES | ||
| Fund Sponsorship | YES | ||
| Total Score | 14 | 0 | 0 |
Charts of Selected Breakout Stocks
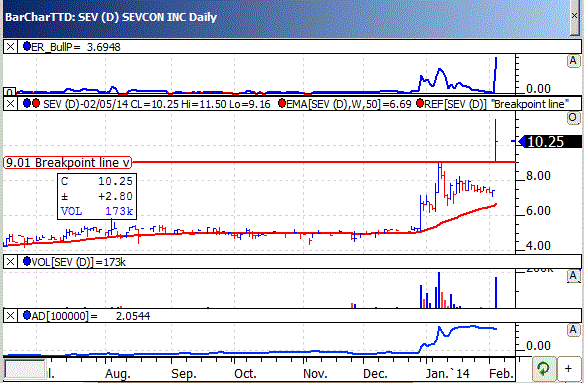
| TTD's Quality Rating of Stock - SEV - AVERAGE |
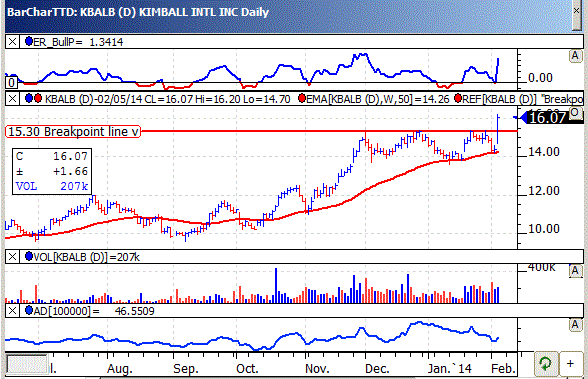
| TTD's Quality Rating of Stock - KBALB - AVERAGE |
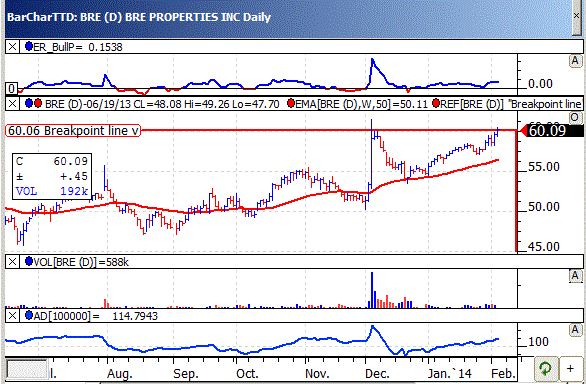
| TTD's Quality Rating of Stock - BRE - AVERAGE |

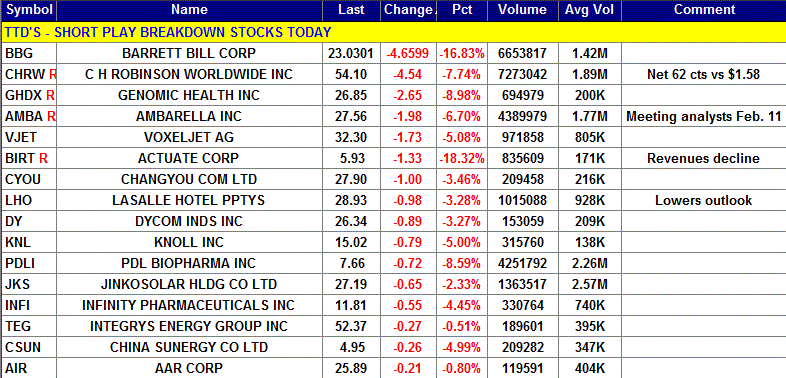
Ticker Tape Digest’s Daily List of “Stocks To Sell or Sell Short” ranks stocks well timed to be sold immediately based on daily trading. The list can be used as an alert to reduce current long-term positions.
Shorts from tape action so far today - 16
Stocks Screened - 8,300
Long-Term Environment for bears: Favorable.
Bear Side - Large number of shorts today. Bears be venturesome. Stock market in a down trend. TTD's short from Tuesday was Alliance Fiber Optic Products Inc. (AFOP) at 12.08. Today, it has declined to 11.97 and is working well for bears.
GHDX, based in Redwood City, Ca., produces genomic-based clincial diagnostic tests for cancer. Annual revenues: $253. GHDX's stock falls sharply today after the company reported a loss for the fourth quarter of 2013. So far today, GHDX is trading a heavy 737,486 shares, triple its average daily volume of 200,000 shares. 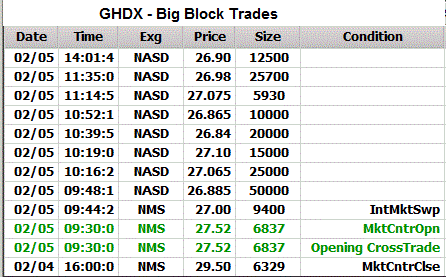
TTD highlighted GHDX as a short at our midsession videos show on the Web Wednesday.
GHDX reported a fourth quarter loss of 30 cents a share compared with a profit of 6 cents a year before.
The Street was forecasting a loss of just 2 cents a share. So, the results were a disappointment.
GHDX's stock fells sharply in the morning. It hit an intraday low of 26.50. The stock then trended sideways unable to rally at all.
GHDX's tape action shows the recent block trades.
One can see the price for the blocks falling from $29.50 in the prior session to as low as $26.84 Wednesday.
A key bearish trade came when a block of 6,837 shares crossed the tape in the morning at $27.52. That was down sharply from the prior block trade at $29.50.
GHDX makes genomic-based clinical diagnostic tests for cancer that allow physicians and patients to make individualized treatment decisions.
The company first test system, Oncotype DX, is used to predict the likelihood of breast cancer recurrence and chemotherapy benefit in early stage breast cancer patients.
This year, the Street is looking for GHDX to show a profit of 11 cents a share compared with a loss in 2013. For the first quarter, they look for a breakeven against a loss of 3 cents a share a year ago.
GHDX's daily chart shows the stock gapping lower with big volume. The move undercuts key support. The stock's accumulation - distribution line (bottom of chart) is in a down trend showing clear selling pressure.
Strategy Opinion: TTD is targeting GHDX for a decline to 22. A protective stop can be placed near 28.
| TTD's Quality Rating of Stock - GHDX - BELOW AVERAGE |

TTD columnist Leo Fasciocco has covered the stock market for over 20 years. His articles appear in many publications. He is also a speaker at the Intershow conferences. He has been on television and radio. He is author of many educational articles about stock investing and the book “Guide To High-Performance Investing.”

For information to subscribe to the Ticker Tape Digest Services call: B. J. Owen at 1-480-926-1680. Distributed by Corona Publishing Enterprises. Ticker Tape Digest Inc. P.O. Box 2044 Chandler, Az. 85244-2044. TTD “Professional Report” is available on the World Wide Web: $100 per month. Password needed. “TTD Professional“ Faxed is $200 per month. The TTD Daily Report is $39.95. Credit cards accepted.
(The information contained has been prepared from data deemed reliable but there is no guarantee of complete accuracy. Ticker Tape Digest Inc. is not affiliated with any broker, dealer or investment advisor. Nothing in this publication constitutes an offer, recommendation or solicitation to buy or sell any securities. Further research is advised. This report is copyrighted and no redistribution is permitted with out permission.)
