Go To TTD's Pre-Market Opening Breakout Watch Stock Lists for February 6 |
Search Engine TTD Reports |
Go To Prior Days TTD Reports |
Translate to any Language |

By Leo Fasciocco -- TTD
Ticker Tape Digest presents its daily breakout and Short Selling report. It contains Breakout Stocks and Stocks under Significant Accumulation.Data is from tape action for the day. These stocks are most suitable for aggressive investors seeking ideal entry points for leading stocks.
These stocks will do very well during bull markets and strong market rallies.

TTD also presents Stocks To Sell or Sell Short.These issues are suitable for aggressive investors willing to take short positionsboth as trades or for longer-term plays. These stocks will do very well during bear markets or market corrections
TTD's multi-media updates include a slide-show that presents charts. It is available with use of the Real Player One that can be downloaded for free from real.com. The latest versions of Microsoft's explorer and Netscape have the player already installed and works well with TTD's slide shows.
TTD's more advanced video show comes as Microsoft video file and is best used with cable or high-speed service.
TTD also has a special feature section on Tips - Questions and Answers at the Forum section.Go To Forum click here
To email Leo leo@tickertapedigest.com.For service, email Beverly Owen owen@tickertapedigest.com. TTD’s Tel: 1-480-926-1680.
Ticker Tape Digest Search Click Here |
Ticker Tape Digest Message Board Click Here |
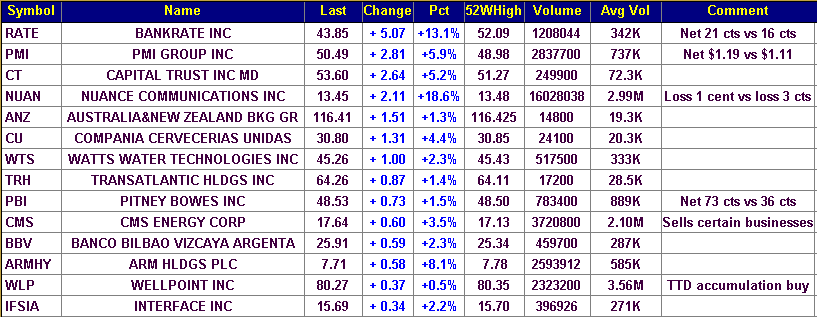
Total Buy Breakouts so far today - 14
Stocks Screened- 8,200
Bull side - Good number of breakouts today with a few leading stocks breaking out, most noteworthy being Wellpoint. Bulls be selective as the market now appears to be in a trading range.
Long-Term Environment for bulls: Favorable.
Market Status (Daily) - NYSE Bullish, Nasdaq Bearish
Market Status (Weekly) - NYSE Bullish, Nasdaq Bearish
IFSIA, based in Atlanta, Ga., is a major producer of commercial carpets. Annual revenues: $985 million. IFSIA breaks out from 12-week, cup and handle base today and hits a new eight-year high on expanding volume. So far today, IFSIA is trading 432,249 shares. The stock's normal daily volume is 271,000 shares. The key breakpoint was at $15.50.

IFSIA produces modular carpet, office panels and upholstery fabrics.
The company puts an emphasis on environmentally friendly production.
It markets its modular (tiles and rolls) and broadloom carpets under such names as Heuga, Interface, and Bentley Prince Street. The company also makes interior panel fabrics for office furniture, including cubicles. Interface sells its products in more than 100 countries, with the US accounting for about 57% of sales.
The company exited its US raised/access flooring business and its Re:Source service operation in 2004 in order to focus on its core carpet business lines.
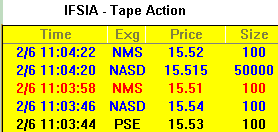
IFSIA has been in a steady climber in recent months. Today, its breakout comes on volume and good tape action. TTD's clip of the tape shows a big block of 50,000 shares going off on a modest up tick to $15.515 from the prior trade at $15.51.
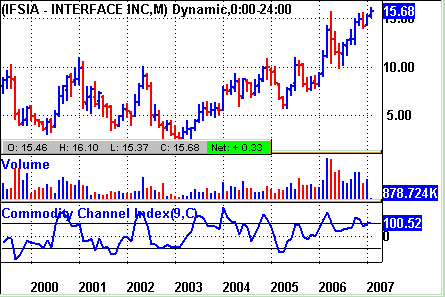
Although carpets may not seem glamorous, the stock is. Since the start of the bull market in early 2003, IFSIA has climbed from 3 to 15 - a fivefold move.
Technically, today's breakout looks like a creeper - by that we mean the stock is just moving out of its base slowly. However, it is noteworthy that volume is expanding and the stock has hit a new 52-week high. That could well bring in buying on Wednesday.
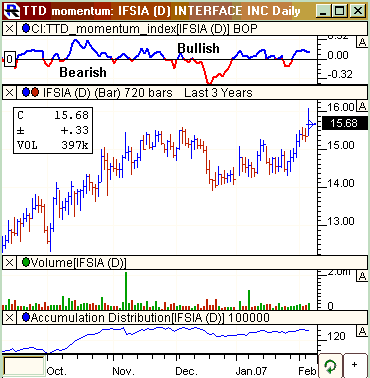
Technically, IFSIA's TTD momentum indicator (top of the chart) is in the bullish zone. The accumulation-distribution line (bottom of the chart) is neutral, but we can live that at this time.
IFSIA should soon come in with net for 2006. The Street is forecasting a 55% jump in net to 62 cents a share from 40 cents in 2005.
The fourth quarter should be very good with net climbing 39% to 19 cents a share from 14 cents a year ago. The highest estimate on the Street is at 20 cents a share. Generally, the company comes in close to the consensus. However, once in a while it can surprise big on the upside.
Turning to 2007, IFSIA's profits should advance 43% to 88 cents a share from the anticipated 62 cents a share. The stock has a price-earnings ratio of just 17 based on this year's estimated net. That is less than half the earnings growth rate. That kind of ratio tends to strongly attract value-growth investors.
Strategy Opinion: IFSIA looks solid. TTD suggests a full position on this breakout. We are targeting the stock for a move to 20 within the next few months. A protective stop can be placed near 14. TTD rates IFSIA a very good intermediate-term play because of its strong earnings outlook.
Sponsorship: Very Good. Four of the top five fund holders are in the Fidelity Funds group. The largest fund holder is 5-star rated Fidelity Balanced Fund with a 2.9% stake. It has held its position steady. A key buyer recently was 4-star rated Fidelity Disciplined Equity Fund which purchased 1 million shares.
Insider Activity: Neutral. Not much activity. Some very small sells earlier this year. No buys. Just two analysts follow the stock, and both have a strong buy. Citigroup Investment Research has a $19 price target.
| TTD's Breakout Profile
Rating Interface Inc. (IFSIA) |
| TTD Check List | Bullish | Bearish | Neutral |
| Near 52-week High | YES | ||
| Volume | YES | ||
| Tick Volume | YES | ||
| Price Trend - Daily | YES | ||
| Price Trend - Long Term | YES | ||
| Price Daily Spread | YES | ||
| Base Structure | YES | ||
| Base - A-D | YES | ||
| Earnings-Quarterly | YES | ||
| Earnings-Long Term | YES | ||
| Earnings Outlook | YES | ||
| Industry Group | YES | ||
| Prior Breakout Success | YES | ||
| Fund Sponsorship | YES | ||
| Total Score | 14 | 0 | 0 |
(The “breakout List” gives all stocks breaking out of a base of five weeks or more. These stocks have a good chance to trend higher. However, a stop should be used to avoid those that do not work.
(Trading strategy: One should buy breakout stocks at breakpoint by using market order or stop buy)
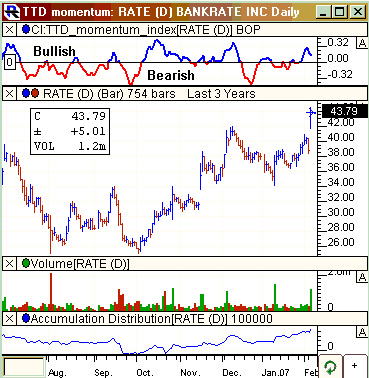
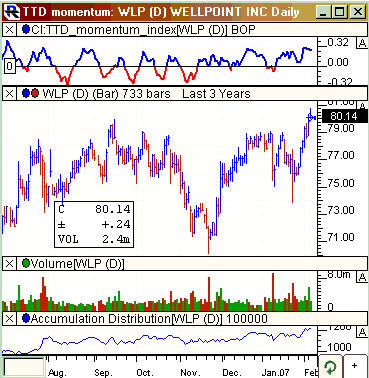
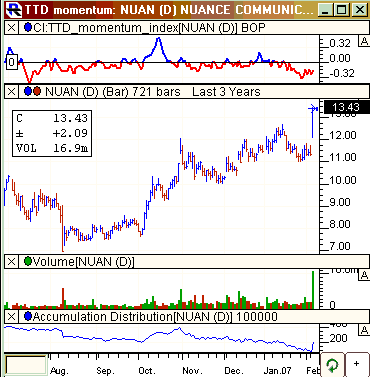
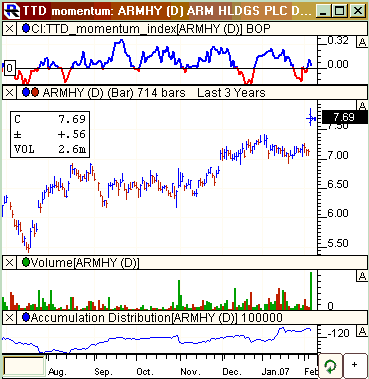

Ticker Tape Digest’s Daily List of “Stocks To Sell or Sell Short” ranks stocks well timed to be sold immediately based on daily trading. The list can be used as an alert to reduce current long-term positions.
Shorts from tape action so far today - 4
Stocks Screened - 8,200
Long-Term Environment for bears: Unfavorable.
Bear Side - Only a few breakown plays today. Bears be selective as market now seems to be going into a clear trading range. SLM Corp. (SLM), TTD's short from Monday, falls 0.88 to 41.49.
(Trading strategy: These stocks can be sold short, or if held should be sold. If a stock is sold short, a protective stop buy should be placed. Short plays work best when the stock market is in a down trend.)

LIOX, based in Waltham, Mas., offers translation, or globalization, of material such as software, user manuals, and Web content for companies in the consumer products, financial, information technology, life sciences, and telecom industries. Annual revenues: $236 million. LIOX falls sharply today on a big expansion in volume as it reports a wider loss for the fourth quarter.
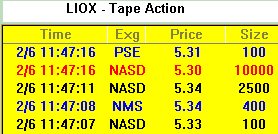
So far today, LIOX is trading 1.4 million shares, five times its normal daily volume of 258,000 shares. The heavy volume with the big price drop is very bearish. A key trade on the tape came in the morning when a big block of 10,000 shares crossed the tape on a down tick to $5.30 from the prior trade at $5.34.
The company prepares materials for international use by tailoring them to individual languages and cultures.
Microsoft accounts for about 20% of the LIOX's sales. Its other customers include Hewlett-Packard, IBM, and Merck. Along with its translation services, which account for more than 80% of sales, LIOX tests Web sites, software, and hardware to ensure their quality.
The company reported a fourth quarter loss of 10 cents a share compared with a loss of 5 cents a share a year ago. The Street was expecting a profit of 3 cents a share.
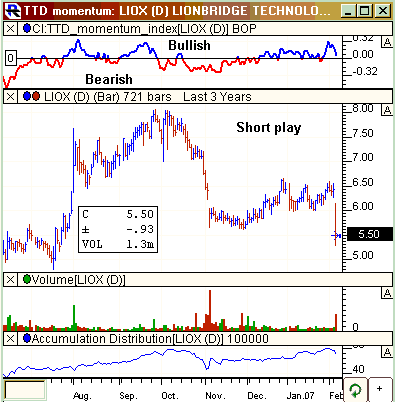
The stock's technical breakdown today is extremely bearish. The stock recently rolled over after peaking at 8. The stock fell to around 6 and a hiccup rally. Now it breaksdown with bearish fundamental news. TTD is calling for LIOX to decline to 3.50 within the next few months. TTD sees the stock as an excellent short for aggressive bears.
TTD columnist Leo Fasciocco has covered the stock market for over 20 years. His articles appear in many publications. He is also a speaker at the Intershow conferences. He has been on television and radio. He is author of many educational articles about stock investing and the book “Guide To High-Performance Investing.”

For information to subscribe to the Ticker Tape Digest Services call: B. J. Owen at 1-602-926-1680. Distributed by Corona Publishing Enterprises. Ticker Tape Digest Inc. P.O. Box 2044 Chandler, Az. 85244-2044. TTD “Professional Report” is available on the World Wide Web: $100 per month. Password needed. “TTD Professional“ Faxed is $200 per month. The TTD Daily Report is $39.95. Credit cards accepted.
(The information contained has been prepared from data deemed reliable but there is no guarantee of complete accuracy. Ticker Tape Digest Inc. is not affiliated with any broker, dealer or investment advisor. Nothing in this publication constitutes an offer, recommendation or solicitation to buy or sell any securities. Further research is advised. This report is copyrighted and no redistribution is permitted with out permission. Some of the charts are from Telescan, Insight Trading, First Alert and other sources.)