Daily - Go to TTD's Tape of Stock Charts - Thursday, February 6, 2014
|
Daily - Go to TTD's Tape of Stock Charts - Thursday, February 6, 2014 |
|
Weekly - Bullish Conservative Investors - Go To TTD Long-Term Plays - Monday, February 3, 2013 |
|
Go to Video Show - "How to Make Money With Breakout Stocks" |
|---|

By Leo Fasciocco -- TTD
Ticker Tape Digest presents its daily stock market report containing stocks to go long as breakout trades, quick trades, or bargain trades. We also feature stocks under Significant Accumulation that are poised to breakout.
|
Ticker Tape Digest's Daily schedule guide for TTD subscribers 1. Pre-market - check Breakout Watch List and Quick Trades. 2. Morning - (11:30 - 12 A.M.) - check breakout stocks tape and breakout chart slide show. 3. Midday (1 P.M.) check TTD Midsession Report and see market video show. 4. After close (4 P.M.) check final TTD Report for day. Trading Strategies Bullish Aggressive Investors Bullish - "Breakout Stocks" - ideally suited for bull markets and special situation stocks. Potential for large returns. (See Performance) Aggressive Investor Bullish- "Quick Trade Stocks" -ideally suited for entry into top performing issues looking for a small quick profit." (See Performance) Conservative Investors "Bargain Buy Trades for the Long Term." Ideally suited for entry into top performing big cap stocks on pullbacks within overall up trend.(See Performance) Bearish Aggressive Bearish Investors - "Breakdown Stocks" to Sell Short. Ideally suited for bear markets or market pull backs. Potential for large returns (See Performance) |
|---|
The TTD report also contains stocks to short as breakdown plays and as bargain (swing trade) shorts.
Investors should tend to try to go with a strategy that fits with the stock market's trend, unless there is a special situation play.
TTD's Breakout Stocks - Long are most suitable for aggressive investors seeking ideal entry points into leading stocks, especially during bull markets. They can do extremely well in bull markets with gains of as much as several hundred percent.
These stocks can also do extremely well during strong market
rallies, or if they are in a industry group that is performing very well. They tend to have strong earnings outlooks and are near new-52 week, or all-time highs. 
TTD Quick Trade Stocks - Long These are leading issues that have pulled back in recent days, but could move higher soon. They are most suitable for Aggressive Investors willing to trade short term. These stocks will do extremely well during market advances. They have about 74% win rate. During market rally sequences the win rate is even higher. The return is small 3% to 8% in just a few days.
TTD's Bargain Buy Trades - Long - Long Term. These are for conservative bullish Investors These long-term buys are ideally suited for entry into stocks on pull backs within overall up trend. These stocks can give a good return long-term especially during a bull market.
TTD also presents Stocks To Sell or Sell Short. These issues are suitable for aggressive investors willing to take short positions both as trades or for longer-term plays. These stocks will do very well during bear markets or market pull backs.
TTD's Bearish breakdown stocks to sell short. These issues have potential to fall sharply. They often show a technical breakdown and also some fundamental business problem such as weak earnings.
TTD's multi-media updates include a slide-show that presents charts and analysis at midsession. Some times TTD presents feature analysis on stocks and the market. TTD uses Windows Media Files. (WMV).
TTD also presents a "Breakout Watch List" that is up dated daily. This list consists of key stocks in position to breakout. A close watch of this list can put you in the stock just as it breaks out. A good idea is to study the list and be ready to move into a stock quickly as it hits its breakpoint.
TTD often suggests using stop buy orders to enter. It is very important to buy a breakout stock as close as possible to the breakpoint. The idea is to get "elbow room" if the stock should follow through to the upside. This is very important in being successful in making big money with breakout stocks.
It is also essential to have a stop loss strategy for all stocks in which positions are taken. Not every stock will work as expected. It is important for investors to "police" their portfolios and avoid getting trapped in any bad positions.
Quality rating of breakout Two key factors: 1 - Stock near all-time in price or near a 52-week high. 2 - earnings growth current year is strong. The ideal play is a stock with an Above Average Quality Rating. The stock is near a new high and will have strong earnings. TTD's other ratings are Average and Below Average.
TTD also has special feature sections on Educational Tips on Investing.
To email Mr. Leo Fasciocco leo@tickertapedigest.com.For service, email Beverly Owen owen@tickertapedigest.com. TTD’s Tel: 1-480-926-1680.
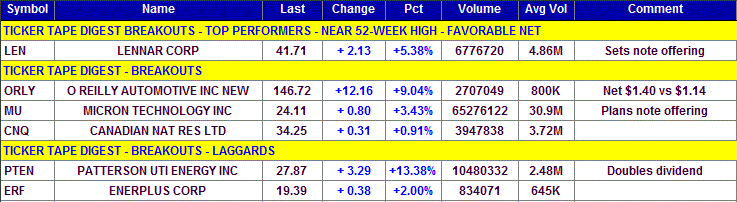
Breakout Stocks
Total Buy Breakouts so far today - 6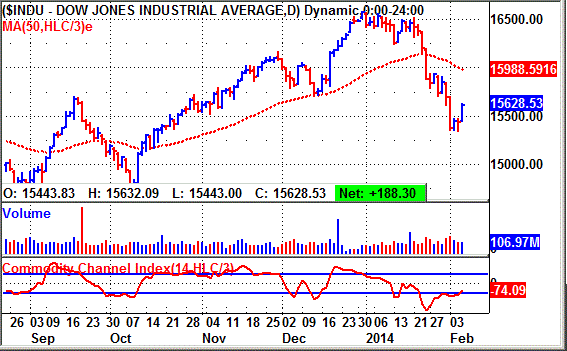
Overall Quality of Breakouts - AVERAGE
Stocks Screened - 8,300
Bull side - Breakout list modest. Stock market bounces higher after recent selloff. Stock market poised for a near-term rally. Bulls remain cautious and selective.
(Put mouse on Dow chart to see Nasdaq chart)
Long Term Environment for bulls: Favorable
Stock Market Momentum
Market (Daily) - NYSE Bullish, Nasdaq Bullish
Market (Weekly) - NYSE Bullish, Nasdaq Bullish
Market (Monthly) - NYSE Bullish, Nasdaq Bullish
Ticker Tape Digest's
|
TTD's Quality Rating of Stock - MU - AVERAGE |
MU, based in Boise, Idaho, makes semiconductor memory solutions. Annual revenues: $11.3 billion. MU breaks out today from a nine-week flat base. The move carries the cyclical stock to a 12-high. So far today, MU Iis trading a heavy 65.3 million shares, double its average daily volume of 30.9 million shares. 
TTD highlighted MU as a breakout at our midsession video show on the Web Thursday.
MU's stock is now riding the upcycle of its long-term pattern. TTD has spotted other semiconductor stocks doing well too.
MU's stock 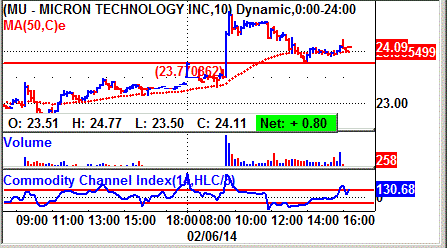 drove sharply higher in the morning participating in the stock market's strong advance.
The stock hit an intraday peak of 24.77 in the morning. It then trended sideways for awhile.
In the early afternoon, it gave some ground but then firmed. The strong volume in the morning during the advance was impressive.
MU's tape action shows the recent block trades.
One can see the price for the blocks jumping to $24.60 in the morning on a massive 1.4 million shares. That was up from the prior block at $23.31.
The tape action indicated heavy institutional buying.
The price for the blocks drifted lower during the day. 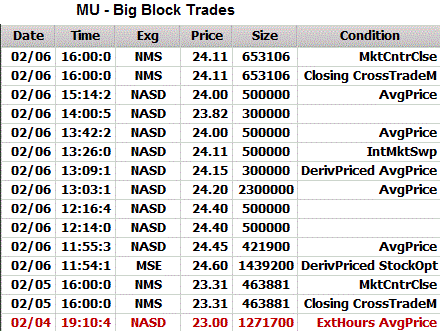
There was a bearish block that crossed at $24.20 on 2.3 million shares.
MU makes semiconductor memory solutions.
The company's quality memory solutions serve customers in a variety of industries including computer and computer-peripheral manufacturing, consumer electronics, CAD/CAM, telecommunications, office automation, network and data processing, and graphics display.
The company' seeks to be an efficient and innovative global provider of semiconductor memory solutions.
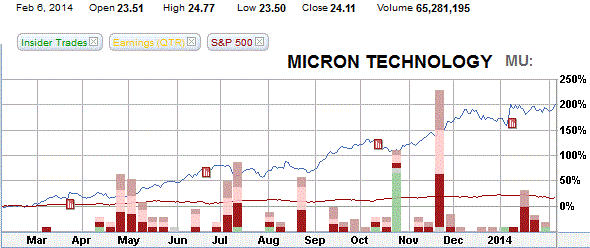
MU's 12-month performance chart shows the stock appreciating 200% versus a 20% gain for the S&P 500 index.
There was some insider buying back in November (see chart).
However, the insider selling dominates.
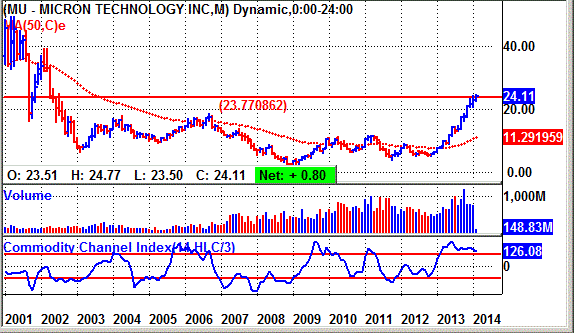
MU's long-term chart shows the stock trading around 7 in 2003. The stock climbed modestly to $17 by 2006 near the peak in the prior bull market.
The stock then fell back to as low as $1.59 during the bear market that ended in 2008 for the stock.
Afterwards, MU rallied to around 11 and then trended sideways for the next few years. However, in 2013 the stock turned higher and is now in a solid up trend. Going back to 2000, the heyday of the developing internet, MU traded as high as $97.
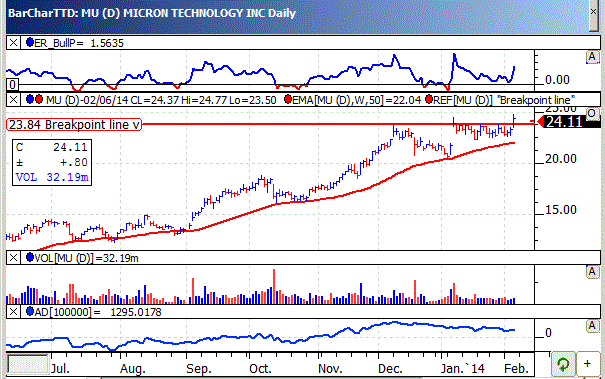
MU's daily chart shows the stock climbing from 13 back in July to a peak near 24. The stock then put down a flat base.
It gaped higher in early January, but then traded sideways.
Thursday, stock drives through key upside resistance with volume expanding.
The stock's TTD momentum indicator (top of chart) is solidly bullish.
The accumulation - distribution line (bottom of chart) lags a bit.
Analysts are looking for earnings for the fiscal year ending in August to soar to $2.13 a share from a loss of 22 cents a year ago.
MU's earnings tend to be very cyclical.
At $2.13 for the year, the stock sells with a price earnings ratio of just 11. 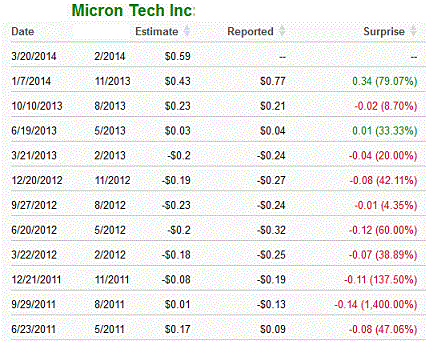
Going out to fiscal 2014 ending in August profits are projected to rise 18% to $2.51 a share.
Net for the upcoming fiscal second quarter ending in February should leap to 59 cents a share from a loss of 24 cents the year before. The highest estimate on the Street is at 80 cents a share. That is high. However, in the prior quarter MU surpassed the Street estimate of 43 cents a share by coming in with 77 cents. So, they can surprise big time.
Going out to the third quarter ending in May, profits are project to skyrocket to 60 cents a share from 4 cents a year before.
Strategy Opinion: TTD is targeting MU for a move to 30 off this breakout. A protective stop can be placed near 22.50.
TTD rates MU a very good intermediate-term play. Semiconductor stocks tend to peak when earnings growth decelerates. We do not see that yet.
Sponsorship: Excellent. The largest fund holder is the 4-star rated Ivy Science and Technology Fund with a 1.7% stake. It was a recent buyer of 927,600 shares. It has 8% of its assets in MU.
Also, the 5-star rated Putnam Capital Spectrum Fund was the largest buyer recently purchasing 5.2 million shares.
MU has 1.1 billion shares outstanding. Institutions hold 99% of the stock.
Insider Activity: Bearish. Insiders have been buyers using stock options at $3 to $5.27. They were recent sellers around $23. Currently, 23 analysts follow the stock, 11 have a buy, down from 13 three months ago.
Stock Performance Chart with Quarterly Earnings Markers.
|
TTD's Breakout Profile
Rating |
| TTD Check List | Bullish | Bearish | Neutral |
| Near 52-week High | YES | ||
| Volume | YES | ||
| Tick Volume | YES | ||
| Price Trend - Daily | YES | ||
| Price Trend - Long Term | YES | ||
| Price Daily Spread | YES | ||
| Base Structure | YES | ||
| Base - A-D | YES | ||
| Earnings-Quarterly | YES | ||
| Earnings-Long Term | YES | ||
| Earnings Outlook | YES | ||
| Industry Group | YES | ||
| Prior Breakout Success | YES | ||
| Fund Sponsorship | YES | ||
| Total Score | 13 | 0 | 1 |
Charts of Selected Breakout Stocks
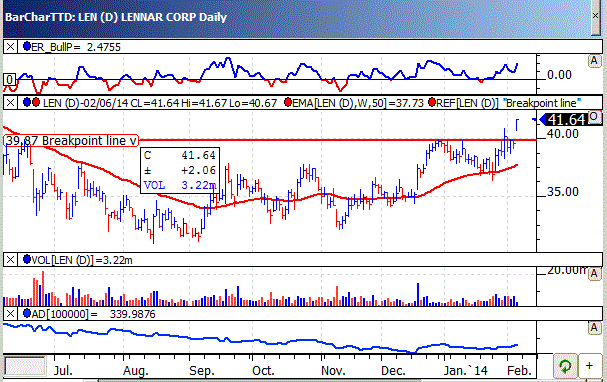
| TTD's Quality Rating of Stock - LEN - ABOVE AVERAGE |
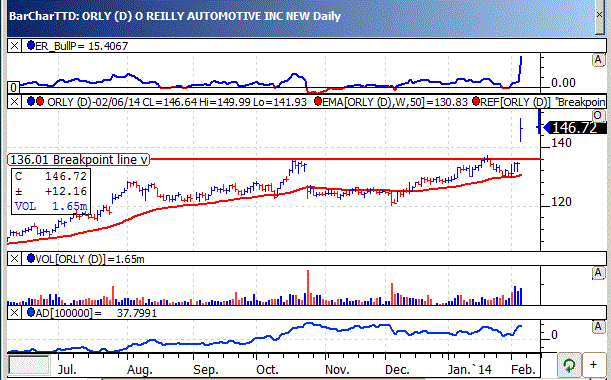
| TTD's Quality Rating of Stock - ORLY - AVERAGE |
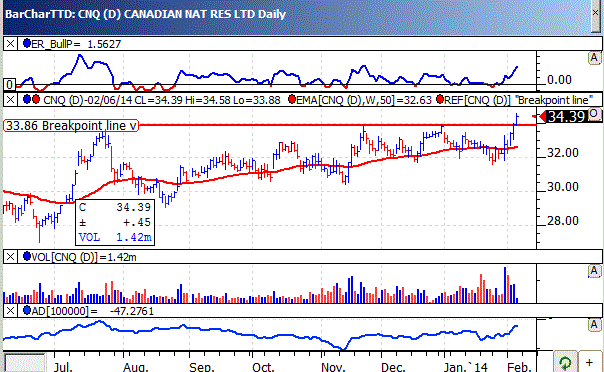
| TTD's Quality Rating of Stock - CNQ - AVERAGE |
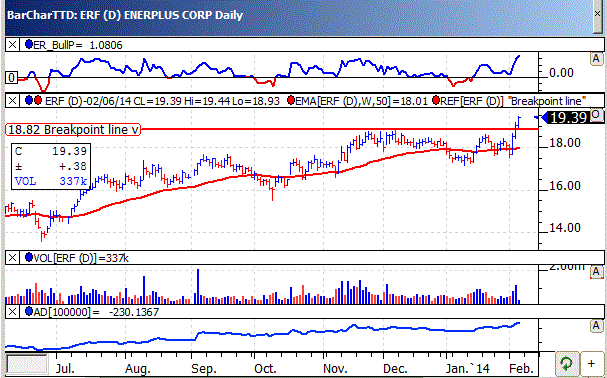
| TTD's Quality Rating of Stock - ERF - BELOW AVERAGE |

Ticker Tape Digest’s Daily List of “Stocks To Sell or Sell Short” ranks stocks well timed to be sold immediately based on daily trading. The list can be used as an alert to reduce current long-term positions.
Shorts from tape action so far today - 9
Stocks Screened - 8,300
Long-Term Environment for bears: Neutral.
Bear Side - Good number of short plays even as the stock market rallies today. Bears remain venturesome. Genomic Health Inc. (GHDX) was TTD's short from the prior session at 26.85. Today, GHDX's stock has moved down to 26.42 and is working well for bears.
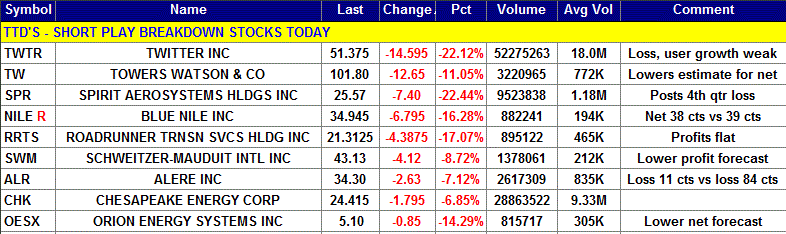
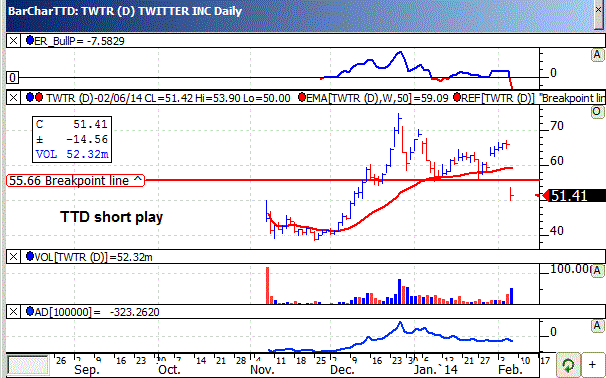
TWTR, based in San Francisco, provides an internet networking service. Annual revenues: $534 million. TWTR's stock falls sharply today after the company reported a loss and a less than enthusiastic growth rate. So far today TWTR is trading 58 million shares, triple its average daily volume of 18 million shares. 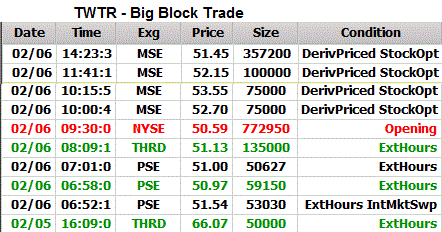
TWTR was highlighted as a short at our midsession video show on the Web.
TWTR reported a loss for the fourth quarter. The stock fell sharply in the morning. It hit an intraday low of 50 in the morning.
In the afternoon, TWTR rose slightly and then trended sideways the rest of the day.
The stock's tape action shows the recent block trades.
One can see the price for the blocks falling from $66.07 in the prior session to as low as $50.59 on Thursday.
A key bearish trade came in the morning when a block of 772,950 shares crossed the tape at $50.59. That was down from the prior block at $51.13 which came in the premarket. That was within a sequence started by a decline from a block at $66.07.
TWTR operates an internet site that enables people to communicate with various types of information.
Its platform allows users to browse through Tweets quickly and explore content more deeply through links, photos, media and other applications that can be attached to each Tweet.
Tweets are limited to 140 characters of text. This constraint makes it easy for anyone to quickly create, distribute and discover content that is consistent across its platform and optimized for mobile devices.
The Company faces competition for users and advertisers. It competes against many companies that attract and engage users and for advertiser spend, including companies with greater financial resources and substantially larger user bases, such as Faceboook, Google, LinkedIn, Microsoft and Yahoo
Analysts are forecasting TWTR will show a loss of 43 cents a share this year compared with a loss of $3.35 in 2013.
TWTR's daily chart shows the stock gapping lower with big volume on Thursday. The move causes the stock to cut below near-term support. The stock's accumulation - distribution line (bottom of chart) is in a down trend indicating clear selling pressure.
Strategy Opinion: TTD is targeting TWTR for a decline to 45. A protective stop buy can be placed near 52.50. The stock has the potential to move even lower.
| TTD's Quality Rating of Stock - TWTR - BELOW AVERAGE |
TTD columnist Leo Fasciocco has covered the stock market for over 20 years. His articles appear in many publications. He is also a speaker at the Intershow conferences. He has been on television and radio. He is author of many educational articles about stock investing and the book “Guide To High-Performance Investing.”

For information to subscribe to the Ticker Tape Digest Services call: B. J. Owen at 1-480-926-1680. Distributed by Corona Publishing Enterprises. Ticker Tape Digest Inc. P.O. Box 2044 Chandler, Az. 85244-2044. TTD “Professional Report” is available on the World Wide Web: $100 per month. Password needed. “TTD Professional“ Faxed is $200 per month. The TTD Daily Report is $39.95. Credit cards accepted.
(The information contained has been prepared from data deemed reliable but there is no guarantee of complete accuracy. Ticker Tape Digest Inc. is not affiliated with any broker, dealer or investment advisor. Nothing in this publication constitutes an offer, recommendation or solicitation to buy or sell any securities. Further research is advised. This report is copyrighted and no redistribution is permitted with out permission.)