![]()
|
|
|
Weekly - Bullish Conservative Investors - Go To TTD Long-Term Plays - Monday, January 27 |
|
Go to Video Show - "How to Make Money With Breakout Stocks |
|---|

By Leo Fasciocco -- TTD
Ticker Tape Digest presents its daily stock market report containing stocks to go long as Breakout Trades, Quick Trades, or Bargain Accumulation Trades.
We also feature stocks under Significant Accumulation that are poised to breakout.
|
Ticker Tape Digest's Daily schedule guide for TTD subscribers 1. Pre-market - check Breakout Watch List and Quick Trades. 2. Morning - (11:30 - 12 A.M.) - check breakout stocks tape and breakout chart slide show. 3. Midday (1 P.M.) check TTD Midsession Report and see market video show. 4. After close (4 P.M.) check final TTD Report for day. Trading Strategies Bullish Aggressive Investors Bullish - "Breakout Stocks" - ideally suited for bull markets and special situation stocks. Potential for large returns. (See Performance) Aggressive Investor Bullish- "Quick Trade Stocks" -ideally suited for entry into top performing issues looking for a small quick profit." (See Performance) Conservative Investors "Bargain Buy Trades for the Long Term." Ideally suited for entry into top performing big cap stocks on pullbacks within overall up trend.(See Performance) Bearish Aggressive Bearish Investors - "Breakdown Stocks" to Sell Short. Ideally suited for bear markets or market pull backs. Potential for large returns (See Performance) |
|---|
The TTD report also contains stocks to short as breakdown plays and as bargain (swing trade) shorts.
Investors should tend to try to go with a strategy that fits with the stock market's trend, unless there is a special situation play.
TTD's Breakout Stocks - Long are
most suitable for aggressive investors seeking ideal entry points into leading stocks, especially during bull markets. They can do extremely well in bull markets with gains of as much as several hundred percent. 
These stocks can also do extremely well during strong market rallies, or if they are in a industry group that is performing very well. They tend to have strong earnings outlooks and are near new-52 week, or all-time highs.
TTD Quick Trade Stocks - Long These are leading issues that have pulled back in recent days, but could move higher soon. They are most suitable for Aggressive Investors willing to trade short term. These stocks will do extremely well during market advances. They have about 74% win rate. During market rally sequences the win rate is even higher. The return is small 3% to 8% in just a few days.
TTD's Bargain Buy Trades - Long - Long Term. These are for conservative bullish Investors These long-term buys are ideally suited for entry into stocks on pull backs within overall up trend. These stocks can give a good return long-term especially during a bull market.
TTD also presents Stocks To Sell or Sell Short. These issues are suitable for aggressive investors willing to take short positions both as trades or for longer-term plays. These stocks will do very well during bear markets or market pull backs.
TTD's Bearish breakdown stocks to sell short. These issues have potential to fall sharply. They often show a technical breakdown and also some fundamental business problem such as weak earnings.
TTD's multi-media updates include a slide-show that presents charts and analysis at midsession. Some times TTD presents feature analysis on stocks and the market. TTD uses Windows Media Files. (WMV).
TTD also presents a "Breakout Watch List" that is up dated daily. This list consists of key stocks in position to breakout. A close watch of this list can put you in the stock just as it breaks out. A good idea is to study the list and be ready to move into a stock quickly as it hits its breakpoint.
TTD often suggests using stop buy orders to enter. It is very important to buy a breakout stock as close as possible to the breakpoint. The idea is to get "elbow room" if the stock should follow through to the upside. This is very important in being successful in making big money with breakout stocks.
It is also essential to have a stop loss strategy for all stocks in which positions are taken. Not every stock will work as expected. It is important for investors to "police" their portfolios and avoid getting trapped in any bad positions.
Quality rating of breakout Two key factors: 1 - Stock near all-time high in price or near a 52-week high. 2 - earnings growth current year is strong. The ideal play is a stock with an Above Average Quality Rating. The stock is near a new high and will have strong earnings. TTD's other ratings are Average and Below Average.
TTD also has special feature sections on Educational Tips on Investing.
To email Mr. Leo Fasciocco leo@tickertapedigest.com.
For service, email Beverly Owen owen@tickertapedigest.com. TTD’s Tel: 1-480-878-8381 or 480-704-3331.
Thursday - February 6, 2020
TTD's Breakout Stocks
Stock Market Overview
Total Buy Breakouts - 14
Quality of Breakouts - Average.
Stocks Screened - 12,234
Bull side - Large list of breakouts with some good looking plays for aggressive bulls.
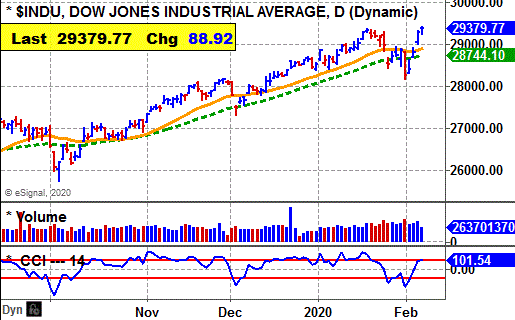
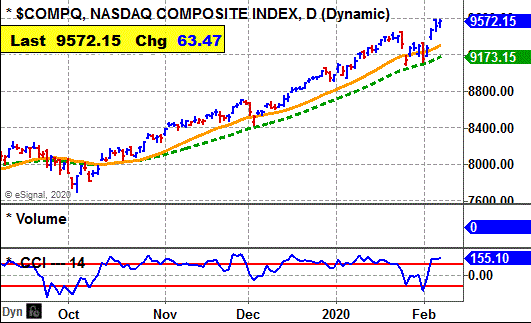
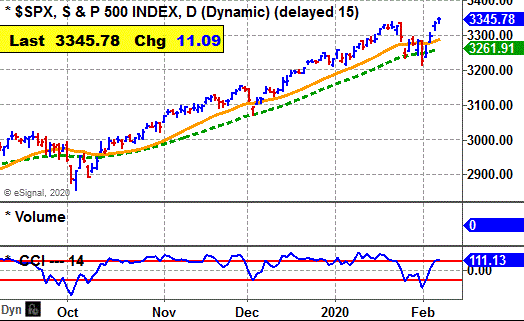
Stock market - Major average are bullish in all time sectors.
Comment - Bulls can be venturesome especially for breakouts with strong earnings.
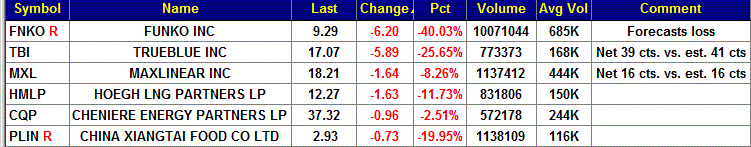
See Latest Earnings Reports - A company that tops the Street's highest earnings estimate has potential to go higher. Key earnings beats - OIIM, NYT, VSTO, TGI, CAH and HAIN.
Stock Market Momentum
(Daily is based on a moving average)
|
Market (Daily) |
Market (Weekly) |
Market (Monthly) |
|
Dow - Bullish |
Dow - Bullish |
Dow - Bullish |
|
Nasdaq - Bullish |
Nasdaq - Bullish |
Nasdaq - Bullish |
|
S&P 500 - Bullish |
S&P 500 - Bullish |
S&P 500 - Bullish |
 Ticker Tape Digest's
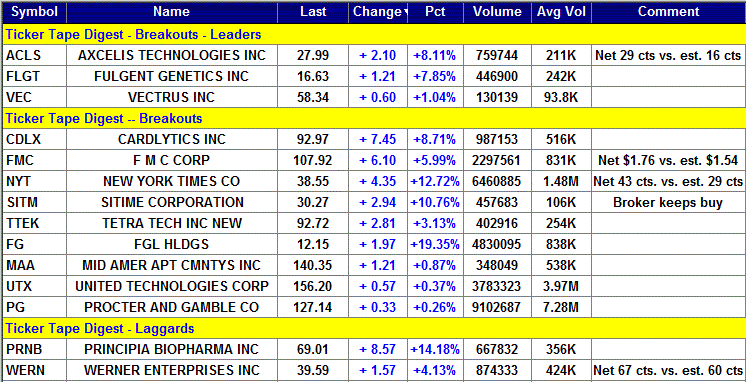
|
TTD's Quality Rating of Stock - ACLS - ABOVE AVERAGE |
ACLS, based in Beverly, Ma., makes ion implantation and other processing equipment used to fabricate semiconductor chips.  Annual revenues: $443 million. ACLS's stock drives higher Thursday and breaks out from its 8-week flat base.
So far today, ACLS is trading a heavy 759,744 shares, triple its average daily volume of 211, 000 shares.
The breakout was triggered by strong earnings.
TTD sees more on the upside.
ACLS reported net for the fourth quarter of 29 cents a share topping the Street estimate of 16 cents a share. 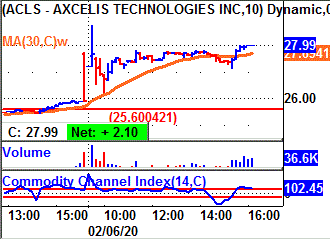
ACLS's stock shot higher in the morning and cleared its breakpoint line.
The stock reached an intraday high of $28.75 in the morning.
The stock pulled back and then lifted to around $27.50 and tended mostly sideways the rest of the day.
Tape Action
ACLS's tape action shows the recent block trades.
One can see the price for the blocks climbing from $25.89 in the prior session to as high as $28.32 in the morning.
A key bullish trade came in the morning when a block of 9,776 shares (duplicated) crossed the tape at $27.61.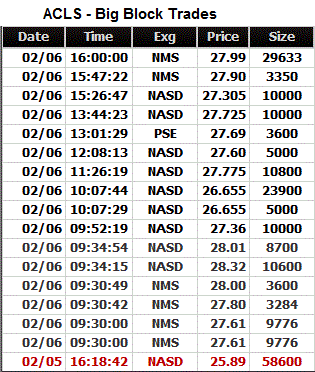
That was up from the prior block the day before at $25.89 on 58,600 shares.
Business
ACLSprovides aftermarket lifecycle products and services, including used tools, spare parts, equipment upgrades, maintenance services and customer training.
The company offers a complete line of high energy, high current and medium current implanters for all application requirements.
The Company's Purion XE high energy system combines its radio frequency (RF) Linac high energy, spot beam technology with the Purion platform. The Company also offers the Purion M medium current system.
ACLS's purion H high current system is extendable into ultra-low energy applications to satisfy future process requirements, including leakage current performance.
Charts
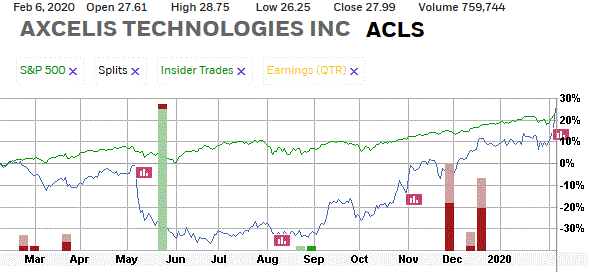
ACLS's 12-month performance chart shows the stock up 25% versus a 22% gain for the stock market.
ACLS insiders were recent buyers at $6.40 to $7.96 a share using stock options.
They were sellers at $22 to $23 a share.
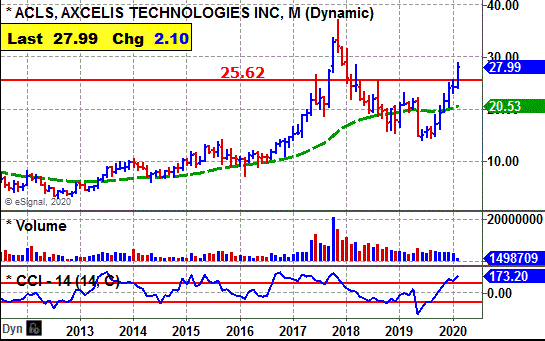
ACLS's long-term chart shows the stock climbing from $4 back in 2012 to a peak at $37.05 by 2017.
The stock fell back to $15 by 2019. However, it is now on the move higher and getting in range to challenge its all-time high.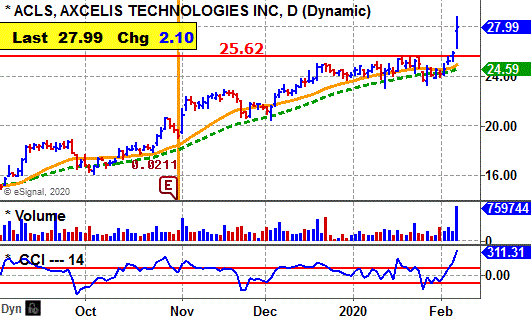
ACLS's daily chart shows the stock climbing from $16 back in October to $24 by December.
The stock put down a tight flat base.
The breakout comes with a widening of the daily spread and expanding volume.
That is very bullish.
ACLS's CCI momentum indicator is very bullish.
Earnings Outlook
This year, analysts are forecasting a robust 110% surge in net to $1.05 a share from the 50 cents the prior year.
The highest estimate on the Street is at $1.15 a share from four analysts.
Looking out to 2021, the Street predicts a 68% jump in net to $1.77 a share from the anticipated $1.05 this year.
Net for the upcoming first quarter should rise 17% to 21 cents a share from the 18 cents the prior year.
The highest estimate is at 23 cents a share. TTD sees good chances for an upside surprise. The company beat the quarterly Street estimate the past four quarters by 13 cents a share, 3 cents, 5 cents and 7 cents.
Going out to the second quarter, net is projected to climb to 26 cents a share versus just 2 cents the prior year.
Strategy Opinion: TTD is targeting ACLS for a move to $34 within the next few months, or sooner.
A protective stop can be placed near $25.
Intermediate-Term Rating: Average.
Suitability: Average Bulls.
TTD's special research of Stock's Prior Performance:
|
Breakout Success |
Bullish |
ACLS scored big gains off recent breakouts. |
|
Response to Net |
Bullish |
ACLS rose 8 times after 14 earnings reports. |
|
Seasonal Success |
Bullish |
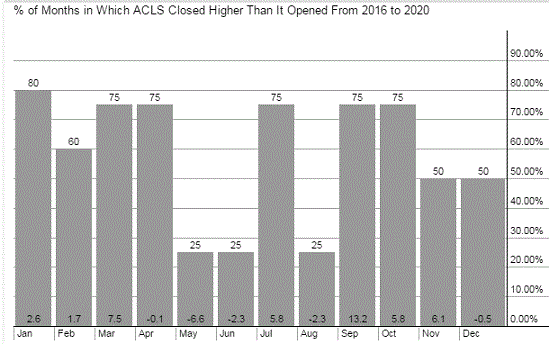
ACLS avg. gain 1.7% in Feb., 7.5% in March in prior years. |
|
Earnings Beats |
Bullish |
ACLS beat Street net estimate 17 times after 20 reports. |
Stock's Prior Performance After A Breakout
|
Stock's % Change from Breakout to peak - prior to cut below 50-day M/A. |
Date of Breakout |
Break point Price |
Stocks Price Peak after Breakout - prior to cut below 50-day M/A |
Date Trade Closed |
|
46% |
10/24/2019 | 19.15 | 27.99 | Still in play |
|
45% |
8/3/2018 | 25.15 | 36.63 | 11/24/2017 |
|
53% |
3/30/2017 | 16.77 | 25.65 | 6/8/2017 |
|
64% |
5/16/2013 | 5.76 | 9.44 | 10/24/2103 |
(In actual trading, entry and exit points could vary depending on broker execution.
Also, ideal are breakouts to a new 52-week high or better, perhaps all-time highs.)
Stock's Long-term Chart
Stock's Performance Chart with Quarterly Earnings Markers vs. S&P 500
Insider Buying in Green - Insider Selling in Red
Stock's Monthly Seasonal Performance Chart - Past 5 Years
Showing % Months UP and % Change
| TTD's Breakout Profile Rating Axcelis Technologies Inc. (ACLS ) |
| TTD Check List | Bullish | Bearish | Neutral |
| Near 52-week High | YES | ||
| Volume | YES | ||
| Tick Volume | YES | ||
| Price Trend - Daily | YES | ||
| Price Trend - Long Term | YES | ||
| Price Daily Spread | YES | ||
| Base Structure | YES | ||
| Base - A-D | YES | ||
| Earnings-Quarterly | YES | ||
| Earnings-Long Term | YES | ||
| Earnings Outlook | YES | ||
| Industry Group | YES | ||
| Prior Breakout Success | YES | ||
| Fund Sponsorship | YES | ||
| Total Score | 13 | 0 | 1 |
Charts of Selected Breakout Stocks
|
TTD's Quality Rating of Stock - FLGT - ABOVE AVERAGE |

|
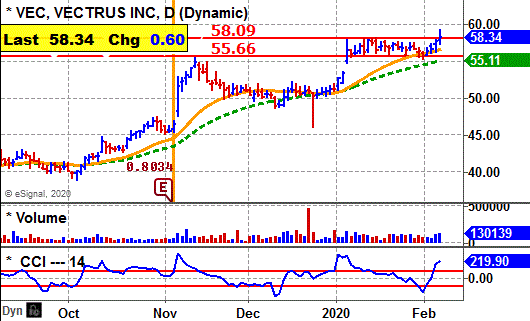
TTD's Quality Rating of Stock - VEC - ABOVE AVERAGE |
|
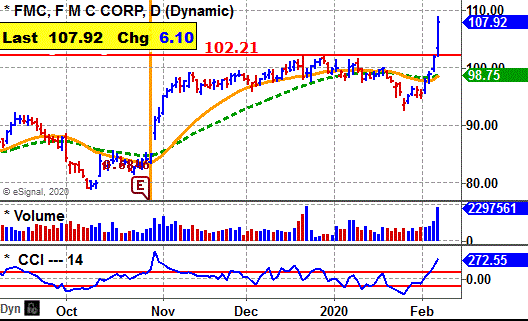
TTD's Quality Rating of Stock - FMC - AVERAGE |
|
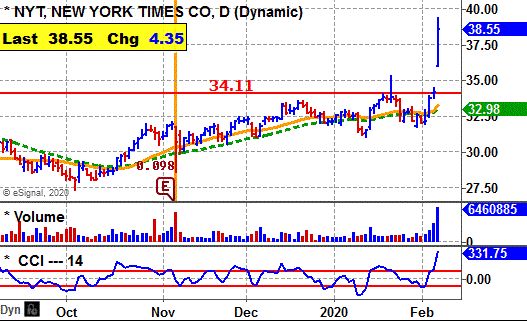
TTD's Quality Rating of Stock - NYT - AVERAGE |

Ticker Tape Digest’s Daily List of “Stocks To Sell or Sell Short” ranks stocks well timed to be sold immediately based on daily trading. The list can be used as an alert to reduce current long-term positions.
Shorts from tape action for Thursday - 6
Stocks Screened - 12,234
Long-Term Environment for bears: Unfavorable.
Bear Side - Small list of shorts but some interesting plays for aggressive bears.
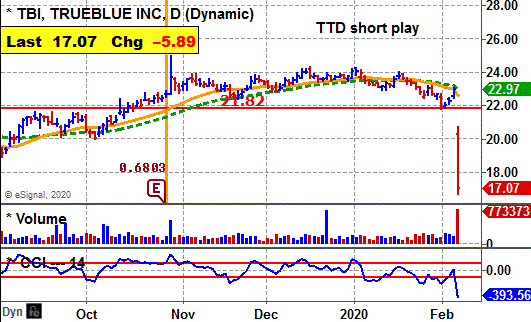
TBI, based in Tacoma, Wa., provides staffing, on-site workforce management and recruitment process outsourcing services. Annual revenues: $2.5 billion. TBI's stock gaps lower Thursday and undercuts key technical support. 
The decline was triggered by disappointing earnings.
So far today, TBI is trading a heavy 773,373 shares, four times its average daily volume of 168,000 shares.
TTD sees more on the downside. 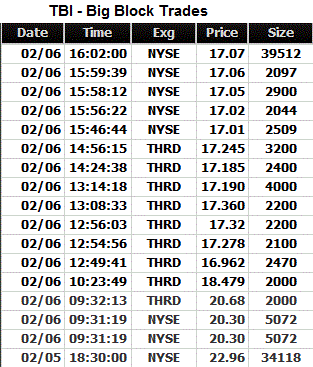
TBI reported net for the fourth quarter of 39 cents a share. That was below the consensus estimate of 41 cents a share.
The stock gapped lower in the morning and undercut key technical support.
TBI's stock fell to an intraday low of $16.71 around noon. It then trended sideways the rest of the day.
Tape Action
TBI's tape action shows the recent block trades.
One can see the price for the blocks falling from $22.96 in the prior session to as low as $16.96 by about noon.
A key bearish trade came in the morning when a block of 5,072 shares (duplicated) crossed the tape at $20.30.
That was down from the prior block at $22.96 on 34,118 shares the prior session.
Business
The Company operates through three segments: PeopleReady, PeopleManagement and PeopleScout.
It provides blue-collar staffing through the PeopleReady service line. Its PeopleManagement segment provides primarily on-premise contingent staffing. Its PeopleScout provides permanent employee recruitment process outsourcing.
Earnings:
This year, analysts predict a 3% decline in net to $1.98 a share from the $2.05 the prior year.
Net for the next two quarters will drop sharply.
Net for the first quarter should be down 30% to 19 cents a share from the 27 cents the prior year. Then in the second quarter, analysts predict a 16% drop in net to 54 cents a share from the 64 cents the prior year.
Charts:
TBI's daily chart shows the gap drop with big volume. The breakdown also sends the stock to a three-year low.
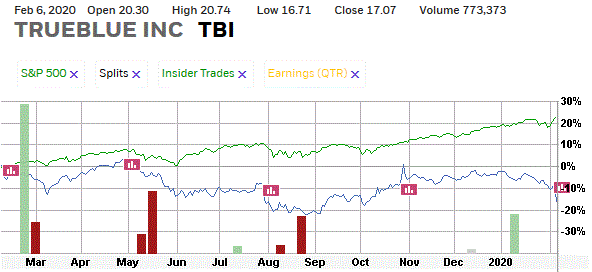
TBI's 12-month performance chart shows the stock down 15% versus a 22% gain for the stock market.
Insiders have been steady sellers the past few months at $23 to $19 a share.
Strategy Opinion: TTD is targeting TBI for a decline to $13 within the next few months, or sooner. A protective stop buy can be placed near $18.50.
Suitability: Aggressive Bears.
TTD's Stock Probability research of Prior Performance:
|
Response to Net |
Bearish |
TBI rose 7 times after 15 earnings reports. |
|
Seasonal Success |
Bearish |
TBI fell 4.6% in Feb., rose 4.3% in March in prior years. |
|
Earnings Beats |
Bullish |
TBI beat Street estimate 16 times after 20 reports. |
|
TTD's Quality Rating of Stock - TBI - BELOW AVERAGE |
Stock's Performance Chart with Quarterly Earnings Markers vs. S&P 500
Insider Buying in Green - Insider Selling in Red
TTD columnist Leo Fasciocco has covered the stock market for over 30 years. His articles appear in many publications. He has also been a speaker at the Money Show conferences. He has been on television and radio. He is author of many educational articles about stock investing and the book “Guide To High-Performance Investing.”

For information to subscribe to the Ticker Tape Digest Services call: Beverly Owen at 1-480-878-8381.
Distributed by Corona Publishing Enterprises. TickerTape Digest Inc. 1220 W. Sherri, Gilbert, Az. 85233.
TTD “Professional Report” is available on the Web: $100 per month. Password needed. Published daily - around 20 times a month.
TTD Pro Report includes a Morning chart slide show of breakout stocks, a Midsession video-audio show with commentary on breakout stocks and shorts and a Final end of day overall report on breakout stocks for the session, short plays and accumulation plays. There are other features too such as Quick Trades and Long-term Plays.
TTD Daily Report is $39. It covers a Morning slide show of charts of stocks breaking out and a TTD end of day print report covering breakout stocks and shorts.
Credit cards accepted. Payable to Corona Publishing Enterprises.
(The information contained has been prepared from data deemed reliable but there is no guarantee of complete accuracy. Ticker Tape Digest Inc. is not affiliated with any broker, dealer or investment advisor. Nothing in this publication constitutes an offer, recommendation or solicitation to buy or sell any securities. Further research is advised. This report is copyrighted and no redistribution is permitted with out permission.)