![]()
|
|
|
Weekly - Bullish Conservative Investors - Go To TTD Long-Term Plays - Monday, February 4, 2019 |
|
|
Go to Video Show - "How to Make Money With Breakout Stocks |
|---|

By Leo Fasciocco -- TTD
Ticker Tape Digest presents its daily stock market report containing stocks to go long as Breakout Trades, Quick Trades, or Bargain Accumulation Trades.
We also feature stocks under Significant Accumulation that are poised to breakout.
|
Ticker Tape Digest's Daily schedule guide for TTD subscribers 1. Pre-market - check Breakout Watch List and Quick Trades. 2. Morning - (11:30 - 12 A.M.) - check breakout stocks tape and breakout chart slide show. 3. Midday (1 P.M.) check TTD Midsession Report and see market video show. 4. After close (4 P.M.) check final TTD Report for day. Trading Strategies Bullish Aggressive Investors Bullish - "Breakout Stocks" - ideally suited for bull markets and special situation stocks. Potential for large returns. (See Performance) Aggressive Investor Bullish- "Quick Trade Stocks" -ideally suited for entry into top performing issues looking for a small quick profit." (See Performance) Conservative Investors "Bargain Buy Trades for the Long Term." Ideally suited for entry into top performing big cap stocks on pullbacks within overall up trend.(See Performance) Bearish Aggressive Bearish Investors - "Breakdown Stocks" to Sell Short. Ideally suited for bear markets or market pull backs. Potential for large returns (See Performance) |
|---|
The TTD report also contains stocks to short as breakdown plays and as bargain (swing trade) shorts.
Investors should tend to try to go with a strategy that fits with the stock market's trend, unless there is a special situation play.
TTD's Breakout Stocks - Long are
most suitable for aggressive investors seeking ideal entry points into leading stocks, especially during bull markets. They can do extremely well in bull markets with gains of as much as several hundred percent. 
These stocks can also do extremely well during strong market rallies, or if they are in a industry group that is performing very well. They tend to have strong earnings outlooks and are near new-52 week, or all-time highs.
TTD Quick Trade Stocks - Long These are leading issues that have pulled back in recent days, but could move higher soon. They are most suitable for Aggressive Investors willing to trade short term. These stocks will do extremely well during market advances. They have about 74% win rate. During market rally sequences the win rate is even higher. The return is small 3% to 8% in just a few days.
TTD's Bargain Buy Trades - Long - Long Term. These are for conservative bullish Investors These long-term buys are ideally suited for entry into stocks on pull backs within overall up trend. These stocks can give a good return long-term especially during a bull market.
TTD also presents Stocks To Sell or Sell Short. These issues are suitable for aggressive investors willing to take short positions both as trades or for longer-term plays. These stocks will do very well during bear markets or market pull backs.
TTD's Bearish breakdown stocks to sell short. These issues have potential to fall sharply. They often show a technical breakdown and also some fundamental business problem such as weak earnings.
TTD's multi-media updates include a slide-show that presents charts and analysis at midsession. Some times TTD presents feature analysis on stocks and the market. TTD uses Windows Media Files. (WMV).
TTD also presents a "Breakout Watch List" that is up dated daily. This list consists of key stocks in position to breakout. A close watch of this list can put you in the stock just as it breaks out. A good idea is to study the list and be ready to move into a stock quickly as it hits its breakpoint.
TTD often suggests using stop buy orders to enter. It is very important to buy a breakout stock as close as possible to the breakpoint. The idea is to get "elbow room" if the stock should follow through to the upside. This is very important in being successful in making big money with breakout stocks.
It is also essential to have a stop loss strategy for all stocks in which positions are taken. Not every stock will work as expected. It is important for investors to "police" their portfolios and avoid getting trapped in any bad positions.
Quality rating of breakout Two key factors: 1 - Stock near all-time high in price or near a 52-week high. 2 - earnings growth current year is strong. The ideal play is a stock with an Above Average Quality Rating. The stock is near a new high and will have strong earnings. TTD's other ratings are Average and Below Average.
TTD also has special feature sections on Educational Tips on Investing.
To email Mr. Leo Fasciocco leo@tickertapedigest.com.
For service, email Beverly Owen owen@tickertapedigest.com. TTDÆs Tel: 1-480-926-1680.
Thursday - February 7, 2019
TTD's Breakout Stocks
Stock Market Overview
Total Buy Breakouts so far today - 5
Quality of Breakouts - Below Average.
Stocks Screened - 12,234
Bull side - Small list of breakouts and very selective.
Stock market - Bullish. All major averages are bullish in all time sectors.
Comment - Bulls be watchful as the stock market could be pulling back now.
See Latest Earnings Reports - A company that tops the Street's highest earnings estimate has potential to go higher. Earnings beats for Thursday - ATEN, PTEN, EPC and PXLW.
Stock Market Momentum
(Daily is based on a moving average)
|
Market (Daily) |
Market (Weekly) |
Market (Monthly) |
|
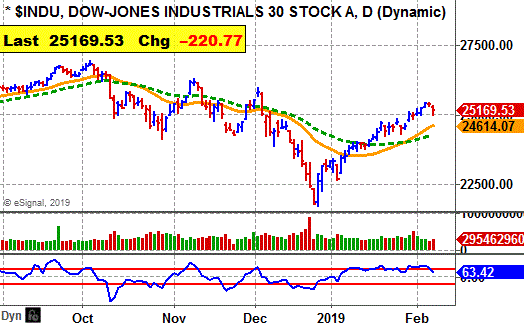
Dow - Bullish |
Dow - Bullish |
Dow - Bullish |
|
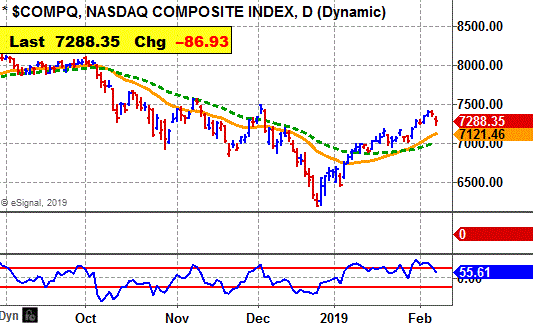
Nasdaq - Bullish |
Nasdaq - Bullish |
Nasdaq - Bullish |
|
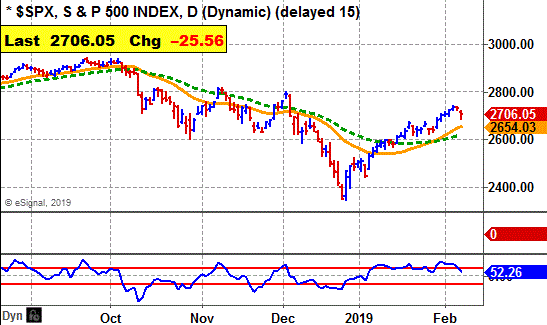
S&P 500 - Bullish |
S&P 500 - Bullish |
S&P 500 - Bullish |
 Ticker Tape Digest's
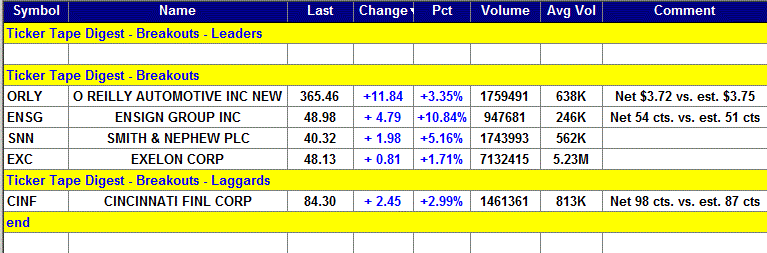
|
TTD's Quality Rating of Stock - ORLY - AVERAGE |
ORLY, based in Springfield, Mo. operates stores selling auto parts. Annual revenues: $9 billion. ORLY moves higher Thursday and breaks out from its 13-week flat base. 
The move carries ORLY to a new all-time high.
So far today, ORLY is trading a heavy 1.8 million shares, triple its average daily volume of 638,000 shares.
The move comes even when ORLY reports fourth quarter net slightly below Street estimates. It came in with net of $3.72 a share. The consensus estimate on the Street was at $3.76 a share from six analysts. 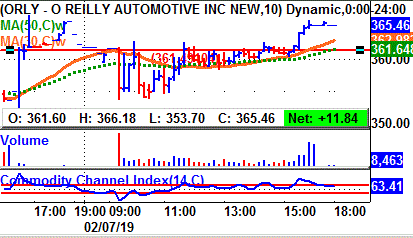
One can see on the 10-minute chart, ORLY moving lower in the morning.
However, the stock rallied to get close to its breakpoint line.
Then late in the session the stock pushed higher to breakout from its base.
Tape Action
ORLY's tape action shows the recent block trades.
One can see the price for the blocks climbing from $355.83 in the morning to as high as $366.
A key bullish trade came in the morning when a block of 6,500 shares crossed the tape at $359.57.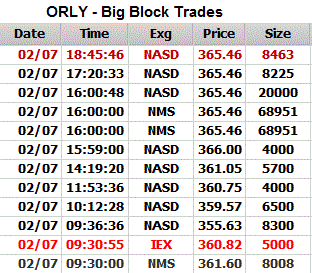
That was up from the prior block trade at $355.63 on 8,300.shares near the opening.
Near the close a massive block of 68,951 shares (duplicated) crossed the tape at $365.46.
That came on a down tick from the prior trade at $365.48 on 100 shares.
Business
ORLY's stores sell auto aftermarket parts, tools, supplies and equipment.
The company sells its products to both do-it-yourself and professional service providers.
ORLY sells alternators, starters, fuel pumps, water pumps, brake system components, batteries, belts, hoses, temperature control, chassis parts and other items. They also sell oil, oil filter and battery products.
Charts
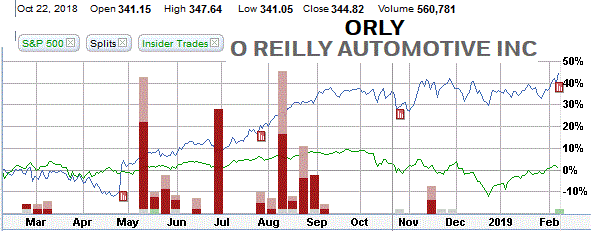
ORLY's 12-month performance chart shows the stock up 45% versus a 3% gain in the stock market.
The stock has done well and has held well again the stock markets drop last year.
Insiders were recent buyers at $28 to $233 a share.
They were sellers at $351 to $280 a share.
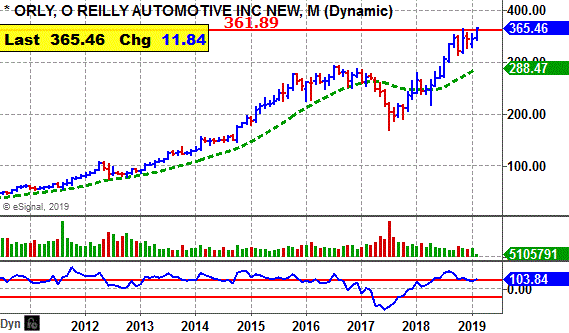
ORLY's long-term chart shows the stock climbing from $41 a share back in 2010 to a peak near $100 by 2012.
The stock based and broke out and raced to a peak at $292 by 2016. It then had another pullback. This time to $169. However, it has since driven higher making an all-time high Thursday. 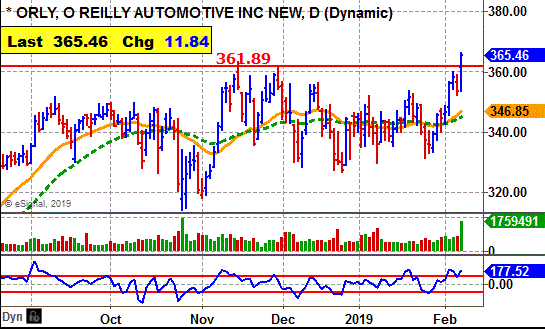
ORLY's daily chart shows the stock touching a peak near $361 in November.
The stock pulled back and formed a flat base.
ORLY's breakout comes with an expansion in volume.
The stock's CCI momentum indicator (bottom of chart) is solidly bullish.
Earnings Outlook
For 2019, analysts are forecasting an 11% gain in profits to $17.91 a share from the $16.10 the year before.
The stock sells with a price-earnings ratio of 20. TTD sees that as reasonable.
Going out to 2020, the Street is calling for an 10% rise in profits to $19.73 a share from the anticipated $17.91 for 2019.
Profits for the first quarter of 2019 are expected to climb 13% to $4.09 a share from the $3.61 the year before.
The highest estimate on the Street is at $4.20 a share. TTD sees chances for an upside earnings surprise.
The company beat the consensus estimate the past 16 times out of the past 20 quarters.
Profits for the second quarter of 2019 are expected to rise 10% to $4.69 a share from the $4.28 the year before.
Strategy Opinion: TTD is targeting ORLY for a move to $420. A protective stop can be placed $353.
Intermediate-Term Rating: Average.
Suitability: Average Bulls.
TTD's special research of Stock's Prior Performance:
Probability - Breakout Success - Bullish- ORLY scored some solid gains off its recent breakouts. The stock is in a long-term up trend.
Probability - Earnings Response - Bullish - ORLY rose 7 times after the past 10 earnings reports when there was a significant change in price.
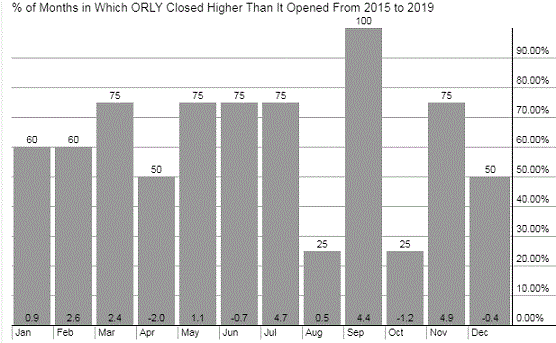
Probability: Seasonal Success - Modestly Bullish. - ORLY averaged a gain of 2.6% in February and a gain of 2.4% in March the past several years.
Stock's Prior Performance After A Breakout
|
Stock's % Change from Breakout to peak - prior to cut below 50-day M/A. |
Date of Breakout |
Break point Price |
Stocks Price Peak after Breakout - prior to cut below 50-day M/A |
Date Trade Closed |
|
19% |
7/19/2018 |
291.03 |
347.72 |
9/11/2018 |
|
24% |
11/28/2017 |
221.09 |
275.93 |
1/24/2018 |
|
22% |
10/23/2014 |
159.16 |
195.06 |
12/23/2014 |
(In actual trading, entry and exit points could vary depending on broker execution.
Also, ideal are breakouts to a new 52-week high or better, perhaps all-time highs.)
Stock's Long-term Chart
Stock's Performance Chart with Quarterly Earnings Markers vs. S&P 500
Insider Buying in Green - Insider Selling in Red
Stock's Monthly Seasonal Performance Chart - Past 5 Years
Showing % Months UP and % Change
| TTD's Breakout Profile Rating O'Reilly Automotive Inc. (ORLY) |
| TTD Check List | Bullish | Bearish | Neutral |
| Near 52-week High | YES | ||
| Volume | YES | ||
| Tick Volume | YES | ||
| Price Trend - Daily | YES | ||
| Price Trend - Long Term | YES | ||
| Price Daily Spread | YES | ||
| Base Structure | YES | ||
| Base - A-D | YES | ||
| Earnings-Quarterly | YES | ||
| Earnings-Long Term | YES | ||
| Earnings Outlook | YES | ||
| Industry Group | YES | ||
| Prior Breakout Success | YES | ||
| Fund Sponsorship | YES | ||
| Total Score | 14 | 0 | 0 |
Charts of Selected Breakout Stocks
|
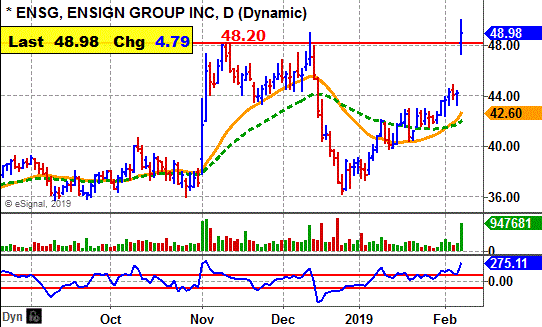
TTD's Quality Rating of Stock - ENSG - AVERAGE |
|
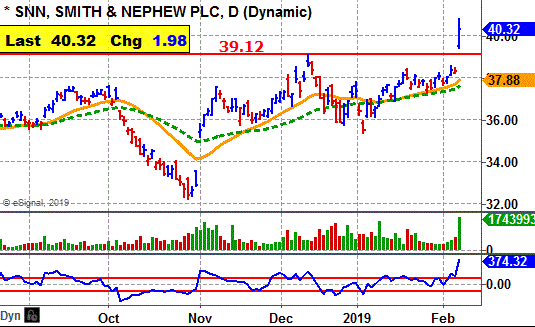
TTD's Quality Rating of Stock - SNN - AVERAGE |
|
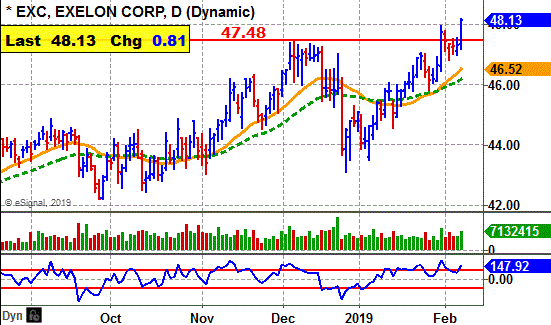
TTD's Quality Rating of Stock - EXC - AVERAGE |
|
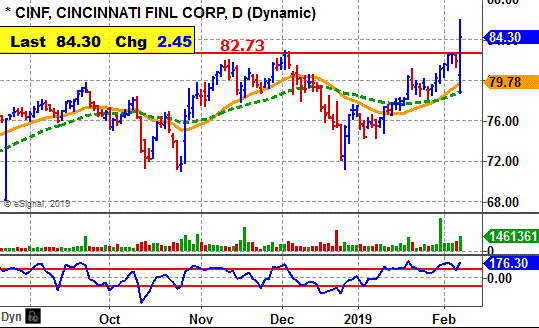
TTD's Quality Rating of Stock - CINF - BELOW AVERAGE |

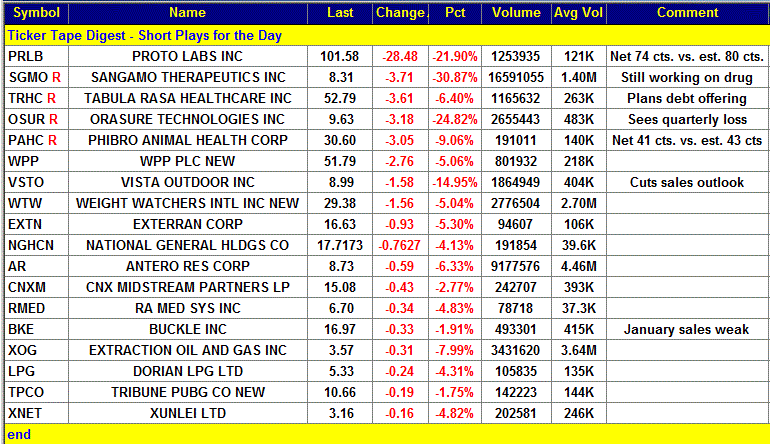
Ticker Tape DigestÆs Daily List of ōStocks To Sell or Sell Shortö ranks stocks well timed to be sold immediately based on daily trading. The list can be used as an alert to reduce current long-term positions.
Shorts from tape action so far today - 18
Stocks Screened - 12,234
Long-Term Environment for bears: Neutral.
Bear Side - Stock market falls sharply Tuesday. Many short plays. Bears can be more active now. Potential for more on the downside as market momentum shifts to the downside.
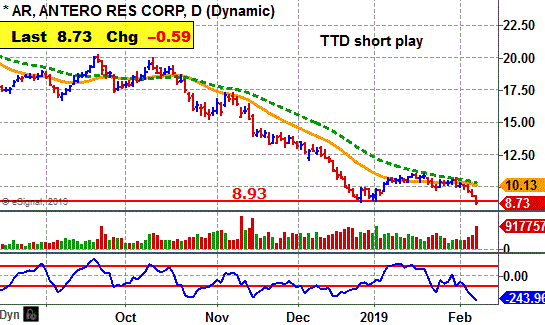
AR, based in Denver, produces oil and natural gas. Annual revenues: $3.7 billion. AR's stock falls sharply Thursday and undercuts key technical support. TTD sees more on the downside. 
So far today, AR is trading a heavy 9.2 million shares, double its average daily volume of 4.5 million shares.
AR's stock moved lower in the morning and by noon had cut well below its support line.
The stock continued lower reaching an intraday low of $8.65 in the late afternoon.
Tape Action
AR's tape action shows the recent block trades.
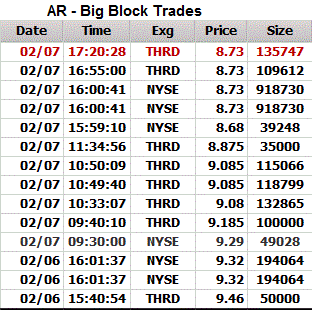 One can see the price for the blocks falling from $9.46 in the prior session to as low as $8.68.
A key bearish trade came late on Wednesday when a block of 194,064 shares crossed the tape at $9.32.
That was down from the prior block at $9.46 on 50,000 shares.
Business
AR explore for natural gas, natural gas liquids and oil in the Appalachian Basin.
The company's segments include the exploration, development and production of natural gas, NGLs and oil.
AR's subsidiary, Antero Midstream Partners LP is a master limited partnership, which owns midstream energy infrastructure primarily to service its production.
Earnings:
Analysts expect net for 2018 to jump 230% to $1.09 a share from the 33 cents the year before.
Net for the fourth quarter should jump 70% to 39 cents a share from the 23 cents the year before.
The company did miss on earnings three out of the past four quarters.
Looking out to this year, analysts predict a 62% drop in net to 41 cents a share from the anticipated $1.09 for 2018.
Net for the first quarter should be down 27% to 32 cents a share from the 44 cents the year before.
Charts:
AR's daily chart shows the stock declining from $20 back in October down to around $10 by December.
The stock tried to form a bottom. However, it breaks below support with volume.
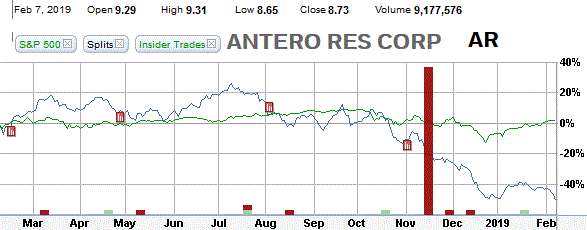
AR's 12-month performance chart shows the stock falling 50% versus a 3% gain for the stock market. Insiders have been recent sellers at $12 to $16 a share. They have not done any buying.
Strategy Opinion: TTD is targeting AR for a decline to 6. A protective stop buy can be placed near $9.60.
Suitability: Aggressive Bears.
TTD's probability research of Prior Performance:
Probability - Earnings Response - Bearish. - AR rose 3 times after the past 8 earnings reports when there was a significant change in price.
Probability: Seasonal Activity - Bearish. - AR averaged a decline of 4% in February and a decline of 0.2% in March the past several years.
|
TTD's Quality Rating of Stock - AR - BELOW AVERAGE |
Stock's Performance Chart with Quarterly Earnings Markers vs. S&P 500
Insider Buying in Green - Insider Selling in Red
TTD columnist Leo Fasciocco has covered the stock market for over 30 years. His articles appear in many publications. He has also been a speaker at the Money Show conferences. He has been on television and radio. He is author of many educational articles about stock investing and the book ōGuide To High-Performance Investing.ö

For information to subscribe to the Ticker Tape Digest Services call: Beverly Owen at 1-480-926-1680.
Distributed by Corona Publishing Enterprises. TickerTape Digest Inc. 1220 W. Sherri, Gilbert, Az. 85233.
TTD ōProfessional Reportö is available on the Web: $100 per month. Password needed. Published daily - around 20 times a month.
TTD Pro Report includes a Morning chart slide show of breakout stocks, a Midsession video-audio show with commentary on breakout stocks and shorts and a Final end of day overall report on breakout stocks for the session, short plays and accumulation plays. There are other features too such as Quick Trades and Long-term Plays.
TTD Daily Report is $39. It covers a Morning slide show of charts of stocks breaking out and a TTD end of day print report covering breakout stocks and shorts.
Credit cards accepted. Payable to Corona Publishing Enterprises.
(The information contained has been prepared from data deemed reliable but there is no guarantee of complete accuracy. Ticker Tape Digest Inc. is not affiliated with any broker, dealer or investment advisor. Nothing in this publication constitutes an offer, recommendation or solicitation to buy or sell any securities. Further research is advised. This report is copyrighted and no redistribution is permitted with out permission.)