Daily - Go to TTD's Chart scroller of Breakout and Leading Stocks - Monday, February 8, 2016
|
Daily - Go to TTD's Chart scroller of Breakout and Leading Stocks - Monday, February 8, 2016 |
|
Weekly - Bullish Conservative Investors - Go To TTD Long-Term Plays - Monday, February 8, 2016 |
|
Go to Video Show - "How to Make Money With Breakout Stocks" |
|---|

By Leo Fasciocco -- TTD
Ticker Tape Digest presents its daily stock market report containing stocks to go long as breakout trades, quick trades, or bargain trades. We also feature stocks under Significant Accumulation that are poised to breakout.
|
Ticker Tape Digest's Daily schedule guide for TTD subscribers 1. Pre-market - check Breakout Watch List and Quick Trades. 2. Morning - (11:30 - 12 A.M.) - check breakout stocks tape and breakout chart slide show. 3. Midday (1 P.M.) check TTD Midsession Report and see market video show. 4. After close (4 P.M.) check final TTD Report for day. Trading Strategies Bullish Aggressive Investors Bullish - "Breakout Stocks" - ideally suited for bull markets and special situation stocks. Potential for large returns. (See Performance) Aggressive Investor Bullish- "Quick Trade Stocks" -ideally suited for entry into top performing issues looking for a small quick profit." (See Performance) Conservative Investors "Bargain Buy Trades for the Long Term." Ideally suited for entry into top performing big cap stocks on pullbacks within overall up trend.(See Performance) Bearish Aggressive Bearish Investors - "Breakdown Stocks" to Sell Short. Ideally suited for bear markets or market pull backs. Potential for large returns (See Performance) |
|---|
The TTD report also contains stocks to short as breakdown plays and as bargain (swing trade) shorts.
Investors should tend to try to go with a strategy that fits with the stock market's trend, unless there is a special situation play.
TTD's Breakout Stocks - Long are
most suitable for aggressive investors seeking ideal entry points into leading stocks, especially during bull markets. They can do extremely well in bull markets with gains of as much as several hundred percent. 
These stocks can also do extremely well during strong market rallies, or if they are in a industry group that is performing very well. They tend to have strong earnings outlooks and are near new-52 week, or all-time highs.
TTD Quick Trade Stocks - Long These are leading issues that have pulled back in recent days, but could move higher soon. They are most suitable for Aggressive Investors willing to trade short term. These stocks will do extremely well during market advances. They have about 74% win rate. During market rally sequences the win rate is even higher. The return is small 3% to 8% in just a few days.
TTD's Bargain Buy Trades - Long - Long Term. These are for conservative bullish Investors These long-term buys are ideally suited for entry into stocks on pull backs within overall up trend. These stocks can give a good return long-term especially during a bull market.
TTD also presents Stocks To Sell or Sell Short. These issues are suitable for aggressive investors willing to take short positions both as trades or for longer-term plays. These stocks will do very well during bear markets or market pull backs.
TTD's Bearish breakdown stocks to sell short. These issues have potential to fall sharply. They often show a technical breakdown and also some fundamental business problem such as weak earnings.
TTD's multi-media updates include a slide-show that presents charts and analysis at midsession. Some times TTD presents feature analysis on stocks and the market. TTD uses Windows Media Files. (WMV).
TTD also presents a "Breakout Watch List" that is up dated daily. This list consists of key stocks in position to breakout. A close watch of this list can put you in the stock just as it breaks out. A good idea is to study the list and be ready to move into a stock quickly as it hits its breakpoint.
TTD often suggests using stop buy orders to enter. It is very important to buy a breakout stock as close as possible to the breakpoint. The idea is to get "elbow room" if the stock should follow through to the upside. This is very important in being successful in making big money with breakout stocks.
It is also essential to have a stop loss strategy for all stocks in which positions are taken. Not every stock will work as expected. It is important for investors to "police" their portfolios and avoid getting trapped in any bad positions.
Quality rating of breakout Two key factors: 1 - Stock near all-time high in price or near a 52-week high. 2 - earnings growth current year is strong. The ideal play is a stock with an Above Average Quality Rating. The stock is near a new high and will have strong earnings. TTD's other ratings are Average and Below Average.
TTD also has special feature sections on Educational Tips on Investing.
To email Mr. Leo Fasciocco leo@tickertapedigest.com.For service, email Beverly Owen owen@tickertapedigest.com. TTD’s Tel: 1-480-926-1680.
Breakout Stocks
Total Buy Breakouts so far today - None
Overall Quality of Breakouts - N/A
Stocks Screened - 8,300
Bull side - No breakouts. Stock market falls sharply, but shaves loss late in day. Bulls be patient and watchful.
(Put mouse on Dow chart to see Nasdaq chart)
Long Term Environment for bulls: Bearish
Stock Market Momentum
Market (Daily) - NYSE Bearish, Nasdaq Bearish
Market (Weekly) - NYSE Bearish, Nasdaq Bearish
Market (Monthly) - NYSE Bearish, Nasdaq Bearish
Ticker Tape Digest's
None
|
TTD's Quality Rating of Stock - WDFC - AVERAGE |
WDFC, based in San Diego, makes cleaning and maintenance products. Annual revenues: $374 million. WDFC's stock is in a nine-week flat base. It is well positioned to breakout at any time. WDFC, a conservative stock, has been a star performance in recent years. 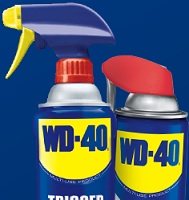
Although the stock market falls sharply Tuesday, WDFC drives higher showing a good bullish divergence.
The stock dipped a bit in the morning, but then pushed steadily higher through the day. 
It closed near its high for the session. That is bullish. (See 10- minute chart)
WDFC is trading 107,183 shares. Its average daily volume is 78,000 shares.
WDFC's tape action shows the recent block trades.
One can see the price for the blocks climbing from $100.50 in the morning to as high as $102.87 during the day.
A key bullish trade came near the close when a block of 4,725 share shares (duplicated) crossed the tape at $102.87.
That was up from the prior block trade at $102.75 on 300 shares. 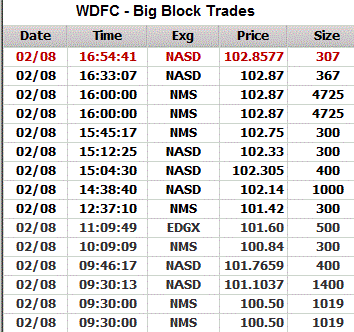
WDFC sells maintenance products, including aerosol sprays, non-aerosol trigger sprays, and in liquid form under the WD-40 Multi-Use brand.
The are used as penetrants, degreasers, corrosion inhibitors, lubricants, and rust removers under the WD-40 brand name.
The company also provides products under the WD-40 Bike product brand consisting of wet and dry chain lubricants, heavy-duty degreasers, foaming wash, and frame protectants for cyclists.
In addition, WDFC offers liquid mildew stain removers and automatic toilet bowl cleaners under the X-14 brand; automatic toilet bowl cleaners under the 2000 Flushes brand; and a range of room and rug deodorizers sold as powder, aerosol quick-dry foam, and trigger spray products under the Carpet Fresh brand.
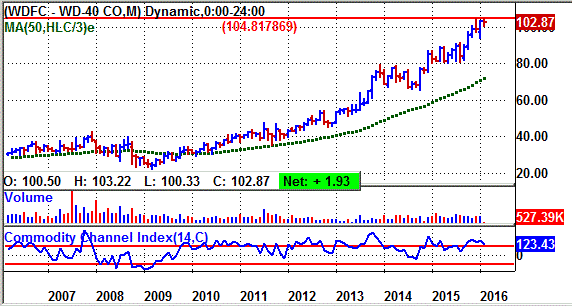
WDFC's 12-month performance chart shows the stock appreciating 25% versus an 8% decline for the stock market.
WDFC's long-term chart shows the stock peaking in 2007 at 42.70, the top in the prior bull market.
The stock then fell back to 21 in 2009 due to the following bear market.
Since then, though, WDFC has climbed steadily reaching an all-time high of 104.99 recently. It is in position to hit a new high and that would be bullish.
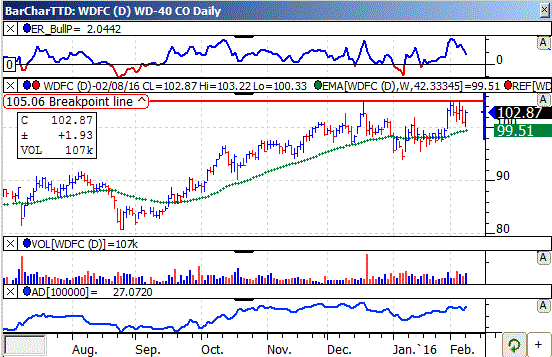
WDFC's daily chart shows the stock climbing from 81 back in August to a peak near 105 by December.
The stock then put down a flat base. It has rallied to the top of the base and could breakout at any time.
The stock's TTD momentum indicator (top of chart) is solidly bullish.
The accumulation - distribution line (bottom of chart) compliments the price action.
WDFC's net for the fiscal year ending in August should climb 10% to $3.36 a share from $3.04 a year ago.
The stock sells with a price-earnings ratio of 30, That is high.
Going out to fiscal 2017 ending in August, the Street projects a 10% gain in net to $3.67 a share from the anticipated $3.36 in fiscal 2016.
Net for the upcoming fiscal second quarter ending in February, analysts predict a 13% rise in net to 86 cents a share from 76 cents the year before. 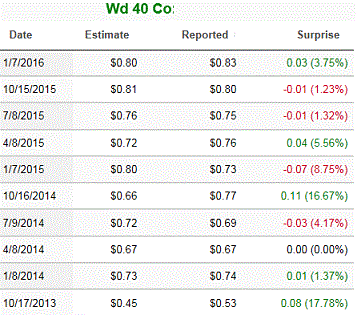
The highest estimate on the Street is at 90 cents a share.
The company tends to come in slightly above or below the Street consensus. So, the earnings need to be watched carefully.
Going out to the fiscal third quarter ending in May, the Street expects a 9% rise in net to 82 cents a share from 75 cents the year before.
Strategy Opinion: TTD suggests a stop buy near 105.20 to enter on a breakout. TTD is targeting the stock for a move to 120 after a breakout.
A protective stop can be placed near 99 to give it some room.
TTD rates WDFC an average intermediate-term play.
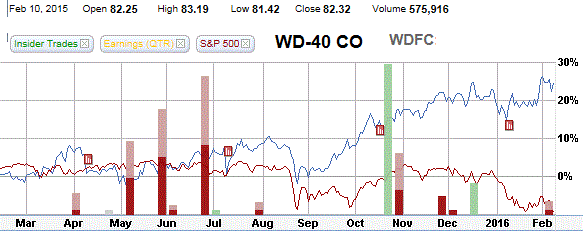
Sponsorship: Good. The largest fund holder is the 5-star rated Parnassus Core Equity Investor Fund with a big 8.5% stake. It has held its position steady.
The largest buyer recently was the 5-star rated William Blair Small-Mid Cap Growth I Fund which purchased 9,400 shares.
WDFC has 14.4 million shares outstanding. Institutions hold 74% of the stock and insiders have 7%.
Insider Activity: Slightly Bearish. Last year, insiders were buyers around $27 using stock options. They were sellers around $89.
Currently, 2 analysts follow the stock and both are neutral. That is down from one buy rating three months ago.
WDFC has a book value of $10.68 a share.
Stock Performance Chart with Quarterly Earnings Markers.
| TTD's Breakout Profile
Rating WD-40 Co. - (WDFC) |
| TTD Check List | Bullish | Bearish | Neutral |
| Near 52-week High | YES | ||
| Volume | YES | ||
| Tick Volume | YES | ||
| Price Trend - Daily | YES | ||
| Price Trend - Long Term | YES | ||
| Price Daily Spread | YES | ||
| Base Structure | YES | ||
| Base - A-D | YES | ||
| Earnings-Quarterly | YES | ||
| Earnings-Long Term | YES | ||
| Earnings Outlook | YES | ||
| Industry Group | YES | ||
| Prior Breakout Success | YES | ||
| Fund Sponsorship | YES | ||
| Total Score | 14 | 0 | 0 |
Charts of Selected Breakout Stocks
None

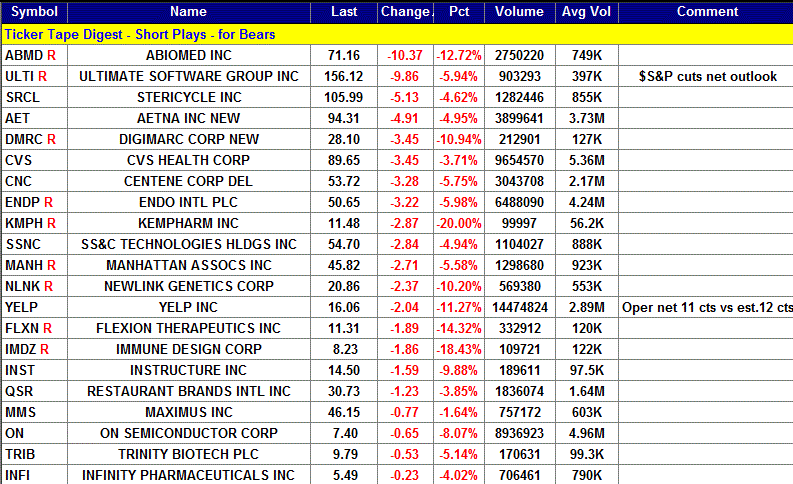
Ticker Tape Digest’s Daily List of “Stocks To Sell or Sell Short” ranks stocks well timed to be sold immediately based on daily trading. The list can be used as an alert to reduce current long-term positions.
Shorts from tape action so far today - 21 - Max
Stocks Screened - 8,300
Long-Term Environment for bears: Favorable.
Bear Side - Large list of shorts Monday as stock market follows through on the downside from Friday's selloff. Market did rally late in the day to cut its loss. Bears can be venturesome.
TTD's short from Friday was Sierra Wireless Inc. (SWIR) at 10.97. Monday, SWIR falls to 10.26 and is working well for bears.
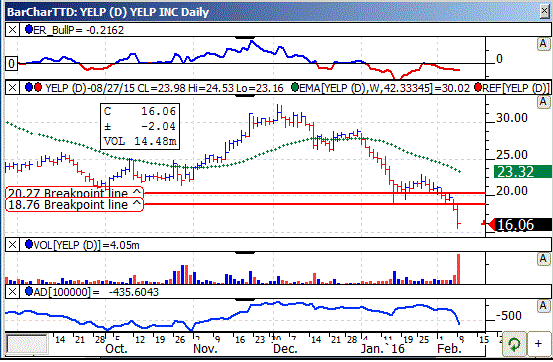
YELP, based in San Francisco, operates an internet website that allows customers to rate businesses. Annual revenues: $505 million. YELP's stock falls sharply after reporting disappointing earnings for the fourth quarter. TTD sees more on the downside. 
So far today, YELP is trading a heavy 14.5 million shares, four times its average daily volume of 2.9 million shares.
YELP reported fourth quarter net from operations of 11 cents a share. The Street consensus was at 12 cents a share.
YELP's stock fell in the morning, pushed higher in the early afternoon, but then faded back down again.
Since early December, YELP's stock has fallen from around 30 to around 16 - almost a 50% drop.
YELP's tape action shows the recent block trades.
One can see the price for the blocks falling from $18.78 in the prior session to as low as $15.88 Monday.
A key bearish trade came in the morning when a block of 62,558 shares crossed the tape at $17.27.
That was down from the prior block trade at $18.10 on 50,748 shares.
YELP operates a platform that connects people with local businesses in the United States. Its platform covers various local business categories, including restaurants, shopping, beauty and fitness, arts, entertainment and events, home and local services, health, nightlife, travel and hotel, auto, and others categories.
The company provides local advertising services, including free and paid business listing services to businesses of various sizes, as well as enable businesses to deliver targeted search advertising to large local audiences through its Website and mobile app.
Analysts are forecasting YELP will show a loss of one cent a share this year. That would compare with a loss of 18 cents a share in 2015.
YELP's daily chart shows the stock trending lower from 32 in December to 20 by January. The stock tried to form a bottom, but falls below support on expanding volume.
The stock's accumulation - distribution line (bottom of chart) has rolled over and shows clear selling pressure.
Strategy Opinion: TTD is targeting YELP for a decline to 12.60 within the next few months, or sooner. A protective stop buy can be placed near 17.50.
| TTD's Quality Rating of Stock - YELP - BELOW AVERAGE |
TTD columnist Leo Fasciocco has covered the stock market for over 20 years. His articles appear in many publications. He is also a speaker at the Intershow conferences. He has been on television and radio. He is author of many educational articles about stock investing and the book “Guide To High-Performance Investing.”

For information to subscribe to the Ticker Tape Digest Services call: Beverly Owen at 1-480-926-1680. Distributed by Corona Publishing Enterprises. Ticker Tape Digest Inc. P.O. Box 2044 Chandler, Az. 85244-2044. TTD “Professional Report” is available on the World Wide Web: $100 per month. Password needed. “TTD Professional“ Faxed is $200 per month. The TTD Daily Report is $39.95. Credit cards accepted.
(The information contained has been prepared from data deemed reliable but there is no guarantee of complete accuracy. Ticker Tape Digest Inc. is not affiliated with any broker, dealer or investment advisor. Nothing in this publication constitutes an offer, recommendation or solicitation to buy or sell any securities. Further research is advised. This report is copyrighted and no redistribution is permitted with out permission.)