Daily - Go to TTD's Chart scroller of Breakout and Leading Stocks - Tuesday, February 9, 2016
|
Daily - Go to TTD's Chart scroller of Breakout and Leading Stocks - Tuesday, February 9, 2016 |
|
Weekly - Bullish Conservative Investors - Go To TTD Long-Term Plays - Monday, February 8, 2016 |
|
Go to Video Show - "How to Make Money With Breakout Stocks" |
|---|

By Leo Fasciocco -- TTD
Ticker Tape Digest presents its daily stock market report containing stocks to go long as breakout trades, quick trades, or bargain trades. We also feature stocks under Significant Accumulation that are poised to breakout.
|
Ticker Tape Digest's Daily schedule guide for TTD subscribers 1. Pre-market - check Breakout Watch List and Quick Trades. 2. Morning - (11:30 - 12 A.M.) - check breakout stocks tape and breakout chart slide show. 3. Midday (1 P.M.) check TTD Midsession Report and see market video show. 4. After close (4 P.M.) check final TTD Report for day. Trading Strategies Bullish Aggressive Investors Bullish - "Breakout Stocks" - ideally suited for bull markets and special situation stocks. Potential for large returns. (See Performance) Aggressive Investor Bullish- "Quick Trade Stocks" -ideally suited for entry into top performing issues looking for a small quick profit." (See Performance) Conservative Investors "Bargain Buy Trades for the Long Term." Ideally suited for entry into top performing big cap stocks on pullbacks within overall up trend.(See Performance) Bearish Aggressive Bearish Investors - "Breakdown Stocks" to Sell Short. Ideally suited for bear markets or market pull backs. Potential for large returns (See Performance) |
|---|
The TTD report also contains stocks to short as breakdown plays and as bargain (swing trade) shorts.
Investors should tend to try to go with a strategy that fits with the stock market's trend, unless there is a special situation play.
TTD's Breakout Stocks - Long are
most suitable for aggressive investors seeking ideal entry points into leading stocks, especially during bull markets. They can do extremely well in bull markets with gains of as much as several hundred percent. 
These stocks can also do extremely well during strong market rallies, or if they are in a industry group that is performing very well. They tend to have strong earnings outlooks and are near new-52 week, or all-time highs.
TTD Quick Trade Stocks - Long These are leading issues that have pulled back in recent days, but could move higher soon. They are most suitable for Aggressive Investors willing to trade short term. These stocks will do extremely well during market advances. They have about 74% win rate. During market rally sequences the win rate is even higher. The return is small 3% to 8% in just a few days.
TTD's Bargain Buy Trades - Long - Long Term. These are for conservative bullish Investors These long-term buys are ideally suited for entry into stocks on pull backs within overall up trend. These stocks can give a good return long-term especially during a bull market.
TTD also presents Stocks To Sell or Sell Short. These issues are suitable for aggressive investors willing to take short positions both as trades or for longer-term plays. These stocks will do very well during bear markets or market pull backs.
TTD's Bearish breakdown stocks to sell short. These issues have potential to fall sharply. They often show a technical breakdown and also some fundamental business problem such as weak earnings.
TTD's multi-media updates include a slide-show that presents charts and analysis at midsession. Some times TTD presents feature analysis on stocks and the market. TTD uses Windows Media Files. (WMV).
TTD also presents a "Breakout Watch List" that is up dated daily. This list consists of key stocks in position to breakout. A close watch of this list can put you in the stock just as it breaks out. A good idea is to study the list and be ready to move into a stock quickly as it hits its breakpoint.
TTD often suggests using stop buy orders to enter. It is very important to buy a breakout stock as close as possible to the breakpoint. The idea is to get "elbow room" if the stock should follow through to the upside. This is very important in being successful in making big money with breakout stocks.
It is also essential to have a stop loss strategy for all stocks in which positions are taken. Not every stock will work as expected. It is important for investors to "police" their portfolios and avoid getting trapped in any bad positions.
Quality rating of breakout Two key factors: 1 - Stock near all-time high in price or near a 52-week high. 2 - earnings growth current year is strong. The ideal play is a stock with an Above Average Quality Rating. The stock is near a new high and will have strong earnings. TTD's other ratings are Average and Below Average.
TTD also has special feature sections on Educational Tips on Investing.
To email Mr. Leo Fasciocco leo@tickertapedigest.com.For service, email Beverly Owen owen@tickertapedigest.com. TTD’s Tel: 1-480-926-1680.
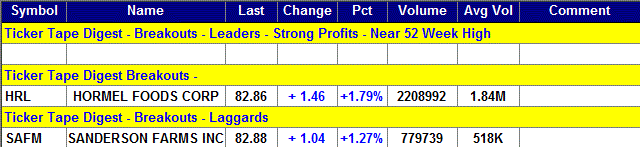
Breakout Stocks
Total Buy Breakouts so far today - 2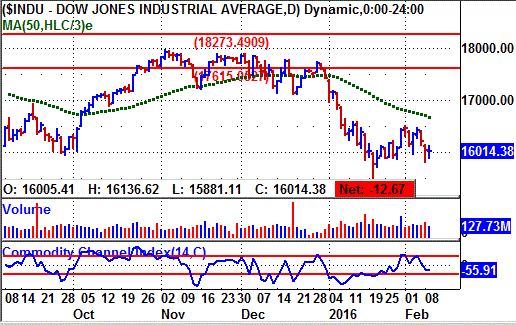
Overall Quality of Breakouts - BELOW AVERAGE
Stocks Screened - 8,300
Bull side - Breakout list small and very selective. Stock market remains in down trend. Whipsaw action Tuesday.
(Put mouse on Dow chart to see Nasdaq chart)
Long Term Environment for bulls: Bearish
Stock Market Momentum
Market (Daily) - NYSE Bearish, Nasdaq Bearish
Market (Weekly) - NYSE Bearish, Nasdaq Bearish
Market (Monthly) - NYSE Bearish, Nasdaq Bearish
Ticker Tape Digest's
|
TTD's Quality Rating of Stock - HRL - AVERAGE |
HRL, based in Austin, Mn., sells meat and food products. Annual revenues: $9.3 billion. HRL, a big cap food stock, breaks out Tuesday from an 8-week flat base. 
The stock had emerged from the base a few weeks ago, but firmed and rallied to clear upside resistance.
The stock's recent action is impressive given that the stock market has declined sharply in recent weeks.
So far today, HRL is trading 2.2 million shares. Its average daily volume is 1.8 million shares.
HRL's stock cleared its breakpoint in the morning. (see 10-minute chart) 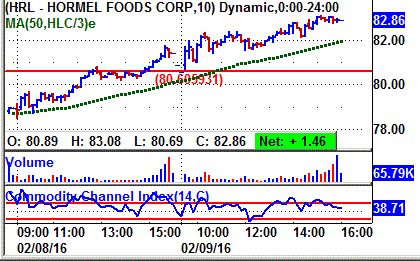
The stock continued to trend higher through the day. It reached an intraday peak of 83.08 in the afternoon.
HRl's tape action shows the recent block trades.
One can see the price for the blocks climbing from $79.40 in the prior session to as high as $82.86 Tuesday.
A key bullish trade came near the close on Tuesday when a block of 60,418 shares crossed at $82.86.
That was up from the prior block at $82.27 on 5,015 shares. 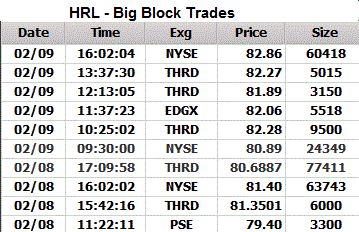
HRL produce perishable meat products, including fresh meats, frozen items, refrigerated meal solutions, sausages, hams, wieners, and bacon.
It also makes shelf-stable products like canned luncheon meats, shelf-stable microwaveable meals, stews, chilies, hash, meat spreads, flour and corn tortillas, salsas, tortilla chips and peanut butter.
HRL also sells poultry products, such as turkey products; and nutritional food products and supplements, sugar and sugar substitutes, dessert and drink mixes, and industrial gelatin products.
HRL's 12-month performance chart shows the stock appreciating a sensational 55% versus an 8% decline for the stock market.
There was some heavy insiders selling in December.
HRL's long-term chart shows the stock reaching a peak of 21 back in 2008, adjusted for a 2-for-1 stock split.
The stock then fell back to 12 later in 2008 due to the bear market.
However, since then HRL has trended steadily higher reaching an all-time peak of 83.08 Tuesday.
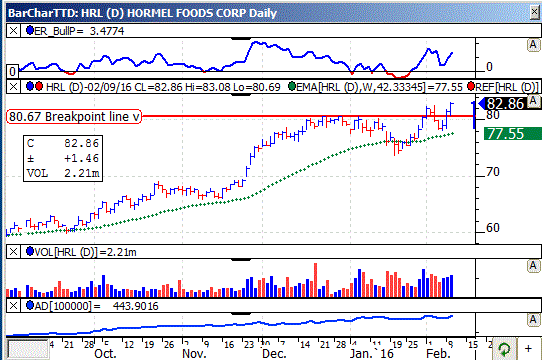
HRL's daily chart shows the stock climbing from 60 in September to a peak near 80 by December.
The stock then put down a flat base with a shake out in January.
HRL rallied and broke out but then faded back.
Tuesday it breaks out again and gets to higher point.
The stock's TTD momentum indicator (top of chart) is strongly bullish.
The accumulation - distribution line (bottom of chart) is trending higher showing good underlying buying.
This fiscal year ending in October, analysts are forecasting an 11% increase in net to $2.92 a share from the $2.64 a year ago. 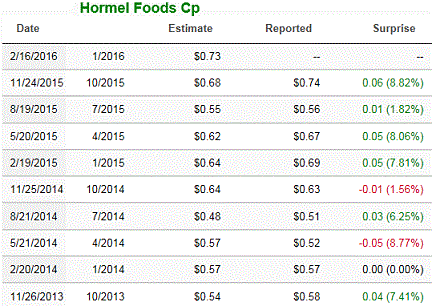
The stock sells with a price-earnings ratio of 28. That is high.
Going out to fiscal 2017, the Street looks for a 7% rise in net to $3.14 a share from the anticipated $2.92 this fiscal year.
Net for the upcoming fiscal first quarter ending in January should rise 5% to 73 cents a share from 69 cents a year ago. The highest estimate on the Street is at 75 cents a share.
The company has topped the consensus estimate the past four quarters.
Going out to the fiscal second quarter ending in April, the Street looks for another 5% gain to 71 cents a share from 67 cents the year before.
Strategy Opinion: HRL is a conservative breakout play. However, it has been working well. It is interesting that firms in the "chicken business" are doing well. They include Tyson and Sanderson Farms.
TTD is targeting HRL for a move to 90 off this breakout. A protective stop can be placed near 79.60.
TTD rates HRL an average intermediate-term play. It does sell with a high valuation based on earnings growth.
Sponsorship: Average. Many ETF and Index funds hold the stock.
HRL has 264 million shares outstanding. Institutions hold 33% of the stock and insiders 49%.
Insider Activity: Slightly Bearish. Insiders have been steady sellers in recent months around $79. They were buyers using stock options at $19 to $24 a share.
Currently, 9 analysts follow the stock, 3 have a buy, up from 2 three months ago.
HRL has a book value of $15.13.
Stock Performance Chart with Quarterly Earnings Markers.
| TTD's Breakout Profile
Rating Hormel Foods Corp. - (HRL) |
| TTD Check List | Bullish | Bearish | Neutral |
| Near 52-week High | YES | ||
| Volume | YES | ||
| Tick Volume | YES | ||
| Price Trend - Daily | YES | ||
| Price Trend - Long Term | YES | ||
| Price Daily Spread | YES | ||
| Base Structure | YES | ||
| Base - A-D | YES | ||
| Earnings-Quarterly | YES | ||
| Earnings-Long Term | YES | ||
| Earnings Outlook | YES | ||
| Industry Group | YES | ||
| Prior Breakout Success | YES | ||
| Fund Sponsorship | YES | ||
| Total Score | 8 | 0 | 6 |
Charts of Selected Breakout Stocks
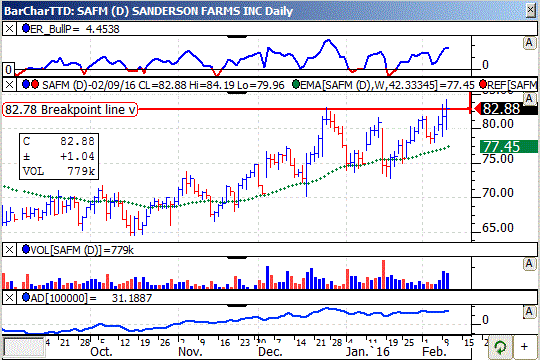
| TTD's Quality Rating of Stock - SAFM - BELOW AVERAGE |

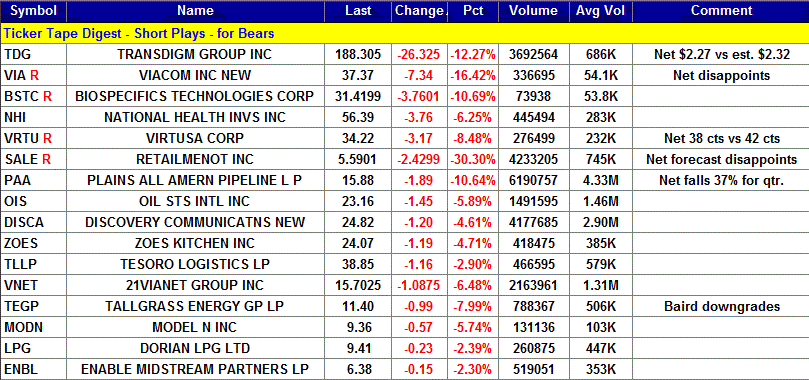
Ticker Tape Digest’s Daily List of “Stocks To Sell or Sell Short” ranks stocks well timed to be sold immediately based on daily trading. The list can be used as an alert to reduce current long-term positions.
Shorts from tape action so far today - 16
Stocks Screened - 8,300
Long-Term Environment for bears: Favorable.
Bear Side - Large number of shorts Tuesday. Stock whips back and forth during the day. Bears can be venturesome.
TTD's short from Monday was Yelp Inc. (YELP) at 16.06. Today, the stock has declined to 15.65 and is working well for bears.
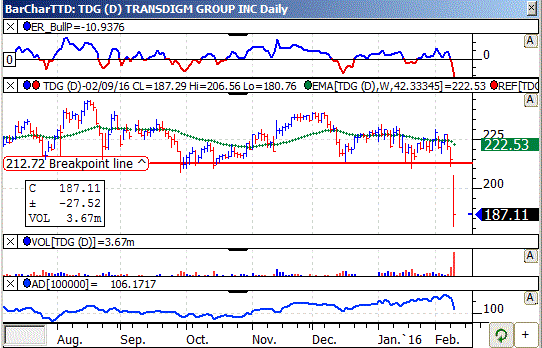
TDG, based in Cleveland, makes aircraft components in the U.S. Annual revenues: $2.7 billion. TDG's stock falls sharply Tuesday after the company came in with quarterly earnings below Street estimates. TTD sees more on the downside. 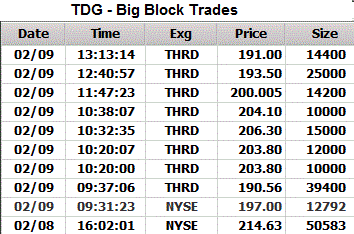
TTD highlighted TDG as a short at our midsession video show on the Web Tuesday.
The company came in with fiscal first quarter earnings of $2.27 a share, excluding special items. That was below the $2.32 a share projected on the Street.
So far today, TDG is trading is trading a heavy 4.3 million shares, six times its average daily volume of 686,000 shares.
TDG's stock gapped lower in the morning touching 185.20.
The stock then rallied back to 206, but then rolled over and fell back to 180.76, its low for the day.
TDG's tape action shows the recent block trades.
One can see the price for the blocks falling to as low 190.56 in the morning on a block of 39,400 shares.
That was down from the prior block at $197 on 12,792 shares.
The company makes mechanical/electro-mechanical actuators and controls, ignition systems, specialized pumps and valves, power conditioning devices, specialized AC/DC electric motors and generators, and cargo loading and handling systems.
This year fiscal year ending in September, the company is forecasting net at $9.48 to $9.72 a share. That is up from a prior forecast range of $9.20 to $9.44. The Street has been forecasting $9.31 a share.
TDG's daily chart shows the stock gapping lower with big volume. The move undercuts key technical support. The TTD momentum indicator (top of chart) has now turned bearish.
Strategy Opinion: TTD is targeting TDG for a decline to 160 within the next few months or sooner. A protective stop buy can be placed near 195.
| TTD's Quality Rating of Stock - TDG - BELOW AVERAGE |
TTD columnist Leo Fasciocco has covered the stock market for over 20 years. His articles appear in many publications. He is also a speaker at the Intershow conferences. He has been on television and radio. He is author of many educational articles about stock investing and the book “Guide To High-Performance Investing.”

For information to subscribe to the Ticker Tape Digest Services call: Beverly Owen at 1-480-926-1680. Distributed by Corona Publishing Enterprises. Ticker Tape Digest Inc. P.O. Box 2044 Chandler, Az. 85244-2044. TTD “Professional Report” is available on the World Wide Web: $100 per month. Password needed. “TTD Professional“ Faxed is $200 per month. The TTD Daily Report is $39.95. Credit cards accepted.
(The information contained has been prepared from data deemed reliable but there is no guarantee of complete accuracy. Ticker Tape Digest Inc. is not affiliated with any broker, dealer or investment advisor. Nothing in this publication constitutes an offer, recommendation or solicitation to buy or sell any securities. Further research is advised. This report is copyrighted and no redistribution is permitted with out permission.)