Daily - Go to TTD's Chart scroller of Breakout and Leading Stocks - Friday, February 12, 2016
|
Daily - Go to TTD's Chart scroller of Breakout and Leading Stocks - Friday, February 12, 2016 |
|
Weekly - Bullish Conservative Investors - Go To TTD Long-Term Plays - Monday, February 8, 2016 |
|
Go to Video Show - "How to Make Money With Breakout Stocks" |
|---|

By Leo Fasciocco -- TTD
Ticker Tape Digest presents its daily stock market report containing stocks to go long as breakout trades, quick trades, or bargain trades. We also feature stocks under Significant Accumulation that are poised to breakout.
|
Ticker Tape Digest's Daily schedule guide for TTD subscribers 1. Pre-market - check Breakout Watch List and Quick Trades. 2. Morning - (11:30 - 12 A.M.) - check breakout stocks tape and breakout chart slide show. 3. Midday (1 P.M.) check TTD Midsession Report and see market video show. 4. After close (4 P.M.) check final TTD Report for day. Trading Strategies Bullish Aggressive Investors Bullish - "Breakout Stocks" - ideally suited for bull markets and special situation stocks. Potential for large returns. (See Performance) Aggressive Investor Bullish- "Quick Trade Stocks" -ideally suited for entry into top performing issues looking for a small quick profit." (See Performance) Conservative Investors "Bargain Buy Trades for the Long Term." Ideally suited for entry into top performing big cap stocks on pullbacks within overall up trend.(See Performance) Bearish Aggressive Bearish Investors - "Breakdown Stocks" to Sell Short. Ideally suited for bear markets or market pull backs. Potential for large returns (See Performance) |
|---|
The TTD report also contains stocks to short as breakdown plays and as bargain (swing trade) shorts.
Investors should tend to try to go with a strategy that fits with the stock market's trend, unless there is a special situation play.
TTD's Breakout Stocks - Long are
most suitable for aggressive investors seeking ideal entry points into leading stocks, especially during bull markets. They can do extremely well in bull markets with gains of as much as several hundred percent. 
These stocks can also do extremely well during strong market rallies, or if they are in a industry group that is performing very well. They tend to have strong earnings outlooks and are near new-52 week, or all-time highs.
TTD Quick Trade Stocks - Long These are leading issues that have pulled back in recent days, but could move higher soon. They are most suitable for Aggressive Investors willing to trade short term. These stocks will do extremely well during market advances. They have about 74% win rate. During market rally sequences the win rate is even higher. The return is small 3% to 8% in just a few days.
TTD's Bargain Buy Trades - Long - Long Term. These are for conservative bullish Investors These long-term buys are ideally suited for entry into stocks on pull backs within overall up trend. These stocks can give a good return long-term especially during a bull market.
TTD also presents Stocks To Sell or Sell Short. These issues are suitable for aggressive investors willing to take short positions both as trades or for longer-term plays. These stocks will do very well during bear markets or market pull backs.
TTD's Bearish breakdown stocks to sell short. These issues have potential to fall sharply. They often show a technical breakdown and also some fundamental business problem such as weak earnings.
TTD's multi-media updates include a slide-show that presents charts and analysis at midsession. Some times TTD presents feature analysis on stocks and the market. TTD uses Windows Media Files. (WMV).
TTD also presents a "Breakout Watch List" that is up dated daily. This list consists of key stocks in position to breakout. A close watch of this list can put you in the stock just as it breaks out. A good idea is to study the list and be ready to move into a stock quickly as it hits its breakpoint.
TTD often suggests using stop buy orders to enter. It is very important to buy a breakout stock as close as possible to the breakpoint. The idea is to get "elbow room" if the stock should follow through to the upside. This is very important in being successful in making big money with breakout stocks.
It is also essential to have a stop loss strategy for all stocks in which positions are taken. Not every stock will work as expected. It is important for investors to "police" their portfolios and avoid getting trapped in any bad positions.
Quality rating of breakout Two key factors: 1 - Stock near all-time high in price or near a 52-week high. 2 - earnings growth current year is strong. The ideal play is a stock with an Above Average Quality Rating. The stock is near a new high and will have strong earnings. TTD's other ratings are Average and Below Average.
TTD also has special feature sections on Educational Tips on Investing.
To email Mr. Leo Fasciocco leo@tickertapedigest.com.For service, email Beverly Owen owen@tickertapedigest.com. TTD’s Tel: 1-480-926-1680.
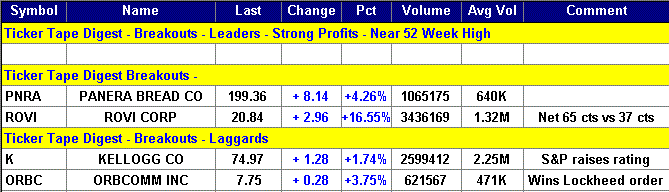
Breakout Stocks
Total Buy Breakouts so far today - 4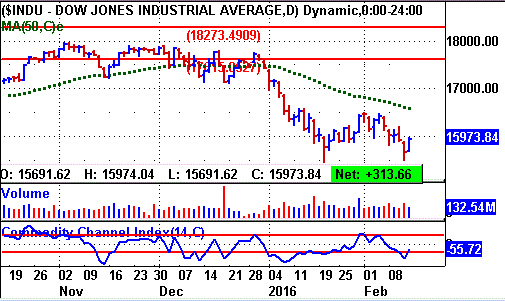
Quality of Breakouts - BELOW AVERAGE
Stocks Screened - 8,300
Bull side - Breakout list small and very selective. Bulls be conservative. Stock market remains in down trend.
(Put mouse on chart to see Nasdaq)
Long Term Environment: Bearish
Stock Market Momentum
Market (Daily) - NYSE Bullish, Nasdaq Bullish
Market (Weekly) - NYSE Bearish, Nasdaq Bearish
Market (Monthly) - NYSE Bearish, Nasdaq Bearish
Ticker Tape Digest's
|
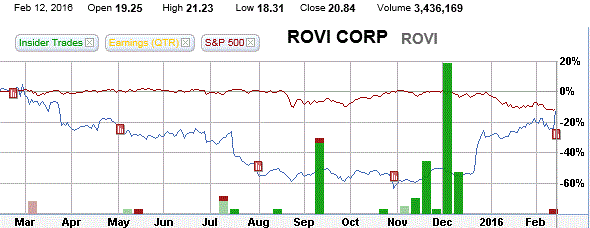
TTD's Quality Rating of Stock - ROVI - AVERAGE |
ROVI, based in Santa Clara, Ca., provides integrated solutions for digital entertainment to service providers and the consumer electronics industry. Annual revenues: $510 million. ROVI's stock breaks out Friday from a seven-week flat base. The move comes on a significant expansion in volume. 
So far today, ROVI is trading a heavy 3.4 million shares, more than double its average daily volume of 1.3 million shares.
TTD highlighted ROVI as a breakout at our midsession video show on the Web Friday.
The stock has been showing heavy insider buying the past several months. (see performance chart with green bars)
ROVI's stock drove higher in the morning to clear its base and the breakpoint zone.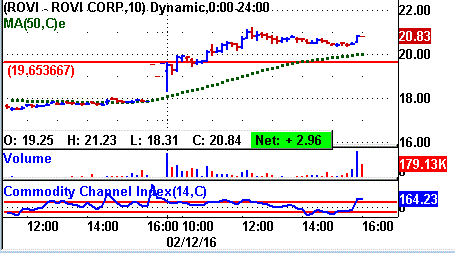
The stock reached an intraday peak of 21.23 around noon.
The stock then pulled back slightly and trended sideways the rest of the day.
It showed good volume late in the day to finish firm.
The tape action is shown by the recent block trades. A look at the chart will show some very heavy institutional buying.
A key bullish trade came in the morning when a block of 29,890 shares crossed the tape at $1925. 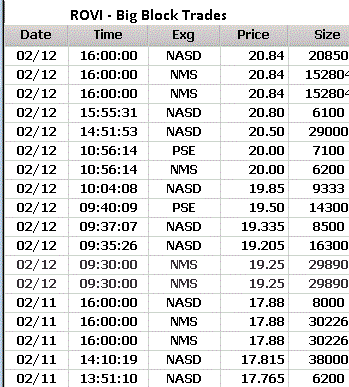
That was up sharply from the prior block at $17.88 on 8,000 shares.
Then near the close a massive block of 153,804 shares (duplicated) crossed at $20.84.
That was up sharply form the prior block at $20.80 on 6,100 shares.
ROVI offers interactive program guides, an interactive listing of television or video program information that enables viewers to navigate and select video programming for viewing and recording.
The company markets IPGs to service providers under i-Guide and Passport brands; and CE industry under the G-GUIDE and HTML Guide brands.
The company also offers xD guide, a discovery application that extends the cable video experience from set-top boxes to multiple mobile screens; and Rovi digital terminal adapter guide, which supports cable operators to remove analog channels to reclaim bandwidth.
ROVI's 12-month performance chart shows the stock off about 9%, the same as the stock market.
However, a key bullish technical is that there was heavy insider buying and then the stock started to perform well.
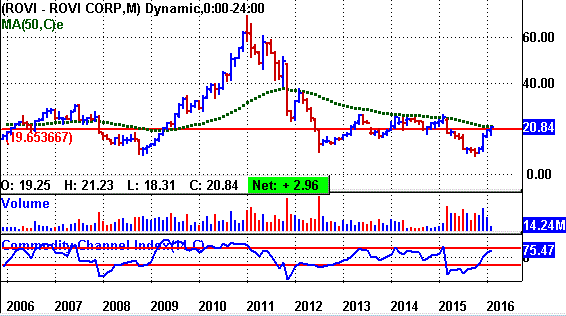
ROVI's long-term chart shows the stock climbing from a bear market low of 9 in 2008 to a peak of 69 in early 2011 - a big move.
However, the tumbled back to 9.90 by 2012. Since then, it has been trending mostly sideways. 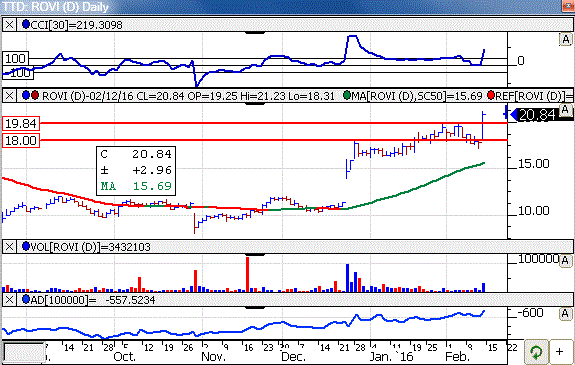
ROVI's daily chart shows the stock climbing from around 9.50 to 18 by December.
The stock then formed a flat base and broke out.
However, the weakness in the stock market stalled its advance.
However, Friday, ROVI drives powerfully out of its base and through its breakpoint zone with expanding volume.
The stock's accumulation - distribution line (bottom of chart) is solidly bullish.
This year, analysts are forecasting a 25% jump in profits to $1.52 a share from the anticipated $1.22 last year.
The stock sells with a price-earnings ratio of just 13. TTD sees that attractive for value investors.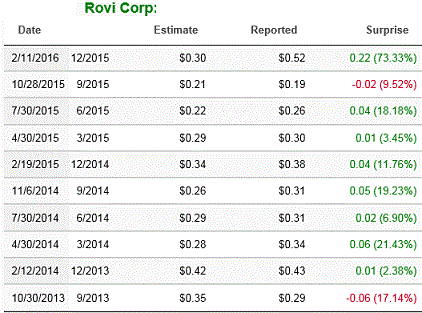
Going out to 2017, the project a robust 49% surge in profits to $2.26 a share from the anticipated $1.52 this year.
Net for the upcoming first quarter is expected to be down 13% to 26 cents a share from 30 cents a year ago.
The highest estimate on the Street is at 26 cents a share too.
However, ROVI has topped the consensus estimate eight of the past nine quarters.
Looking out to the second quarter, profits are projected to rise 19% to 31 cents a share from 26 cents the year before.
Strategy Opinion: ROVI is a speculative breakout. However, it has shown fantastic insider buying and has a good earnings outlook.
TTD is targeting ROVI for a move to $25.50 off this breakout. A protective stop can be placed near 19 giving it some room.
TTD rates ROVI a good intermediate-term play provided earnings meet expectations.
Sponsorship: Excellent. A key fund buyer recently was the 5-star rated FIAM Small Company Pool Fund which purchased 694,800 shares. It has a 1.7% stake.
The largest fund holder is the Columbia Seligman Communications and Info A Fund with a 6.6% stake. The 4-star rated fund was a recent purchaser of 147,100 shares.
ROVI has 82.7 million shares outstanding. Institutions hold 90% of the stock and insiders 1%.
Insider Activity: Bullish. Insiders have buyers last year around $15 to $16 a share. They have done very little selling.
Currently, 5 analysts follow the stock, 4 have a buy, up from 3, three months ago.
ROVI has a book value of $12.06 a share.
Stock Performance Chart with Quarterly Earnings Markers.
| TTD's Breakout Profile
Rating Rovi Corp. - (ROVI) |
| TTD Check List | Bullish | Bearish | Neutral |
| Near 52-week High | YES | ||
| Volume | YES | ||
| Tick Volume | YES | ||
| Price Trend - Daily | YES | ||
| Price Trend - Long Term | YES | ||
| Price Daily Spread | YES | ||
| Base Structure | YES | ||
| Base - A-D | YES | ||
| Earnings-Quarterly | YES | ||
| Earnings-Long Term | YES | ||
| Earnings Outlook | YES | ||
| Industry Group | YES | ||
| Prior Breakout Success | YES | ||
| Fund Sponsorship | YES | ||
| Total Score | 10 | 1 | 3 |
Charts of Selected Breakout Stocks
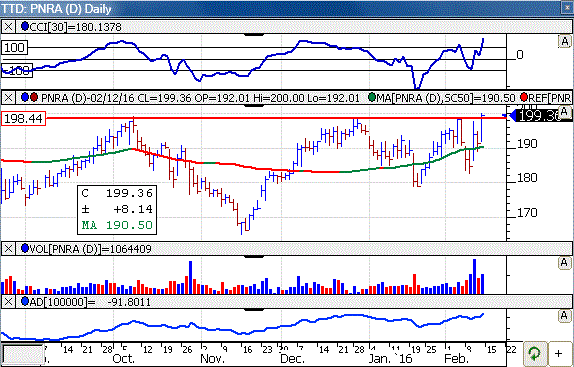
| TTD's Quality Rating of Stock - PNRA - AVERAGE |
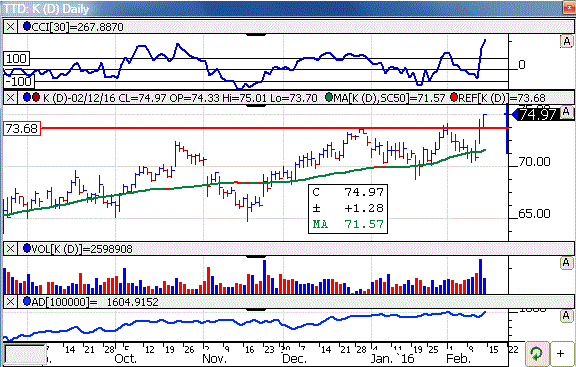
| TTD's Quality Rating of Stock - K - BELOW AVERAGE |
| TTD's Quality Rating of Stock - ORBC - BELOW AVERAGE |


Ticker Tape Digest’s Daily List of “Stocks To Sell or Sell Short” ranks stocks well timed to be sold immediately based on daily trading. The list can be used as an alert to reduce current long-term positions.
Shorts from tape action so far today - 8
Stocks Screened - 8,300
Long-Term Environment for bears: Favorable.
Bear Side - Modest list of breakdown stocks, but some interesting plays with several issues damaged by disappointing earnings.
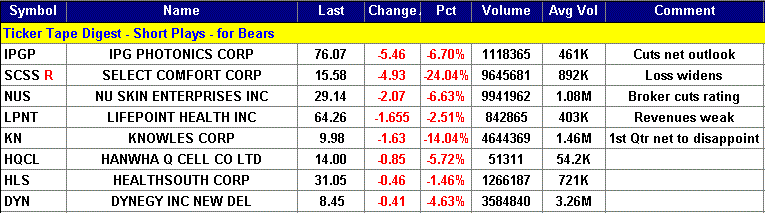
IPGP, based in Oxford, Ma., makes high-performance fiber lasers, fiber amplifiers, and diode lasers used in materials processing worldwide. Annual revenues: $885 million. IPGP's stock falls sharply after the company made a bearish forecast. 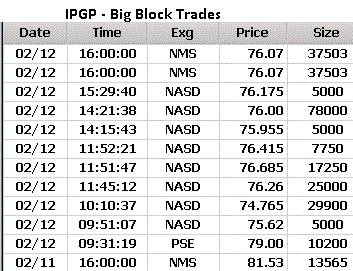
TTD highlighted IPGP as a short at our midsession video show on the Web Friday.
So far today, IPGP is trading a heavy 1.1 million shares, double its average daily volume.
The company reported fourth quarter net rose to $1.14 a share versus Street estimates of $1.09 a share.
However, the company said it sees first quarter net at 88 cents a share to $1.03.
That is below Street estimates of $1.11 a share.
The forecast sent the stock lower.
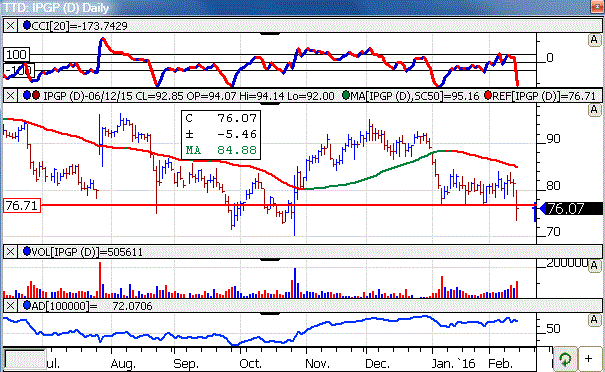
IPGP's stock gapped lower in the morning and touched an intraday low 73.55.
The stock then lifted to around 76 and trended sideways the rest of the day.
The tape action shows the big block trades dropping in price from $81.53 in the prior session to as low as $74.76.
A key bearish trade came in the morning when a block of 10,200 shares crossed the tape at $79.
That was down from the prior block trade at $81.53 on 14,565 shares.
The company's laser products include low, medium, and high output power lasers, fiber pigtailed packaged diodes and fiber coupled direct diode laser systems.
The Street has been forecasting an 18% increase in net to $4.49 a share from $3.79 in 2015. That forecast could come down. Net for the first quarter is expected to be down 2%
IPGP's daily chart shows the stock cutting below key technical support. The TTD momentum indicator (top of chart) is now bearish.
Strategy Opinion: TTD is targeting IPGP for a decline to 68 within the next few months, or sooner. A protective stop buy can be placed near 78.20.
| TTD's Quality Rating of Stock - IPGP - BELOW AVERAGE |
TTD columnist Leo Fasciocco has covered the stock market for over 20 years. His articles appear in many publications. He is also a speaker at the Intershow conferences. He has been on television and radio. He is author of many educational articles about stock investing and the book “Guide To High-Performance Investing.”

For information to subscribe to the Ticker Tape Digest Services call: Beverly Owen at 1-480-926-1680. Distributed by Corona Publishing Enterprises. Ticker Tape Digest Inc. P.O. Box 2044 Chandler, Az. 85244-2044. TTD “Professional Report” is available on the World Wide Web: $100 per month. Password needed. “TTD Professional“ Faxed is $200 per month. The TTD Daily Report is $39.95. Credit cards accepted.
(The information contained has been prepared from data deemed reliable but there is no guarantee of complete accuracy. Ticker Tape Digest Inc. is not affiliated with any broker, dealer or investment advisor. Nothing in this publication constitutes an offer, recommendation or solicitation to buy or sell any securities. Further research is advised. This report is copyrighted and no redistribution is permitted with out permission.)