![]()
|
|
|
Weekly - Bullish Conservative Investors - Go To TTD Long-Term Plays - Monday, February 12, 2018 |
|
|
Go to Video Show - "How to Make Money With Breakout Stocks |
|---|

TTD does not publish Friday. The market is closed Monday for Presidents' Day.
By Leo Fasciocco -- TTD
Ticker Tape Digest presents its daily stock market report containing stocks to go long as Breakout Trades, Quick Trades, or Bargain Accumulation Trades.
We also feature stocks under Significant Accumulation that are poised to breakout.
|
Ticker Tape Digest's Daily schedule guide for TTD subscribers 1. Pre-market - check Breakout Watch List and Quick Trades. 2. Morning - (11:30 - 12 A.M.) - check breakout stocks tape and breakout chart slide show. 3. Midday (1 P.M.) check TTD Midsession Report and see market video show. 4. After close (4 P.M.) check final TTD Report for day. Trading Strategies Bullish Aggressive Investors Bullish - "Breakout Stocks" - ideally suited for bull markets and special situation stocks. Potential for large returns. (See Performance) Aggressive Investor Bullish- "Quick Trade Stocks" -ideally suited for entry into top performing issues looking for a small quick profit." (See Performance) Conservative Investors "Bargain Buy Trades for the Long Term." Ideally suited for entry into top performing big cap stocks on pullbacks within overall up trend.(See Performance) Bearish Aggressive Bearish Investors - "Breakdown Stocks" to Sell Short. Ideally suited for bear markets or market pull backs. Potential for large returns (See Performance) |
|---|
The TTD report also contains stocks to short as breakdown plays and as bargain (swing trade) shorts.
Investors should tend to try to go with a strategy that fits with the stock market's trend, unless there is a special situation play.
TTD's Breakout Stocks - Long are
most suitable for aggressive investors seeking ideal entry points into leading stocks, especially during bull markets. They can do extremely well in bull markets with gains of as much as several hundred percent. 
These stocks can also do extremely well during strong market rallies, or if they are in a industry group that is performing very well. They tend to have strong earnings outlooks and are near new-52 week, or all-time highs.
TTD Quick Trade Stocks - Long These are leading issues that have pulled back in recent days, but could move higher soon. They are most suitable for Aggressive Investors willing to trade short term. These stocks will do extremely well during market advances. They have about 74% win rate. During market rally sequences the win rate is even higher. The return is small 3% to 8% in just a few days.
TTD's Bargain Buy Trades - Long - Long Term. These are for conservative bullish Investors These long-term buys are ideally suited for entry into stocks on pull backs within overall up trend. These stocks can give a good return long-term especially during a bull market.
TTD also presents Stocks To Sell or Sell Short. These issues are suitable for aggressive investors willing to take short positions both as trades or for longer-term plays. These stocks will do very well during bear markets or market pull backs.
TTD's Bearish breakdown stocks to sell short. These issues have potential to fall sharply. They often show a technical breakdown and also some fundamental business problem such as weak earnings.
TTD's multi-media updates include a slide-show that presents charts and analysis at midsession. Some times TTD presents feature analysis on stocks and the market. TTD uses Windows Media Files. (WMV).
TTD also presents a "Breakout Watch List" that is up dated daily. This list consists of key stocks in position to breakout. A close watch of this list can put you in the stock just as it breaks out. A good idea is to study the list and be ready to move into a stock quickly as it hits its breakpoint.
TTD often suggests using stop buy orders to enter. It is very important to buy a breakout stock as close as possible to the breakpoint. The idea is to get "elbow room" if the stock should follow through to the upside. This is very important in being successful in making big money with breakout stocks.
It is also essential to have a stop loss strategy for all stocks in which positions are taken. Not every stock will work as expected. It is important for investors to "police" their portfolios and avoid getting trapped in any bad positions.
Quality rating of breakout Two key factors: 1 - Stock near all-time high in price or near a 52-week high. 2 - earnings growth current year is strong. The ideal play is a stock with an Above Average Quality Rating. The stock is near a new high and will have strong earnings. TTD's other ratings are Average and Below Average.
TTD also has special feature sections on Educational Tips on Investing.
To email Mr. Leo Fasciocco leo@tickertapedigest.com.
For service, email Beverly Owen owen@tickertapedigest.com. TTD’s Tel: 1-480-926-1680.
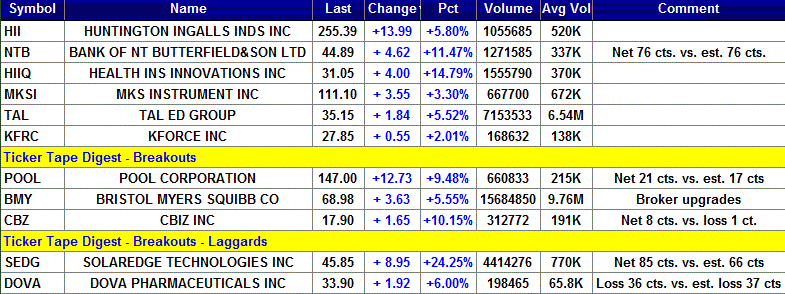
Thursday - February 15, 2018
TTD's Breakout Stocks
Stock Market Overview
Total Buy Breakouts so far today - 11
Quality of Breakouts - Above Average
Stocks Screened - 12,234
Bull side - Good number of interesting breakouts Thursday. Aggressive bulls can be venturesome.
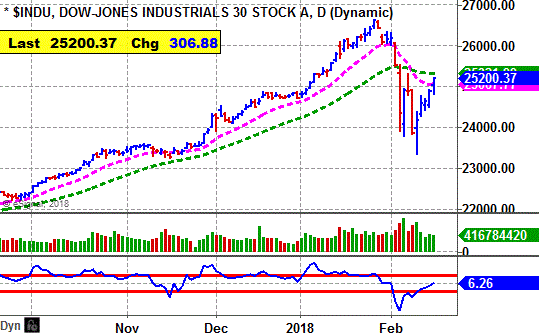
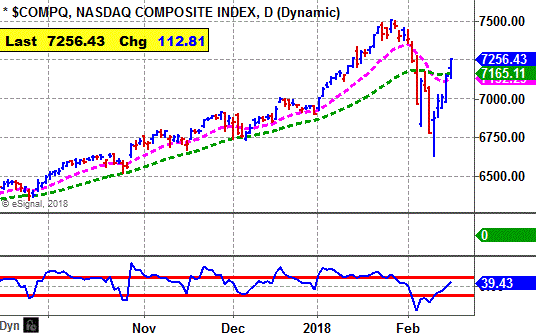
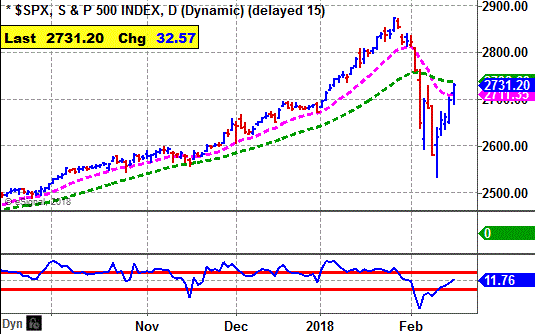
Stock market - Bullish. Market averages are bullish in all time sectors. However, the basic daily pattern shows the stock market in a consolidation after its recent breakdown. The market still remains vulnerable.
Stock Market Momentum
(Daily is based on a moving average)
|
Market (Daily) |
Market (Weekly) |
Market (Monthly) |
|
Dow - Bullish |
Dow - Bullish |
Dow - Bullish, |
|
Nasdaq - Bullish |
Nasdaq - Bullish |
Nasdaq - Bullish |
|
S&P 500 - Bullish |
S&P 500 - Bullish |
S&P 500 - Bullish |
Ticker Tape Digest's
|
TTD's Quality Rating of Stock - HIIQ - ABOVE AVERAGE |
HIIQ, based in Tampa, Fla, develops and administers health insurance plans. Annual revenues: $185 million. HIIQ's stock moves sharply higher Thursday and breaks out from a 10-week flat base. 
TTD highlighted HIIQ as a breakout at our midsession video show on the Web Thursday.
So far today, HIIQ is trading a heavy 1.6 million shares, four times its average daily volume of 370,000 shares. 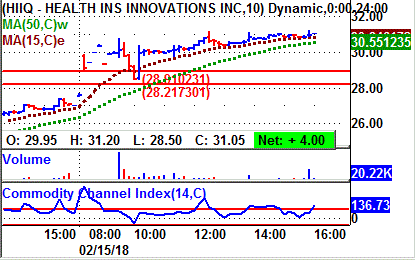
The stock has a low beta of 0.61 versus 1.00 for the stock market.
So, the stock tends to be about only half as volatile as the stock market in general. However, that was not the case Thursday.
HIIQ drove higher in the morning and cleared its breakpoint line.
The stock continued to work gradually higher the rest of the day. It closed near its high for the day. That is bullish.
Tape Action
HIIQ's tape action shows the recent block trades.
One can see the price for the blocks climbing from $27.05 in the prior session to as high as $31.05 Thursday. 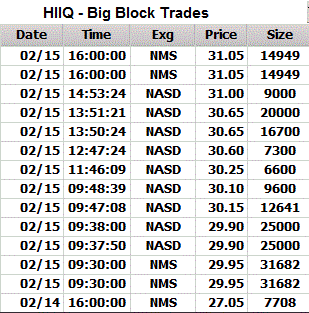
A key bullish trade came in the morning when a block of 31,682 shares crossed the tape at $29.95.
That was up sharply from the prior block at $27.05 on 7,708 shares.
Then near the close a block of 14,949 shares (duplicated) crossed the tape at $31.05. That was up from the prior block at $31 on 9,000 shares.
Business
HIIQ develops and handles cloud-based administration of individual and family health insurance plans.
They include short-term medical insurance plans, and guaranteed-issue and underwritten hospital indemnity plans.
The company also develops additional insurance and non-insurance products, such as pharmacy benefit cards, dental plans, vision plans, cancer/critical illness plans, deductible and gap protection plans, and life insurance policies.
The Company's STM plans are provided up to six months, 11 months, or 364 days of health insurance coverage with a range of deductible and copay levels.
Charts
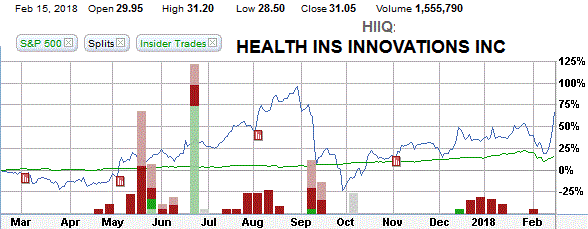
HIIQ's 12-month performance chart shows the stock appreciating a 70% versus a 16% gain for the stock market.
Insiders were recent buyers using stock options at $5 to $6.77 a share. They were sellers around $22 to $28 a share.
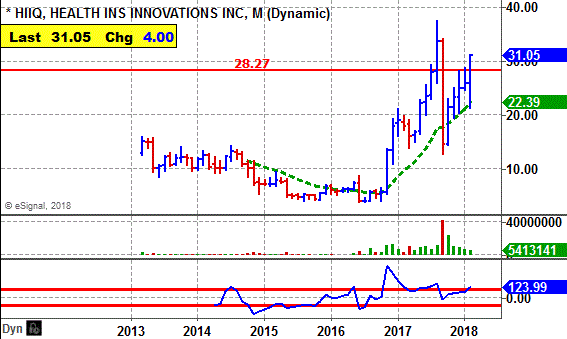
HIIQ's long-term chart shows the stock coming public back in 2013 at $12.98. The stock trended sideways until late 2014 and then tumbled to around $4.
The stock turned up late 2016 and made a big move up to an all-time high of $37.37. It pulled back, rallied and now breaks out. 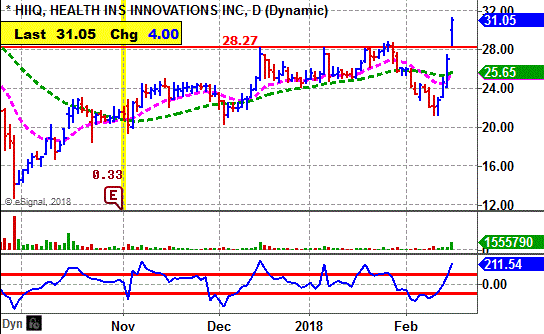
HIIQ's daily chart shows the stock climbing to a peak at $28 by December
It then put down a flat base that had a recent shake out down to $21 due in part to the sharp decline in the stock market.
The breakout Thursday Friday comes with a gap move and an expansion in volume.
That is bullish.
The CCI momentum indicator (bottom of chart) is extremely bullish now.
Earnings Outlook
HIIQ will be reporting fourth quarter net on March 7. The Street is predicting a 2% decline in net to 34 cents a share from 35 cents the year before
The highest estimate is at 38 cents a share.
However, HIIQ has topped the consensus estimate the past 11 quarters.
The company beat the quarterly consensus the past four quarters by 5 cents a share, 13 cents, 5 cents and 17 cents.
Net for 2017 is expected to surge 46% to $1.63 a share from the $1.12 the year before.
Looking out to 2018, the Street is forecasting a 22% increase in net to $1.98 a share from the anticipated $1.63 for 2017.
Net for the first quarter is expected to rise 19% to 43 cents a share from 36 cents the year before.
Strategy Opinion: TTD is targeting HIIQ for a move to $37. A protective stop can be placed near 27. TTD rates HIIQ a good intermediate-term play.
Suitability: Average Bulls.
TTD's special research of Stock's Prior Performance:
Probability - Breakout Success - Extremely Bullish. HIIQ has racked up some sensational gains off its breakouts.
Probability - Earnings Response - Very Bullish. HIIQ has moved higher 6 times after 9 earnings reports where there was a significant change.
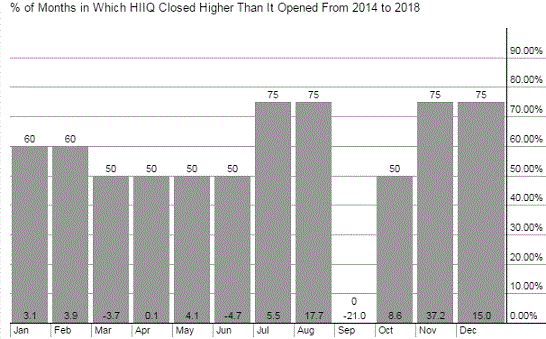
Probability: Seasonal Success - Neutral - HIIQ rose an average of 3.9% in February the past few years, but declined an average of 3.7% in March.
Stock's Prior Performance After A Breakout
|
Stock's % Change from Breakout to peak - prior to cut below 50-day M/A. |
Date of Breakout |
Break point Price |
Stocks Price Peak after Breakout - prior to cut below 50-day M/A |
Date Trade Closed |
|
136% |
5/1/2017 | 17.01 | 36.35 | 8/30/2017 |
|
230% |
12/2/2016 | 6.26 | 20.70 | 1/20/2017 |
|
23% |
5/19/2016 | 6.31 | 7.79 | 6/6/2016 |
| 33% | 11/30/2015 | 5.07 | 6.77 | 12/24/215 |
| 14% | 3/17/2015 | 8.17 | 9.37 | 3/23/2015 |
| 15% | 7/15/2014 | 12.07 | 13.98 | 7/22/2014 |
(In actual trading, entry and exit points could vary depending on broker execution.
Also, ideal are breakouts to a new 52-week high or better, perhaps all-time highs.)
Stock's Long-term Chart
Stock's Performance Chart with Quarterly Earnings Markers vs. S&P 500
Insider Buying in Green - Insider Selling in Red
Stock's Monthly Seasonal Performance Chart - Past 5 Years
Showing % Months UP and % Change
| TTD's Breakout Profile Rating Health Insurance Innovations Inc. (HIIQ) |
| TTD Check List | Bullish | Bearish | Neutral |
| Near 52-week High | YES | ||
| Volume | YES | ||
| Tick Volume | YES | ||
| Price Trend - Daily | YES | ||
| Price Trend - Long Term | YES | ||
| Price Daily Spread | YES | ||
| Base Structure | YES | ||
| Base - A-D | YES | ||
| Earnings-Quarterly | YES | ||
| Earnings-Long Term | YES | ||
| Earnings Outlook | YES | ||
| Industry Group | YES | ||
| Prior Breakout Success | YES | ||
| Fund Sponsorship | YES | ||
| Total Score | 14 | 0 | 0 |
Charts of Selected Breakout Stocks
|
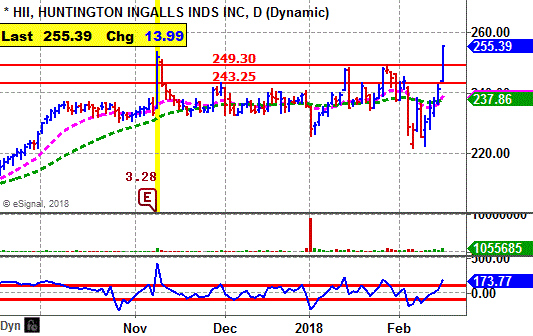
TTD's Quality Rating of Stock - HII - ABOVE AVERAGE |
|
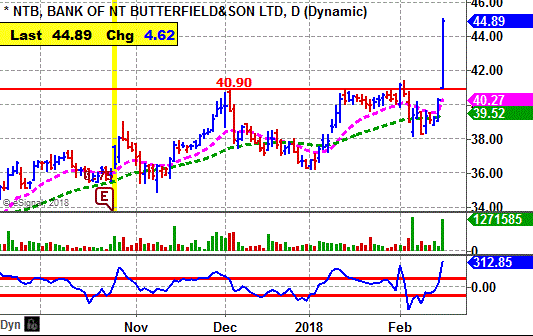
TTD's Quality Rating of Stock - NTB - ABOVE AVERAGE |
|
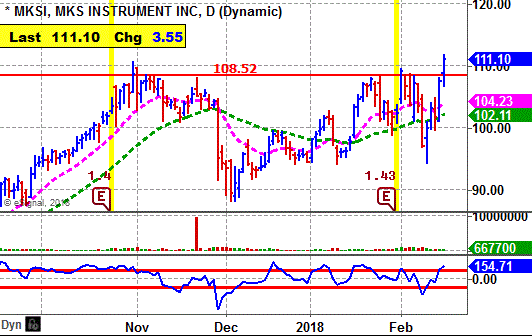
TTD's Quality Rating of Stock - MKSI - ABOVE AVERAGE |
|
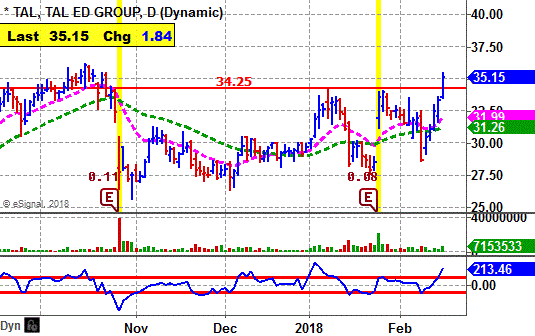
TTD's Quality Rating of Stock - TAL - ABOVE AVERAGE |

Ticker Tape Digest’s Daily List of “Stocks To Sell or Sell Short” ranks stocks well timed to be sold immediately based on daily trading. The list can be used as an alert to reduce current long-term positions.
Shorts from tape action so far today - 4
Stocks Screened - 12,234
Long-Term Environment for bears: Neutral.
Bear Side - Small list of shorts Thursday as stock market rallies strongly. Bears be patient and selective.
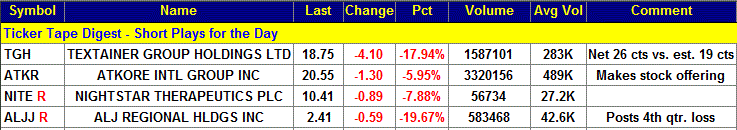
TGH, based in Boca Raton, Fla., purchases and leases intermodal containers. Annual revenues: $498 million. TGH's stock falls sharply Thursday. The decline comes even though TGH reported higher net for the quarter. However, revenues disappointed. 
TTD highlighted TGH as a short at our midsession video show on the Web Thursday.
So far today, TGH is trading a heavy 1.6 million shares, five times its average daily volume of 489,000 shares.
TGH came in with net for the fourth quarter of 26 cents a share. That topped the Street estimate of 19 cents a share. 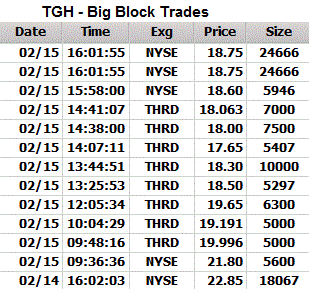
However, revenues were only $129 million. The Street was expecting $133 million.
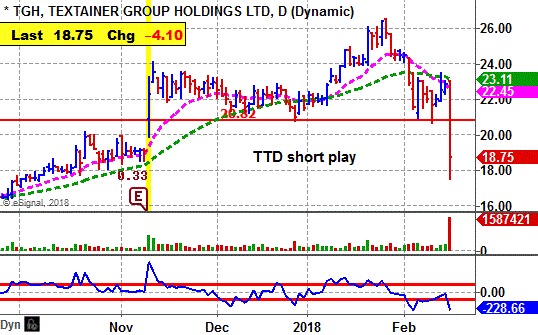
TGH fell sharply in the morning to $18.75. The stock then trended sideways.
However, in the early afternoon, the stock dropped to its session low of $17.50. It lifted in the final two hours to trim some of its loss.
Tape Action
TGH's tape action shows the recent block trades.
One can see the price for the blocks falling from $22.85 in the prior session to as low as $17.65.
A key bearish trade came in the morning when a block of 5,600 shares crossed the tape at $21.80.
That was down from the prior block trade at $22.85 on 18,067 shares late on Wednesday.
Business
TGH owns and leases a fleet of intermodal containers.
The company operates in three segments: Container Ownership, container management and container resale.
TGH is a lessor of intermodal containers based on fleet size. It also sells used containers.
Earnings:
This year, analysts are forecasting a 282% surge in net to $1.30 a share from the 34 cents in 2017.
Net for the first quarter is expected to be 28 cents a share compared with a loss of 16 cents the year before.
Charts:
TGH's daily chart shows the stock cutting below key technical support with heavy volume.
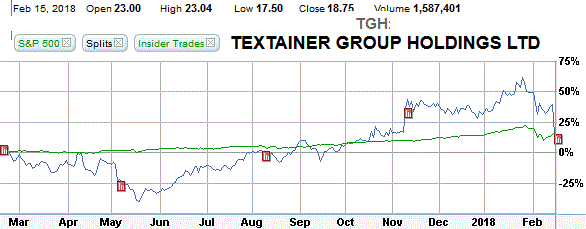
TGH's 12-month performance chart shows the stock appreciating 14% versus a 16% gain for the stock market.
Strategy Opinion: TTD is targeting TGH for a decline to $15 within the next few months, or sooner. A protective stop buy can be placed near $20
Suitability: Aggressive Bears.
TTD's special probability research of Prior Performance:
Probability - Earnings Response - Extremely Bearish. TGH rose just 3 times after the past 9 earnings reports when there was a significant change.
Probability: Seasonal Activity - Bullish. TGH rose an average of 0.6% in February and 4.6% in March the past few years.
|
TTD's Quality Rating of Stock - TGH - AVERAGE |
Stock Performance Chart with Quarterly Earnings Markers vs. S&P 500
Insider Buying in Green - Insider Selling in Red
TTD columnist Leo Fasciocco has covered the stock market for over 30 years. His articles appear in many publications. He has also been a speaker at the Intershow conferences. He has been on television and radio. He is author of many educational articles about stock investing and the book “Guide To High-Performance Investing.”

For information to subscribe to the Ticker Tape Digest Services call: Beverly Owen at 1-480-926-1680.
Distributed by Corona Publishing Enterprises. TickerTape Digest Inc. 1220 W. Sherri, Gilbert, Az. 85233.
TTD “Professional Report” is available on the Web: $100 per month. Password needed. Published daily - around 20 times a month.
TTD Pro Report includes a Morning chart slide show of breakout stocks, a Midsession video-audio show with commentary on breakout stocks and shorts and a Final end of day overall report on breakout stocks for the session, short plays and accumulation plays. There are other features too such as Quick Trades and Long-term Plays.
TTD Daily Report is $39. It covers a Morning slide show of charts of stocks breaking out and a TTD end of day print report covering breakout stocks and shorts.
Credit cards accepted. Payable to Corona Publishing Enterprises.
(The information contained has been prepared from data deemed reliable but there is no guarantee of complete accuracy. Ticker Tape Digest Inc. is not affiliated with any broker, dealer or investment advisor. Nothing in this publication constitutes an offer, recommendation or solicitation to buy or sell any securities. Further research is advised. This report is copyrighted and no redistribution is permitted with out permission.)