Daily - Go to TTD's Chart scroller of Breakout and Leading Stocks - Thursday, February 18, 2016
|
Daily - Go to TTD's Chart scroller of Breakout and Leading Stocks - Thursday, February 18, 2016 |
|
Weekly - Bullish Conservative Investors - Go To TTD Long-Term Plays - Tuesday, February 16, 2016 |
|
Go to Video Show - "How to Make Money With Breakout Stocks" |
|---|

By Leo Fasciocco -- TTD
Ticker Tape Digest presents its daily stock market report containing stocks to go long as breakout trades, quick trades, or bargain trades. We also feature stocks under Significant Accumulation that are poised to breakout.
|
Ticker Tape Digest's Daily schedule guide for TTD subscribers 1. Pre-market - check Breakout Watch List and Quick Trades. 2. Morning - (11:30 - 12 A.M.) - check breakout stocks tape and breakout chart slide show. 3. Midday (1 P.M.) check TTD Midsession Report and see market video show. 4. After close (4 P.M.) check final TTD Report for day. Trading Strategies Bullish Aggressive Investors Bullish - "Breakout Stocks" - ideally suited for bull markets and special situation stocks. Potential for large returns. (See Performance) Aggressive Investor Bullish- "Quick Trade Stocks" -ideally suited for entry into top performing issues looking for a small quick profit." (See Performance) Conservative Investors "Bargain Buy Trades for the Long Term." Ideally suited for entry into top performing big cap stocks on pullbacks within overall up trend.(See Performance) Bearish Aggressive Bearish Investors - "Breakdown Stocks" to Sell Short. Ideally suited for bear markets or market pull backs. Potential for large returns (See Performance) |
|---|
The TTD report also contains stocks to short as breakdown plays and as bargain (swing trade) shorts.
Investors should tend to try to go with a strategy that fits with the stock market's trend, unless there is a special situation play.
TTD's Breakout Stocks - Long are
most suitable for aggressive investors seeking ideal entry points into leading stocks, especially during bull markets. They can do extremely well in bull markets with gains of as much as several hundred percent. 
These stocks can also do extremely well during strong market rallies, or if they are in a industry group that is performing very well. They tend to have strong earnings outlooks and are near new-52 week, or all-time highs.
TTD Quick Trade Stocks - Long These are leading issues that have pulled back in recent days, but could move higher soon. They are most suitable for Aggressive Investors willing to trade short term. These stocks will do extremely well during market advances. They have about 74% win rate. During market rally sequences the win rate is even higher. The return is small 3% to 8% in just a few days.
TTD's Bargain Buy Trades - Long - Long Term. These are for conservative bullish Investors These long-term buys are ideally suited for entry into stocks on pull backs within overall up trend. These stocks can give a good return long-term especially during a bull market.
TTD also presents Stocks To Sell or Sell Short. These issues are suitable for aggressive investors willing to take short positions both as trades or for longer-term plays. These stocks will do very well during bear markets or market pull backs.
TTD's Bearish breakdown stocks to sell short. These issues have potential to fall sharply. They often show a technical breakdown and also some fundamental business problem such as weak earnings.
TTD's multi-media updates include a slide-show that presents charts and analysis at midsession. Some times TTD presents feature analysis on stocks and the market. TTD uses Windows Media Files. (WMV).
TTD also presents a "Breakout Watch List" that is up dated daily. This list consists of key stocks in position to breakout. A close watch of this list can put you in the stock just as it breaks out. A good idea is to study the list and be ready to move into a stock quickly as it hits its breakpoint.
TTD often suggests using stop buy orders to enter. It is very important to buy a breakout stock as close as possible to the breakpoint. The idea is to get "elbow room" if the stock should follow through to the upside. This is very important in being successful in making big money with breakout stocks.
It is also essential to have a stop loss strategy for all stocks in which positions are taken. Not every stock will work as expected. It is important for investors to "police" their portfolios and avoid getting trapped in any bad positions.
Quality rating of breakout Two key factors: 1 - Stock near all-time high in price or near a 52-week high. 2 - earnings growth current year is strong. The ideal play is a stock with an Above Average Quality Rating. The stock is near a new high and will have strong earnings. TTD's other ratings are Average and Below Average.
TTD also has special feature sections on Educational Tips on Investing.
To email Mr. Leo Fasciocco leo@tickertapedigest.com.For service, email Beverly Owen owen@tickertapedigest.com. TTD’s Tel: 1-480-926-1680.
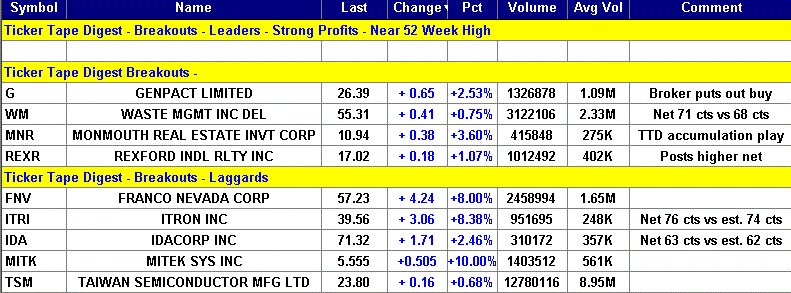
Breakout Stocks
Total Buy Breakouts so far today - 9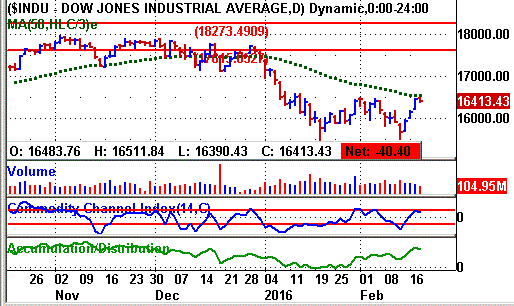
Overall Quality of Breakouts - BELOW AVERAGE
Stocks Screened - 8,300
Bull side - Breakout list large but extremely selective. Bulls be conservative. Stock market remains vulnerable to the downside.
(Put mouse on Dow chart to see Nasdaq chart)
Long Term Environment for bulls: Bearish
Stock Market Momentum
Market (Daily) - NYSE Bullish, Nasdaq Bullish
Market (Weekly) - NYSE Bullish, Nasdaq Bullish
Market (Monthly) - NYSE Bearish, Nasdaq Bearish
Ticker Tape Digest's
|
TTD's Quality Rating of Stock - G - AVERAGE |
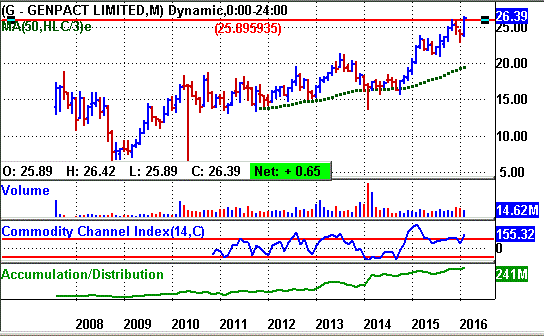
G, based in Bermuda, provides business process outsourcing and information technology services worldwide. Annual revenues:$2.5 billion. G breaks out from a 15-week, cup-and-handle base Thursday. The move carries the stock to a new all-time high. 
TTD highlighted G as a breakout at our midsession video show on the Web Thursday.
The push to a new high is impressive and was aided by a brokerage firm putting out bullish comments.
So far today, G is trading 1.3 million shares. Its average daily volume is 1.1 million shares. 
G's stock drove higher in the morning to clear its base. (see 10-minute chart)
The stock reached an intraday high of 26.42. It did push a bit higher in after-hours trading.
G's tape action shows the recent block trades.
One can see the price for the blocks climbing from $25.15 in the prior session to as high as $26.41.
A key bullish trade came in the morning when a block of 24,530 shares crossed the tape at $26.
That was up sharply from the prior block at $25.65 on 34,500 shares. 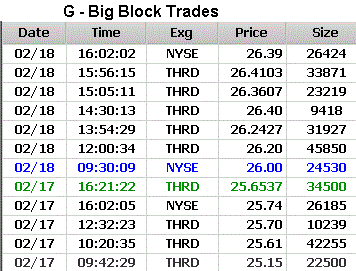
The company offers finance and accounting services.
They include accounts payable services comprising document management, invoice processing, approval, and resolution management solutions.
It also offers credit and contract management, fulfillment, billing, collections, and dispute management services.
G also provides analytics and research services; business consulting and enterprise risk consulting services.
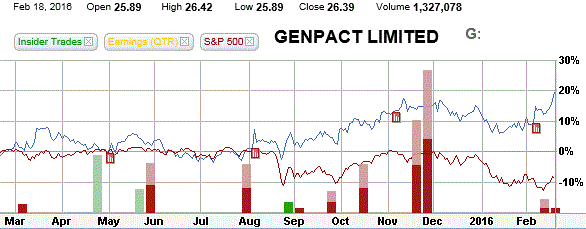
G's 12-month performance chart shows the stock appreciating 19% versus a decline of 8% for the stock market.
There was some heavy insider selling late last year (see red bars on chart.
G's long-term chart shows the stock coming public in 2007 and trading at $14. That was the top in the prior bull market. The stock took a dive down to $6.30 in 2008 due to the bear market.
Since then G has been working higher having made a fourfold move.
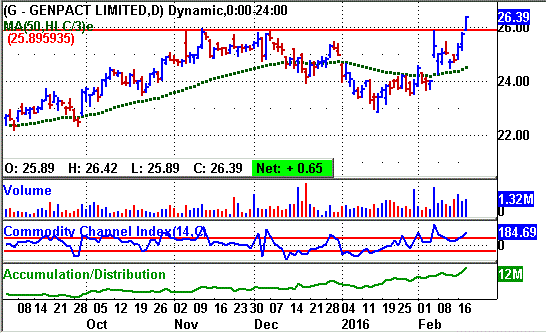
G's daily chart shows the breakout coming with a pick up in volume.
The base was well formed as a cup-and-handle pattern.
The stock's CCI momentum indicator is trending higher showing good buying.
The accumulation - distribution line (bottom of chart) is trending higher complimenting the price advance.
This year, analysts are forecasting a 12% increase in net to $1.31 a share from $1.17 a year ago.
The stock sells with a price-earnings ratio of 19.
Going out to 2017, the Street looks for a 12% rise in net to $1.47 a share from the anticipated $1.31 this year.
Net for the upcoming first quarter should be a robust 30% gain to 29 cents a share from 22 cents a year before.
The highest estimate on the Street is at 30 cents a share. 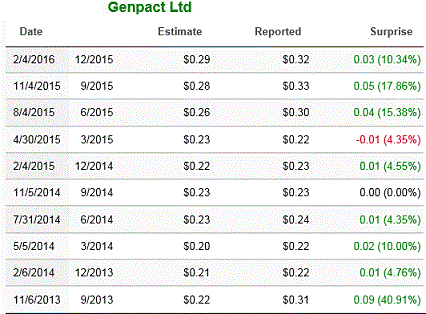
TTD sees good chances for an upside earnings surprise.
The company topped the consensus eight out of the past 10 quarters.
Net for the second quarter is expected to rise 10% to 33 cents a share from 30 cents a year ago.
Strategy Opinion: TTD is targeting G for a move to 32 off this breakout.
A protective stop can be placed near 24.20.
TTD rates G an average intermediate-term play.
Sponsorship: Good. The largest fund holder is 4-star rated Hartford Midcap A Fund with a 2.9% stake. It was a recent buyer of 216,688 shares.
Also the 2-star rated Columbia Acorn Z Fund was a recent purchaser of 526,000 shares. It has a 1% stake.
G has 211 million shares outstanding. Institutions hold 63% of the stock and insides 32%.
Insider Activity: Neutral. Insiders have been light sellers around $24. They were buyers using stock options $5.74 a share.
Currently, 13 analysts follow the stock, 7 have a buy, up from 6 three months ago.
G has a book value of $6.17 a share.
Stock Performance Chart with Quarterly Earnings Markers.
| TTD's Breakout Profile
Rating Genpact Ltd. - (G) |
| TTD Check List | Bullish | Bearish | Neutral |
| Near 52-week High | YES | ||
| Volume | YES | ||
| Tick Volume | YES | ||
| Price Trend - Daily | YES | ||
| Price Trend - Long Term | YES | ||
| Price Daily Spread | YES | ||
| Base Structure | YES | ||
| Base - A-D | YES | ||
| Earnings-Quarterly | YES | ||
| Earnings-Long Term | YES | ||
| Earnings Outlook | YES | ||
| Industry Group | YES | ||
| Prior Breakout Success | YES | ||
| Fund Sponsorship | YES | ||
| Total Score | 14 | 0 | 0 |
Charts of Selected Breakout Stocks
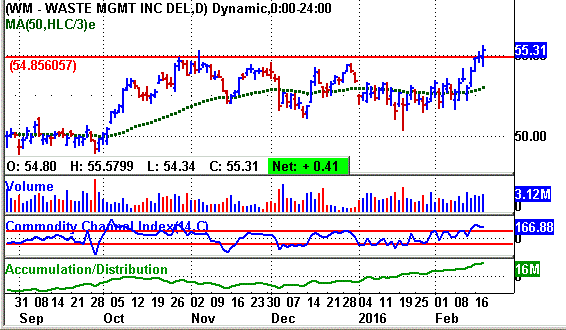
| TTD's Quality Rating of Stock - WM - AVERAGE |
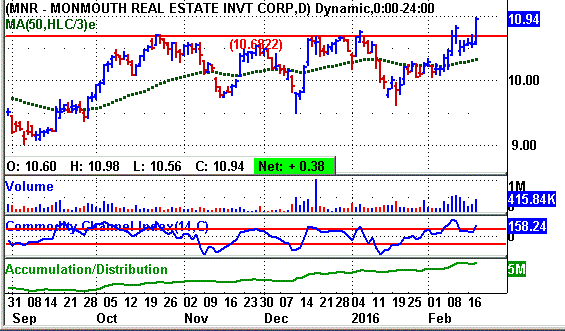
| TTD's Quality Rating of Stock - MNR - AVERAGE |
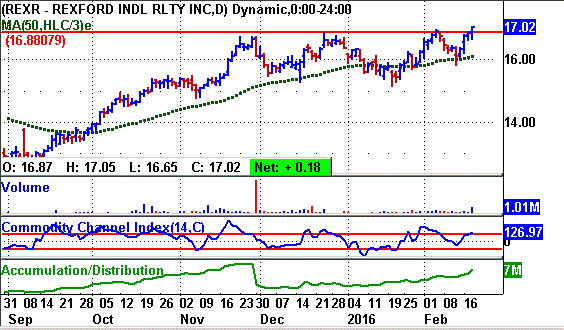
| TTD's Quality Rating of Stock - REXR - AVERAGE |
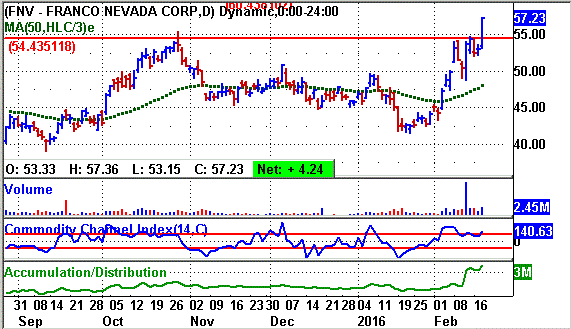
| TTD's Quality Rating of Stock - FNV - BELOW AVERAGE |

Ticker Tape Digest’s Daily List of “Stocks To Sell or Sell Short” ranks stocks well timed to be sold immediately based on daily trading. The list can be used as an alert to reduce current long-term positions.
Shorts from tape action so far today - 3
Stocks Screened - 8,300
Long-Term Environment for bears: Favorable.
Bear Side - Small list of shorts Thursday. The list includes issues damaged by disappointing earnings. Bears be alert as stock market is still vulnerable to the downside.
TTD's short from Wednesday was Maxwell Technologies Inc. at 5.20. Thursday, the stock has declined to 5.08 and is working well for bears.
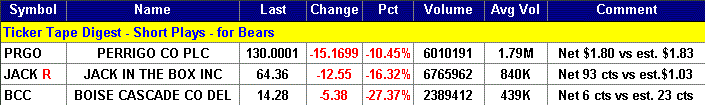
BCC, based in Boise, Idaho, makes wood products and distributes building materials in the U.S. and Canada. Annual revenues: $3.6 billion.
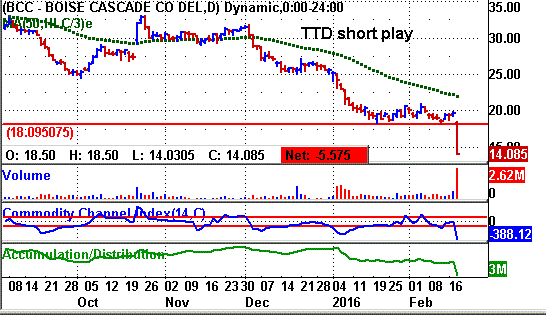
BCC's stock falls sharply Thursday after the company reported disappointing earnings for the fourth quarter. 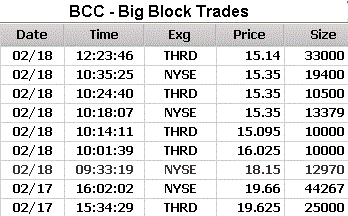
TTD highlighted BCC as a short at our midsession video show on the Web Thursday.
BCC came in with fourth quarter net of 6 cents a share. That was well below the Street estimate of 23 cents a share.
That compares with 40 cents a year before.
The stock fell sharply in the morning touching 15. It then trended sideways and in the afternoon moved even lower touching an intraday low of 13.80.
BCC's tape action shows the recent block trades.
One can see the price for the blocks falling from $19.62 in the prior session to as low as $15.14 Thursday.
A key bearish trade came in the morning when a block of 12,970 shares crossed the tape at $18.15.
That was down sharply from the prior block at $19.66 on 44,267 shares.
BCC produces plywood panels; and engineered wood products such as laminated veneer lumber, I-joists, and laminated beams for use in headers and beams.
The company also produces studs, particleboard, and ponderosa pine lumber.
BCC's daily chart shows the stock gapping lower on big volume. The stock's accumulation - distribution line has fallen sharply confirming the heavy selling pressure.
Strategy Opinion: TTD is targeting BCC for a decline to 11 within the next few months, or sooner. A protective stop can be placed near 15.10.
| TTD's Quality Rating of Stock - BCC - BELOW AVERAGE |
TTD columnist Leo Fasciocco has covered the stock market for over 20 years. His articles appear in many publications. He is also a speaker at the Intershow conferences. He has been on television and radio. He is author of many educational articles about stock investing and the book “Guide To High-Performance Investing.”

For information to subscribe to the Ticker Tape Digest Services call: Beverly Owen at 1-480-926-1680. Distributed by Corona Publishing Enterprises. Ticker Tape Digest Inc. P.O. Box 2044 Chandler, Az. 85244-2044. TTD “Professional Report” is available on the World Wide Web: $100 per month. Password needed. “TTD Professional“ Faxed is $200 per month. The TTD
Daily Report is $39.95. Credit cards accepted.
(The information contained has been prepared from data deemed reliable but there is no guarantee of complete accuracy. Ticker Tape Digest Inc. is not affiliated with any broker, dealer or investment advisor. Nothing in this publication constitutes an offer, recommendation or solicitation to buy or sell any securities. Further research is advised. This report is copyrighted and no redistribution is permitted with out permission.)