Daily - Go to TTD's Tape of Stock Charts - Wednesday, February 20
|
Daily - Go to TTD's Tape of Stock Charts - Wednesday, February 20 |
|
Weekly - Bullish Conservative Investors - Go To TTD Long-Term Plays - Tuesday, February 19 |
|
Go to Video Show - "How to Make Money With Breakout Stocks" |
|---|

By Leo Fasciocco -- TTD
Ticker Tape Digest presents its daily stock market report containing stocks to go long as breakout trades, quick trades, or bargain trades. We also feature stocks under Significant Accumulation that are poised to breakout.
|
Ticker Tape Digest's Daily schedule guide for TTD subscribers 1. Pre-market - check Breakout Watch List and Quick Trades. 2. Morning - (11:30 - 12 A.M.) - check breakout stocks tape and breakout chart slide show. 3. Midday (1 P.M.) check TTD Midsession Report and see market video show. 4. After close (4 P.M.) check final TTD Report for day. Trading Strategies Bullish Aggressive Investors Bullish - "Breakout Stocks" - ideally suited for bull markets and special situation stocks. Potential for large returns. (See Performance) Aggressive Investor Bullish- "Quick Trade Stocks" -ideally suited for entry into top performing issues looking for a small quick profit." (See Performance) Conservative Investors "Bargain Buy Trades for the Long Term." Ideally suited for entry into top performing big cap stocks on pullbacks within overall up trend.(See Performance) Bearish Aggressive Bearish Investors - "Breakdown Stocks" to Sell Short. Ideally suited for bear markets or market pull backs. Potential for large returns (See Performance) |
|---|
The TTD report also contains stocks to short as breakdown plays and as bargain (swing trade) shorts.
Investors should tend to try to go with a strategy that fits with the stock market's trend, unless there is a special situation play.
TTD's Breakout Stocks - Long are
most suitable for aggressive investors seeking ideal entry points into leading stocks, especially during bull markets. They can do extremely well in bull markets with gains of as much as several hundred percent. 
These stocks can also do extremely well during strong market rallies, or if they are in a industry group that is performing very well. They tend to have strong earnings outlooks and are near new-52 week, or all-time highs.
TTD Quick Trade Stocks - Long These are leading issues that have pulled back in recent days, but could move higher soon. They are most suitable for Aggressive Investors willing to trade short term. These stocks will do extremely well during market advances. They have about 74% win rate. During market rally sequences the win rate is even higher. The return is small 3% to 8% in just a few days.
TTD's Bargain Buy Trades - Long - Long Term. These are for conservative bullish Investors These long-term buys are ideally suited for entry into stocks on pull backs within overall up trend. These stocks can give a good return long-term especially during a bull market.
TTD also presents Stocks To Sell or Sell Short. These issues are suitable for aggressive investors willing to take short positions both as trades or for longer-term plays. These stocks will do very well during bear markets or market pull backs.
TTD's Bearish breakdown stocks to sell short. These issues have potential to fall sharply. They often show a technical breakdown and also some fundamental business problem such as weak earnings.
TTD's multi-media updates include a slide-show that presents charts and analysis at midsession. Some times TTD presents feature analysis on stocks and the market. TTD uses Windows Media Files. (WMV).
TTD also presents a "Breakout Watch List" that is up dated daily. This list consists of key stocks in position to breakout. A close watch of this list can put you in the stock just as it breaks out. A good idea is to study the list and be ready to move into a stock quickly as it hits its breakpoint.
TTD often suggests using stop buy orders to enter. It is very important to buy a breakout stock as close as possible to the breakpoint. The idea is to get "elbow room" if the stock should follow through to the upside. This is very important in being successful in making big money with breakout stocks.
It is also essential to have a stop loss strategy for all stocks in which positions are taken. Not every stock will work as expected. It is important for investors to "police" their portfolios and avoid getting trapped in any bad positions.
Quality rating of breakout Two key factors: 1 - Stock near all-time in price or near a 52-week high. 2 - earnings growth current year is strong. The ideal play is a stock with an Above Average Quality Rating. The stock is near a new high and will have strong earnings. TTD's other ratings are Average and Below Average.
TTD also has special feature sections on Educational Tips on Investing.
To email Mr. Leo Fasciocco leo@tickertapedigest.com.For service, email Beverly Owen owen@tickertapedigest.com. TTD’s Tel: 1-480-926-1680.
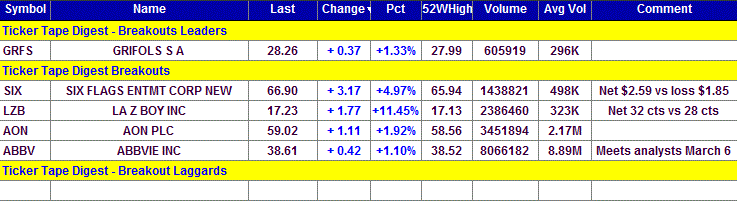
Breakout Stocks
Total Buy Breakouts so far today - 5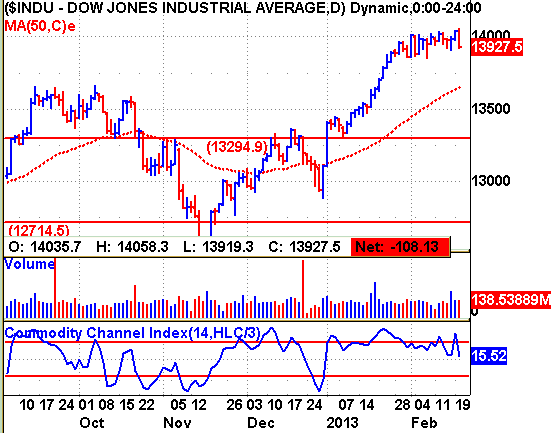
Overall Quality of Breakouts - Average
Stocks Screened - 8,300
Bull side - Breakout list small as stock market fades in the afternoon. Bulls be selective as stock market is starting to weak in a consolidation phase.
(Put mouse on Dow chart to see Nasdaq chart)
Long Term Environment for bulls: Favorable
Market (Daily) - NYSE Bearish, Nasdaq Bearish
Market (Weekly) - NYSE Bullish, Nasdaq Bullish
Market (Monthly) - NYSE Bullish, Nasdaq Bullish
Ticker Tape Digest's
(See Top Performing Breakout Stocks for 2011- 2012)
|
TTD's Quality Rating of Stock - GRFS - ABOVE AVERAGE |
GRFS, based in Barcelona, Spain, makes plasma related products. Annual revenues: $2.5 billion. GRFS breaks out today from an eight-week, cup-and-handle base. The move carries the stock to a new all-time high. GRFS came public back in 2011. So far today, GRFS is trading 605,919 shares, double its normal daily volume of 296,000 shares. 
TTD highlighted GRFS as a breakout at our midsession video show on the Web Wednesday.
The stock market decline in the afternoon impacted many stocks but GRFS held its own. 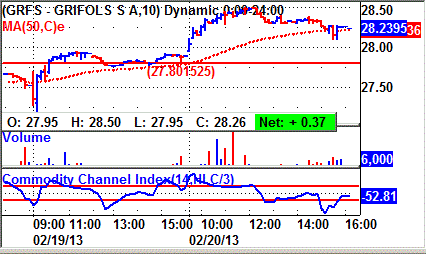
The stock rose steadily in the morning and peaked at 28.50 near noon. The stock's breakpoint was 27.80 (see 10-minute chart). The stock slipped back a bit but then trended sideways into the close.
GRFS's tape action shows the recent big block trades.
One can see the price for the blocks climbing from $27.53 to a peak of $28.41.
A key bullish trade came in the morning when a block of 45,000 shares crossed the tape at $28.30. That was up from the prior block at $27.81.
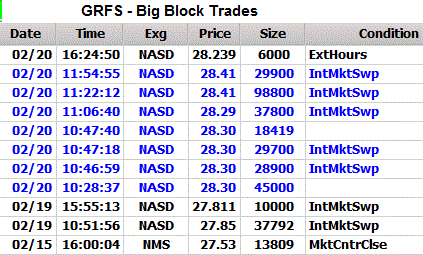 The tape action showed good institutional buying.
GRFS develops plasma derivates, products for intravenous therapy, clinical nutrition and diagnostic and hospital logistics systems.
The company operates its business through three divisions: Bioscience Division, Diagnostic Division and Hospital Division.
The bioscience division is engaged in the research, development, production and commercialization of plasma derivates.
The diagnostic division develops products for laboratory analysis, including products for Hospital Blood Banks and Transfusion Centers.
The hospital division provides non-biological products used in hospital pharmacies, surgery, nutritional support, fluid therapy and for other therapeutic uses.
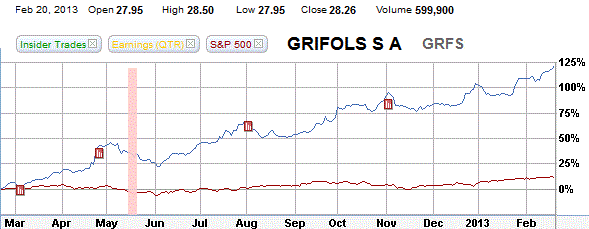
GRFS's 12-month performance chart shows the stock appreciating 123% versus a 15% gain for the S&P 500 index. GRFS is an outstanding performer in the medical sector.
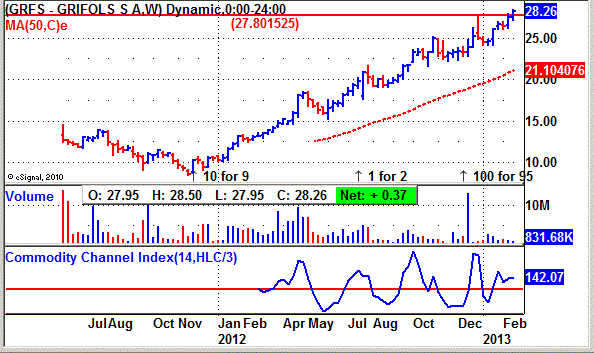
GRFS's long-term chart shows the stock coming public and trading around 13 in July of 2011. The stock dipped a bit but then has since come on strongly about doubling from its initial price. 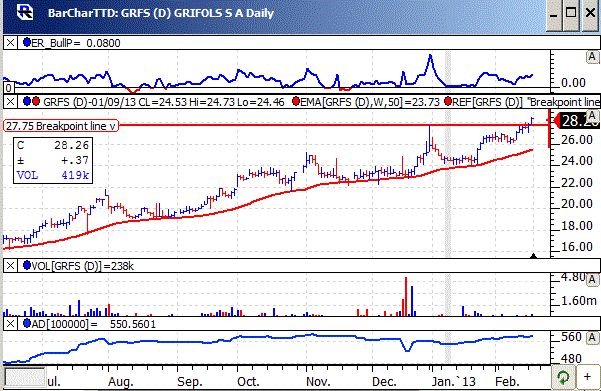
GRFS's daily chart shows the stock trending higher from 16 in July to a peak near 28 in January.
The stock then pulled back and formed a cup-an-handle base.
The breakout is ideal.
The stock's TTD momentum indicator (top of chart) has been bullish for most of the past six months. That is impressive.
The accumulation - distribution line (bottom of chart) is bullish. The stock is trending higher nicely above its rising 50-day moving average line.
For 2012, analysts expect GRFS to come in with a 63% jump in net to $1.18 a share from 72 cents a year ago.
The stock sells with a price-earnings ratio of 24 based on 2012 net.
Looking ahead to 2013, the Street is forecasting at 26% increase in net to $1.49 a share from the anticipated $1.18 for 2012.
Strategy Opinion: GRFS is a winner until proven otherwise. TTD is targeting the stock for a move to 34 off this breakout. A protective stop can be placed near 26.
TTD rates GRFS a very good intermediate-term play provided earnings remain on course.
Sponsorship: Good. The largest fund holder is Fidelity Diversified International Fund with a 0.84% stake. The 3-star fund has held its position steady. 5-star rated T. Rowe Price Health Sciences Fund has a small position. The largest buyer recently was the 2-star rated Putnam International Equity Fund which bought 63,525 shares.
Insider Activity: Not available. Currently 2 analysts follow the stock, and both have a buy, the same as three months ago.
Stock Performance Chart with Quarterly Earnings Markers.
| TTD's Breakout Profile
Rating Grifols SA - (GRFS) |
| TTD Check List | Bullish | Bearish | Neutral |
| Near 52-week High | YES | ||
| Volume | YES | ||
| Tick Volume | YES | ||
| Price Trend - Daily | YES | ||
| Price Trend - Long Term | YES | ||
| Price Daily Spread | YES | ||
| Base Structure | YES | ||
| Base - A-D | YES | ||
| Earnings-Quarterly | YES | ||
| Earnings-Long Term | YES | ||
| Earnings Outlook | YES | ||
| Industry Group | YES | ||
| Prior Breakout Success | YES | ||
| Fund Sponsorship | YES | ||
| Total Score | 14 | 0 | 0 |
Charts of Selected Breakout Stocks
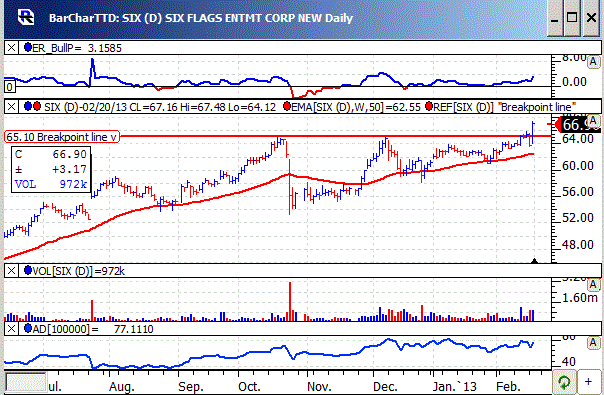
| TTD's Quality Rating of Stock - SIX - AVERAGE |
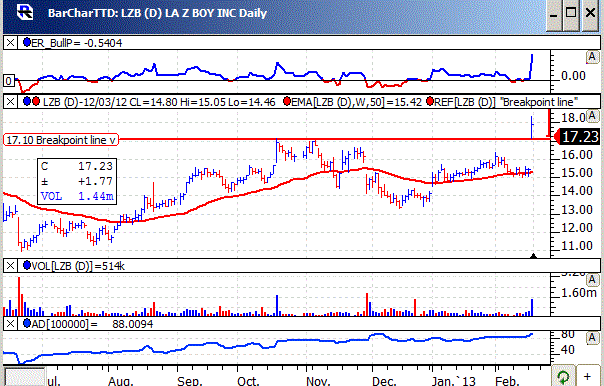
| TTD's Quality Rating of Stock - LZB - AVERAGE |
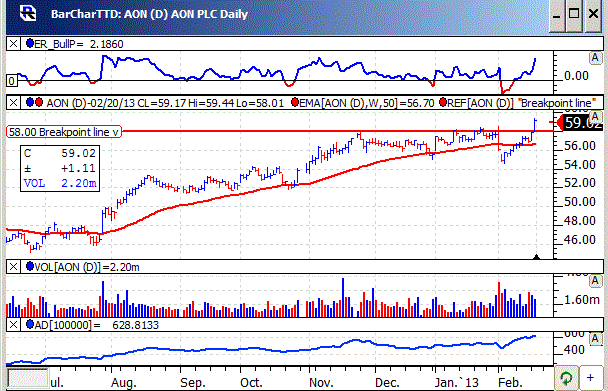
| TTD's Quality Rating of Stock - AON - AVERAGE |
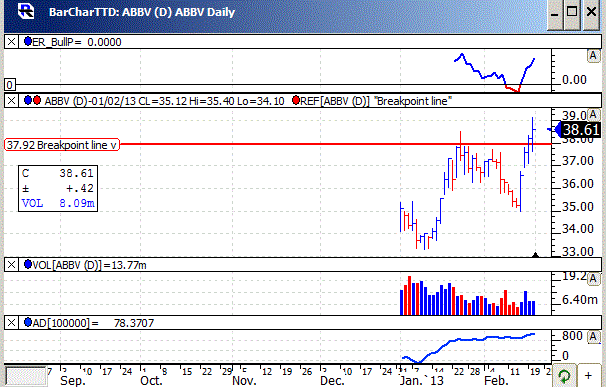
| TTD's Quality Rating of Stock - ABBV - AVERAGE |

Ticker Tape Digest’s Daily List of “Stocks To Sell or Sell Short” ranks stocks well timed to be sold immediately based on daily trading. The list can be used as an alert to reduce current long-term positions.
Shorts from tape action so far today - 6
Stocks Screened - 8,300
Long-Term Environment for bears: Unfavorable.
Bear Side - Small number of breakout stocks today. Stock market remains in up trend. Bears remain cautious.

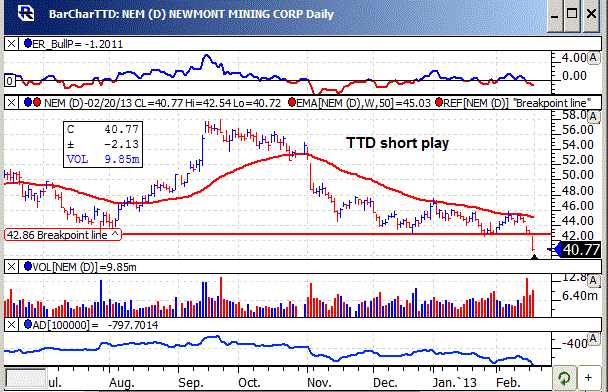
NEM, based in Greenwood Village, Co., explores and produces gold. Annual revenues: $10.2 million. NEM's stock falls sharply today undercutting key technical support. Gold stocks have been working lower and are a weak group. NEM's volume is running at 11.4 million shares, almost double its average daily volume of 6.7 million shares.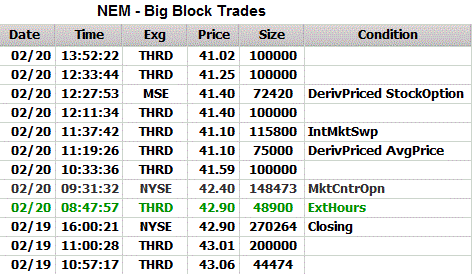
TTD highlighted NEM as a short at our midsession video show on the Web.
The stock worked lower in the morning and then trended sideways going into midday. In the afternoon, NEM resumed its down trend.
The stock's tape action shows the recent big block trades.
One can see the price for the blocks falling from $43.06 to $41.02.
A key bearish trade came in the morning when a block of 148,473 shares crossed the tape at $42.40. That was down from the prior block at $42.90.
The company produces gold from mines in Nevada and California, and, outside of the United States, from operations in Peru, Indonesia, Mexico and Uzbekistan.
Net for the fourth quarter should decline 18% to 99 cents a share from $1.20 a year ago. Then in the first quarter analysts look for a 7% drop in net to $1.07 a share from $1.15 the year before.
NEM's daily chart shows the stock declining from 57 in September to 43. The stock tried to form a bottom. However, to day it breaks down with expanding volume.
Strategy Opinion: TTD is targeting NEM for a decline to 34 within the next few months. A protective stop buy can be placed near 42.40.
| TTD's Quality Rating of Stock - NEM - AVERAGE |
TTD columnist Leo Fasciocco has covered the stock market for over 20 years. His articles appear in many publications. He is also a speaker at the Intershow conferences. He has been on television and radio. He is author of many educational articles about stock investing and the book “Guide To High-Performance Investing.”

For information to subscribe to the Ticker Tape Digest Services call: B. J. Owen at 1-480-926-1680. Distributed by Corona Publishing Enterprises. Ticker Tape Digest Inc. P.O. Box 2044 Chandler, Az. 85244-2044. TTD “Professional Report” is available on the World Wide Web: $100 per month. Password needed. “TTD Professional“ Faxed is $200 per month. The TTD Daily Report is $39.95. Credit cards accepted.
(The information contained has been prepared from data deemed reliable but there is no guarantee of complete accuracy. Ticker Tape Digest Inc. is not affiliated with any broker, dealer or investment advisor. Nothing in this publication constitutes an offer, recommendation or solicitation to buy or sell any securities. Further research is advised. This report is copyrighted and no redistribution is permitted with out permission.)