Daily - Go to TTD's Chart scroller of Breakout Stocks - Wednesday, February 22, 2017
|
Daily - Go to TTD's Chart scroller of Breakout Stocks - Wednesday, February 22, 2017 |
|
Weekly - Bullish Conservative Investors - Go To TTD Long-Term Plays - Monday, February 21, 2017 |
|
|
Go to Video Show - "How to Make Money With Breakout Stocks |
|---|

By Leo Fasciocco -- TTD
Ticker Tape Digest presents its daily stock market report containing stocks to go long as breakout trades, quick trades, or bargain trades. We also feature stocks under Significant Accumulation that are poised to breakout.
|
Ticker Tape Digest's Daily schedule guide for TTD subscribers 1. Pre-market - check Breakout Watch List and Quick Trades. 2. Morning - (11:30 - 12 A.M.) - check breakout stocks tape and breakout chart slide show. 3. Midday (1 P.M.) check TTD Midsession Report and see market video show. 4. After close (4 P.M.) check final TTD Report for day. Trading Strategies Bullish Aggressive Investors Bullish - "Breakout Stocks" - ideally suited for bull markets and special situation stocks. Potential for large returns. (See Performance) Aggressive Investor Bullish- "Quick Trade Stocks" -ideally suited for entry into top performing issues looking for a small quick profit." (See Performance) Conservative Investors "Bargain Buy Trades for the Long Term." Ideally suited for entry into top performing big cap stocks on pullbacks within overall up trend.(See Performance) Bearish Aggressive Bearish Investors - "Breakdown Stocks" to Sell Short. Ideally suited for bear markets or market pull backs. Potential for large returns (See Performance) |
|---|
The TTD report also contains stocks to short as breakdown plays and as bargain (swing trade) shorts.
Investors should tend to try to go with a strategy that fits with the stock market's trend, unless there is a special situation play.
TTD's Breakout Stocks - Long are
most suitable for aggressive investors seeking ideal entry points into leading stocks, especially during bull markets. They can do extremely well in bull markets with gains of as much as several hundred percent. 
These stocks can also do extremely well during strong market rallies, or if they are in a industry group that is performing very well. They tend to have strong earnings outlooks and are near new-52 week, or all-time highs.
TTD Quick Trade Stocks - Long These are leading issues that have pulled back in recent days, but could move higher soon. They are most suitable for Aggressive Investors willing to trade short term. These stocks will do extremely well during market advances. They have about 74% win rate. During market rally sequences the win rate is even higher. The return is small 3% to 8% in just a few days.
TTD's Bargain Buy Trades - Long - Long Term. These are for conservative bullish Investors These long-term buys are ideally suited for entry into stocks on pull backs within overall up trend. These stocks can give a good return long-term especially during a bull market.
TTD also presents Stocks To Sell or Sell Short. These issues are suitable for aggressive investors willing to take short positions both as trades or for longer-term plays. These stocks will do very well during bear markets or market pull backs.
TTD's Bearish breakdown stocks to sell short. These issues have potential to fall sharply. They often show a technical breakdown and also some fundamental business problem such as weak earnings.
TTD's multi-media updates include a slide-show that presents charts and analysis at midsession. Some times TTD presents feature analysis on stocks and the market. TTD uses Windows Media Files. (WMV).
TTD also presents a "Breakout Watch List" that is up dated daily. This list consists of key stocks in position to breakout. A close watch of this list can put you in the stock just as it breaks out. A good idea is to study the list and be ready to move into a stock quickly as it hits its breakpoint.
TTD often suggests using stop buy orders to enter. It is very important to buy a breakout stock as close as possible to the breakpoint. The idea is to get "elbow room" if the stock should follow through to the upside. This is very important in being successful in making big money with breakout stocks.
It is also essential to have a stop loss strategy for all stocks in which positions are taken. Not every stock will work as expected. It is important for investors to "police" their portfolios and avoid getting trapped in any bad positions.
Quality rating of breakout Two key factors: 1 - Stock near all-time high in price or near a 52-week high. 2 - earnings growth current year is strong. The ideal play is a stock with an Above Average Quality Rating. The stock is near a new high and will have strong earnings. TTD's other ratings are Average and Below Average.
TTD also has special feature sections on Educational Tips on Investing.
To email Mr. Leo Fasciocco leo@tickertapedigest.com. For service, email Beverly Owen owen@tickertapedigest.com. TTD’s Tel: 1-480-926-1680.
Breakout Stocks
Total Buy Breakouts so far today - 14
Quality of Breakouts - ABOVE AVERAGE
Stocks Screened - 8,300
Bull side - Breakout list large with some good looking plays. Bulls can be venturesome. Stock market holds in up trend.
(Put mouse on chart to Nasdaq)
Environment for bulls: Bullish.
Stock Market Momentum
Market (Daily) - NYSE Bullish, Nasdaq Bullish
Market (Weekly) - NYSE Bullish, Nasdaq Bullish
Market (Monthly) - NYSE Bullish, Nasdaq Bullish
Ticker Tape Digest's
|
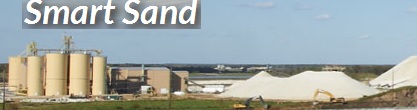
TTD's Quality Rating of Stock - SND - ABOVE AVERAGE |
SND, based in The Woodlands, Tex., produces white rawfrac sand used in the oil industry. Annual revenues: $45 million. SND, a small cap stock, breaks out Wednesday from a seven-week, cup-and-handle base. The move carries the recent IPO to a new all-time high.
So far today, SND is trading 758,383 shares.
Its average daily volume is 824,000 shares.
TTD highlighted SND as a breakout at our midsession video show on the Web Wednesday.
Earlier this month, SND completed a stock offering at $17.50 for 6 million shares. The offering consisted of 1.5 million shares for the company and 4.5 million from selling shareholders. 
SND's stock drive higher in the morning clearing its breakpoint line. (see 10-minute chart)
The stock reached an intraday peak of $21.33 in the morning.
It then backed off slightly and trended sideways the rest of the day.
Tape Action
SND's tape action shows the recent block trades.
 One can see the price for the blocks climbing from $19.15 in the prior session to as high as $21.22 during Wednesday's session.
A key bullish trade, though, took place on Tuesday when a block of 75,000 shares crossed the tape at $19.21.
That was up from the prior block trade at $19.15 on 8,390 shares.
Business
SND produces Northern White raw frac sand.
The company sells its products to oil and natural gas exploration and production firms and oilfield service companies.
SND owns and operates a raw frac sand mine and related processing facility near Oakdale, Wisconsin.
It has 244 million tons of proven recoverable sand reserves and 92 million tons of probable recoverable sand reserves,
SND's Oakdale facility has on-site processing and rail loading facilities. It owns a second property in Jackson County, Wisconsin, which it calls the Hixton site.
Charts
SND's 6-month performance chart shows the stock appreciating 90% versus a 10% gain for the Stock market.
The stock moved sharply higher after its last earnings report. Insiders have not been active with the stock.
SND's long-term chart shows the stock coming public in October of last year at $10.30. The stock has climbed steadily. It has doubled and made a new all-time high.
SND's daily chart shows the stock climbing from near $10 a share back in November to a peak near $19 by January.
The stock put down a tight cup-and-handle base above its 50-day moving average line.
The breakout looks solid with a widening of the daily spread.
The CCI momentum indicator is bullish.
Earnings Outlook
Analysts expect SND to check in with earnings of 28 cents a share for 2016.
The key is 2017. They project an 88% surge in profits to 52 cents a share from the anticipated 28 cents for 2016.
Net for the fourth quarter should be 50 cents a share. There was no comparison with a year ago.
Analysts have noted that demand for sand by the oil firms is increasing as oil prices have risen.
They have said with horizontal rig count up 80% from its low drillers are using up to four-times as much sand per well.
Strategy Opinion: TTD is targeting SND for a move to $26 off this breakout. A protective stop can be placed near $19.50.
TTD rates SND a good intermediate-term play provided earnings remain on course.
Suitability: Aggressive Bulls.
TTD's special research of SND's Prior Performance after a Breakout:
TTD's research shows that recently (see table) SND's breakouts are working extremely well. The stock is hot. There is an old saying: "Never bet against a winner." So far SND is a winner.
SND's seasonal charge also points out its excellent performance so far. Of course, the stock is strongly tied to the price of oil and that industry.
Stock's Prior Performance After A Breakout
|
Stock's % Change from Breakout to peak - prior to cut below 50-day M/A. |
Date of Breakout |
Break point Price |
Stocks Price Peak after Breakout - prior to cut below 50-day M/A |
Date Trade Closed |
|
43% |
12/19/2016 | 14.63 | 21 | Still in play |
|
74% |
11/23/2016 | 12.04 | 21 | Still in play |
(In actual trading, entry and exit points could vary depending on broker execution.
Also, ideal are breakouts to a new 52-week high or better, perhaps all-time highs.)
Stock's Long-term Chart
Stock's Performance Chart with Quarterly Earnings Markers vs. S&P 500
Insider Buying in Green - Insider Selling in Red
Stock's Monthly Seasonal Performance Chart - Past 5 Years
Showing % Months UP and % Change
Charts of Selected Breakout Stocks
| TTD's Quality Rating of Stock - HCKT - ABOVE AVERAGE |
| TTD's Quality Rating of Stock - TOL - ABOVE AVERAGE |
| TTD's Quality Rating of Stock - DEL - AVERAGE |
| TTD's Quality Rating of Stock - LNTH - AVERAGE |

Ticker Tape Digest’s Daily List of “Stocks To Sell or Sell Short” ranks stocks well timed to be sold immediately based on daily trading. The list can be used as an alert to reduce current long-term positions.
Shorts from tape action so far today - 6
Stocks Screened - 8,300
Long-Term Environment for bears: Unfavorable.
Bear Side - Small list of breakdown stocks Wednesday. Bears be conservative. Stock market still holds up trend.
TTD's short from Tuesday was Albany Molecular Research Inc. (AMRI) at $16.39. Wednesday, AMRI declines to $15.46, off 0.93. It is working well for bears.
TXRH, based in Louisville, Ky., operates around 400 casual restaurants. Annual revenues: TXRH's stock falls sharply Wednesday after reporting disappointing earnings for the fourth quarter. TTD sees more on the downside. 
TTD highlighted TXRH as a short at our midsession video show on the Web Wednesday.
Many restaurant stocks got knocked down hard Wednesday.
So far today, TXRH is trading a heavy 8.3 million shares, 13 times its average daily volume.
TXRH came in with net for the fourth quarter of 29 cents a share.
That was well below the consensus estimate of 38 cents a share.
TXRH had tended to come in close to the Street estimate. So, the results were a big surprise.
TXRH's stock fell sharply in after hours trading on Tuesday. It continued lower Wednesday touching an intraday low of $40.80.
The stock then lifted at midday getting back to around $41.90.
Tape Action
TXRH's tape action shows the recent block trades.
One can see the price for the blocks falling from $48.05 in the prior session to as low as $41.73.
A key bearish trade came late on Tuesday when a block of 32,640 shares (duplicated) crossed the tape at $47.79.
That was down from the prior block trade at $48.05 on 22,843 shares.
Business
TXRH restaurants specialize in steaks. It also offers ribs, fish, seafood, chicken, pork chops, pulled pork and vegetable plates, and hamburgers, salads and sandwiches.
The company's entrees include over two made-from-scratch side items and a free unlimited supply of peanuts and fresh baked yeast rolls.
TXRH has 400 company restaurants and 80 franchise restaurants in 50 states and four foreign countries.
Earnings
This year, analysts have been forecasting a 17% increase in net to $1.97 a share. However, that estimate could come down
Net for the first quarter is currently expected to rise 13% to 62 cents a share from 55 cents a year before.
Charts
TXRH's daily chart shows the stock climbing from $38 in October to as high as $50. The stock faded back and tried to base. However, Wednesday, the stock gaps lower on big volume. The stock's CCI momentum indicator is strongly bearish.
TXRH's 12-month performance chart shows TXRH up 12% versus a 23% gain for the stock market.
Insiders received a lot of stock options late in the year. The price was not disclosed. They have been steady sellers. The largest insider seller recently was the CEO Wayne Taylor who sold several hundred thousand shares around $42 to $36 recently.
Strategy Opinion: TTD is targeting TXRH for a decline to $35 within the next few months, or sooner. A protective stop buy can be placed near $44.10.
Suitability: Aggressive Bears.
| TTD's Quality Rating of Stock - TXRH - BELOW AVERAGE |
Stock Performance Chart with Quarterly Earnings Markers vs. S&P 500
Insider Buying in Green - Insider Selling in Red
TTD columnist Leo Fasciocco has covered the stock market for over 30 years. His articles appear in many publications. He is also a speaker at the Intershow conferences. He has been on television and radio. He is author of many educational articles about stock investing and the book “Guide To High-Performance Investing.”

For information to subscribe to the Ticker Tape Digest Services call: Beverly Owen at 1-480-926-1680. Distributed by Corona Publishing Enterprises. Ticker Tape Digest Inc. P.O. Box 2044 Chandler, Az. 85244-2044. TTD “Professional Report” is available on the World Wide Web: $100 per month. Password needed. “TTD Professional“ Faxed is $200 per month. The TTD Daily Report is $39.95. Credit cards accepted.
(The information contained has been prepared from data deemed reliable but there is no guarantee of complete accuracy. Ticker Tape Digest Inc. is not affiliated with any broker, dealer or investment advisor. Nothing in this publication constitutes an offer, recommendation or solicitation to buy or sell any securities. Further research is advised. This report is copyrighted and no redistribution is permitted with out permission.)