Daily - Go to TTD's Chart scroller of Breakout and Leading Stocks - Tuesday, March 1, 2016
|
Daily - Go to TTD's Chart scroller of Breakout and Leading Stocks - Tuesday, March 1, 2016 |
|
Weekly - Bullish Conservative Investors - Go To TTD Long-Term Plays - Monday, February 29, 2016 |
|
Go to Video Show - "How to Make Money With Breakout Stocks" |
|---|

By Leo Fasciocco -- TTD
Ticker Tape Digest presents its daily stock market report containing stocks to go long as breakout trades, quick trades, or bargain trades. We also feature stocks under Significant Accumulation that are poised to breakout.
|
Ticker Tape Digest's Daily schedule guide for TTD subscribers 1. Pre-market - check Breakout Watch List and Quick Trades. 2. Morning - (11:30 - 12 A.M.) - check breakout stocks tape and breakout chart slide show. 3. Midday (1 P.M.) check TTD Midsession Report and see market video show. 4. After close (4 P.M.) check final TTD Report for day. Trading Strategies Bullish Aggressive Investors Bullish - "Breakout Stocks" - ideally suited for bull markets and special situation stocks. Potential for large returns. (See Performance) Aggressive Investor Bullish- "Quick Trade Stocks" -ideally suited for entry into top performing issues looking for a small quick profit." (See Performance) Conservative Investors "Bargain Buy Trades for the Long Term." Ideally suited for entry into top performing big cap stocks on pullbacks within overall up trend.(See Performance) Bearish Aggressive Bearish Investors - "Breakdown Stocks" to Sell Short. Ideally suited for bear markets or market pull backs. Potential for large returns (See Performance) |
|---|
The TTD report also contains stocks to short as breakdown plays and as bargain (swing trade) shorts.
Investors should tend to try to go with a strategy that fits with the stock market's trend, unless there is a special situation play.
TTD's Breakout Stocks - Long are
most suitable for aggressive investors seeking ideal entry points into leading stocks, especially during bull markets. They can do extremely well in bull markets with gains of as much as several hundred percent. 
These stocks can also do extremely well during strong market rallies, or if they are in a industry group that is performing very well. They tend to have strong earnings outlooks and are near new-52 week, or all-time highs.
TTD Quick Trade Stocks - Long These are leading issues that have pulled back in recent days, but could move higher soon. They are most suitable for Aggressive Investors willing to trade short term. These stocks will do extremely well during market advances. They have about 74% win rate. During market rally sequences the win rate is even higher. The return is small 3% to 8% in just a few days.
TTD's Bargain Buy Trades - Long - Long Term. These are for conservative bullish Investors These long-term buys are ideally suited for entry into stocks on pull backs within overall up trend. These stocks can give a good return long-term especially during a bull market.
TTD also presents Stocks To Sell or Sell Short. These issues are suitable for aggressive investors willing to take short positions both as trades or for longer-term plays. These stocks will do very well during bear markets or market pull backs.
TTD's Bearish breakdown stocks to sell short. These issues have potential to fall sharply. They often show a technical breakdown and also some fundamental business problem such as weak earnings.
TTD's multi-media updates include a slide-show that presents charts and analysis at midsession. Some times TTD presents feature analysis on stocks and the market. TTD uses Windows Media Files. (WMV).
TTD also presents a "Breakout Watch List" that is up dated daily. This list consists of key stocks in position to breakout. A close watch of this list can put you in the stock just as it breaks out. A good idea is to study the list and be ready to move into a stock quickly as it hits its breakpoint.
TTD often suggests using stop buy orders to enter. It is very important to buy a breakout stock as close as possible to the breakpoint. The idea is to get "elbow room" if the stock should follow through to the upside. This is very important in being successful in making big money with breakout stocks.
It is also essential to have a stop loss strategy for all stocks in which positions are taken. Not every stock will work as expected. It is important for investors to "police" their portfolios and avoid getting trapped in any bad positions.
Quality rating of breakout Two key factors: 1 - Stock near all-time high in price or near a 52-week high. 2 - earnings growth current year is strong. The ideal play is a stock with an Above Average Quality Rating. The stock is near a new high and will have strong earnings. TTD's other ratings are Average and Below Average.
TTD also has special feature sections on Educational Tips on Investing.
To email Mr. Leo Fasciocco leo@tickertapedigest.com.For service, email Beverly Owen owen@tickertapedigest.com. TTD’s Tel: 1-480-926-1680.
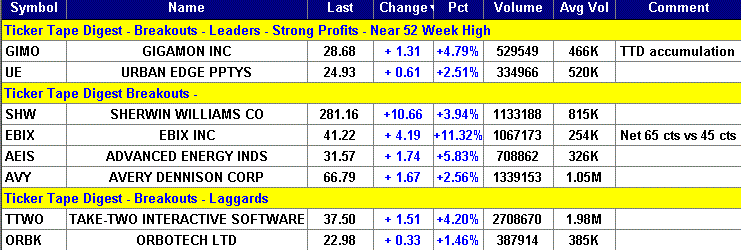
Breakout Stocks
Total Buy Breakouts so far today - 8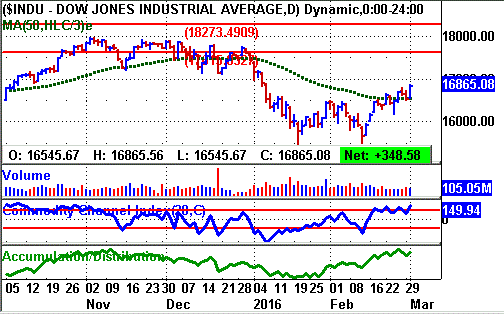
Overall Quality of Breakouts - AVERAGE
Stocks Screened - 8,300
Bull side - Breakout list very selective with some new names. Bulls be cautious. Stock market stages strong rally holds near-term up trend.
(Put mouse on Dow chart to see Nasdaq chart)
Long Term Environment for bulls: Neutral
Stock Market Momentum
Market (Daily) - NYSE Bullish, Nasdaq Bullish
Market (Weekly) - NYSE Bullish, Nasdaq Bullish
Market (Monthly) - NYSE Bearish, Nasdaq Bearish
Ticker Tape Digest's
|
TTD's Quality Rating of Stock - GIMO - ABOVE AVERAGE |
GIMO, based in Santa Clara, Ca., provides network traffic monitoring services. Annual revenues: $222 million. GIMO's stock moves higher Tuesday and breaks out from a five month flat base. So far, GIMO is trading 529,548 shares. Its average daily volume is 466,000 shares. 
TTD featured GIMO as a potential breakout recently.
The stock has been performing well having appreciated 32% the past 12 months versus a decline of 8.7% for the S&P 500 index.
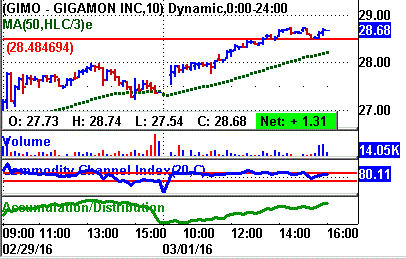
GIMO's stock advanced in the morning and early in the afternoon it cut across its breakpoint line (see 10-minute chart).
The stock reached an intraday high of 28.74. It then held the gain into the final bell.
GIMO's tape action shows the recent block trades.
One can see the price for the blocks climbing from $27.37 in the session on last Friday to as high as $28.68 on Tuesday.
A key bullish trade came in the morning when a block of 4,735 shares crossed the tape at $27.73.
That was up from the prior block at $27.37 on 35,243 shares.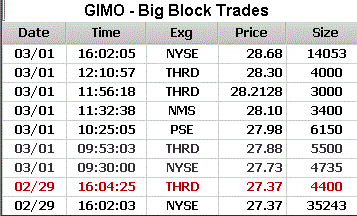
GIMO makes tech products that provide customers with visibility and control of network traffic for enterprises and services providers around the world.
The company offers traffic visibility fabric solutions consisting of network traffic intelligence, such as proprietary traffic selection, forwarding, manipulation, modification, de-duplication, correlation, and sampling capabilities.
Its solutions enable IT firms to forward traffic from network and server infrastructure to management, analysis, compliance, and security tools in a manner that is optimized for specific uses.
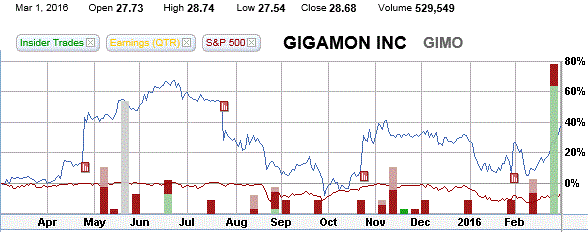
GIMO's 12-month performance chart shows the stock appreciating 38% versus a 5% decline in the stock market.
Most importantly, one can see heavy insider buying recently. (see green bars on chart)
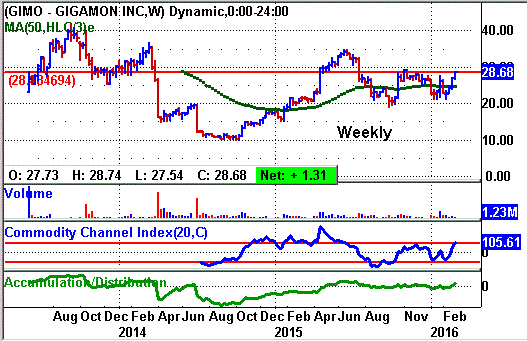
GIMO's long-term chart shows the stock coming public in July of 2013 at 27.60.
The stock shot up to its all-time high of 41.81 by September of 2013.
However, it tumbled back to 10 in 2014. Nevertheless, it has made a comeback and is now in an overall up trend. 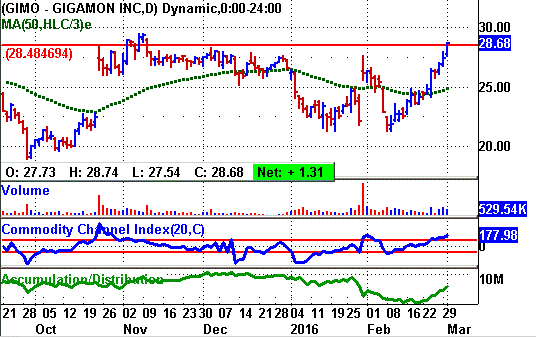
GIMO's daily chart shows the stock pushing higher to 28.68 to clear its resistance point.
The stock has made a strong run in recent sessions. So, it is a bit extended near-term
The CCI momentum indicator (bottom of chart) is solidly bullish.
The accumulation - distribution line (bottom of chart) lags, but is improving.
That was due in part to some heavy selling in late January.
This year, analysts are forecasting GIMO will post a profit of 43 cents a share compared with a loss of 6 cents a year ago.
The stock sells with a projected p/e ratio of 57. That is high. So, the stock is most suitable for aggressive investors.
Going out to 2017, the Street looks for a 75% leap in net to 75 cents a share from the anticipated 43 cents this year.
Net for the upcoming first quarter is expected to come in at 4 cents a share compared with a loss of 2 cents a year ago.
Then, for the second quarter, analysts predict a profit of 8 cents a share compared with a breakeven the year before.
GIMO has tended to top Street earnings estimates in recent quarters. (see table)
Strategy Opinion: TTD is targeting GIMO for a move to 35 off this breakout. We would suggest a scale-in strategy since the stock is a bit extended near-term.
TTD rates GIMO a good intermediate-term play provided earnings meet expectations.
Sponsorship: Good. A key fund buyer recently was the 5-star rated Vanguard Strategic Small-Cap Equity Fund which purchased 47,200 shares. It has a 0.5% stake.
The largest fund holder is the 3-star rated Vanguard Explorer Fund with a 2.7% stake. It was a recent buyer of 9,000 shares.
GIMO has 34 million shares outstanding. Institutions hold 71% of the stock and insiders have 15%
Insider Activity: Bullish. Specific data not available. However, our charts show strong insider buying.
Currently, 6 analysts follow the stock, 5 have a buy, the same as three months ago.
GIMO has a book value of $4.54 a share.
Stock Performance Chart with Quarterly Earnings Markers.
| TTD's Breakout Profile
Rating Gigamon Inc. - (GIMO) |
| TTD Check List | Bullish | Bearish | Neutral |
| Near 52-week High | YES | ||
| Volume | YES | ||
| Tick Volume | YES | ||
| Price Trend - Daily | YES | ||
| Price Trend - Long Term | YES | ||
| Price Daily Spread | YES | ||
| Base Structure | YES | ||
| Base - A-D | YES | ||
| Earnings-Quarterly | YES | ||
| Earnings-Long Term | YES | ||
| Earnings Outlook | YES | ||
| Industry Group | YES | ||
| Prior Breakout Success | YES | ||
| Fund Sponsorship | YES | ||
| Total Score | 10 | 0 | 4 |
Charts of Selected Breakout Stocks
| TTD's Quality Rating of Stock - UE - ABOVE AVERAGE |

| TTD's Quality Rating of Stock - SHW - AVERAGE |
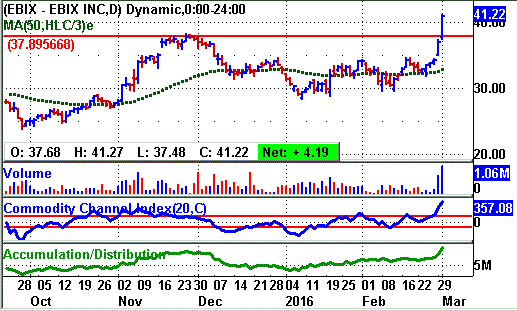
| TTD's Quality Rating of Stock - EBIX - AVERAGE |
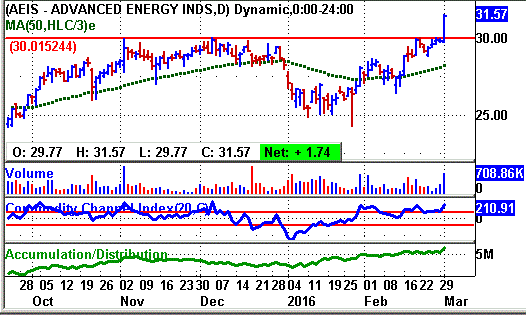
| TTD's Quality Rating of Stock - AEIS - AVERAGE |

Ticker Tape Digest’s Daily List of “Stocks To Sell or Sell Short” ranks stocks well timed to be sold immediately based on daily trading. The list can be used as an alert to reduce current long-term positions.
Shorts from tape action so far today - 4
Stocks Screened - 8,300
Long-Term Environment for bears: Neutral.
Bear Side - Small list of breakdown stocks Tuesday. Stock market rallies strong. Bears be patient and conservative.
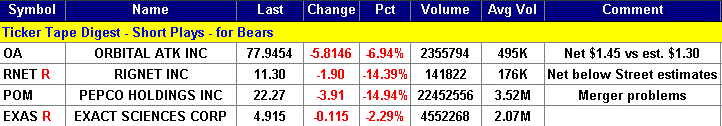
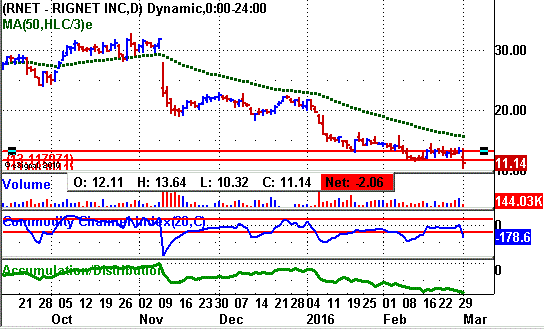
RNET, based in Houston, provides digital technology services to the oil and gas industry. Annual revenues: $305 million. RNET's stock falls sharply Tuesday after the company reported earnings below Street estimates. TTD sees more on the downside. 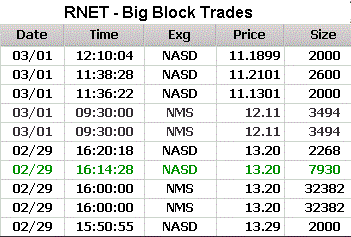
So far today, RNET is trading 221,383 shares. Its average daily volume is 176,000 shares.
TTD highlighted RNET as a short at our midsession video show on the Web Tuesday.
RNET's stock fell sharply in the morning undercutting key technical support.
The stock then trended mostly sideways the rest of the day.
RNET's tape action shows the recent block trades.
One can see a key bearish trade coming at the close on Monday. That is when a block of 32,382 shares (duplicated) crossed the tape at $13.20.
That was down from the prior block trade at $13.29 on 2,000 shares.
RNET offers remote communications services through a controlled and managed Internet protocol/multiprotocol label switching global network, enabling drilling contractors, oil companies, and oilfield service companies to communicate.
The company also offers a communications package of voice, data, video, networking, and real-time data management to offshore and land-based remote locations.
RNET' is expected to show a 73% plunge in earnings this year to 61 cents a share from $2.28 in 2015.
Net for the upcoming first quarter is expected to drop 44% to 10 cents a share from 18 cents the year before.
RNET's daily chart shows the stock trending lower from 30 down to 12. The weakness in the stock is due in part to the decline in oil prices and rig activity. The stock cuts below key support Tuesday.
The accumulation - distribution line makes a new low confirming the selling pressure.
Strategy Opinion: TTD is targeting RNET for a decline to 8 within the next few months, or sooner.
A protective stop buy can be placed near 12.
| TTD's Quality Rating of Stock - RNET - BELOW AVERAGE |
TTD columnist Leo Fasciocco has covered the stock market for over 20 years. His articles appear in many publications. He is also a speaker at the Intershow conferences. He has been on television and radio. He is author of many educational articles about stock investing and the book “Guide To High-Performance Investing.”

For information to subscribe to the Ticker Tape Digest Services call: Beverly Owen at 1-480-926-1680. Distributed by Corona Publishing Enterprises. Ticker Tape Digest Inc. P.O. Box 2044 Chandler, Az. 85244-2044. TTD “Professional Report” is available on the World Wide Web: $100 per month. Password needed. “TTD Professional“ Faxed is $200 per month. The TTD Daily Report is $39.95. Credit cards accepted.
(The information contained has been prepared from data deemed reliable but there is no guarantee of complete accuracy. Ticker Tape Digest Inc. is not affiliated with any broker, dealer or investment advisor. Nothing in this publication constitutes an offer, recommendation or solicitation to buy or sell any securities. Further research is advised. This report is copyrighted and no redistribution is permitted with out permission.)