![]()
|
|
|
Weekly - Bullish Conservative Investors - Go To TTD Long-Term Plays - Monday, March 2, 2020 |
|
Go to Video Show - "How to Make Money With Breakout Stocks |
|---|

By Leo Fasciocco -- TTD
Ticker Tape Digest presents its daily stock market report containing stocks to go long as Breakout Trades, Quick Trades, or Bargain Accumulation Trades.
We also feature stocks under Significant Accumulation that are poised to breakout.
|
Ticker Tape Digest's Daily schedule guide for TTD subscribers 1. Pre-market - check Breakout Watch List and Quick Trades. 2. Morning - (11:30 - 12 A.M.) - check breakout stocks tape and breakout chart slide show. 3. Midday (1 P.M.) check TTD Midsession Report and see market video show. 4. After close (4 P.M.) check final TTD Report for day. Trading Strategies Bullish Aggressive Investors Bullish - "Breakout Stocks" - ideally suited for bull markets and special situation stocks. Potential for large returns. (See Performance) Aggressive Investor Bullish- "Quick Trade Stocks" -ideally suited for entry into top performing issues looking for a small quick profit." (See Performance) Conservative Investors "Bargain Buy Trades for the Long Term." Ideally suited for entry into top performing big cap stocks on pullbacks within overall up trend.(See Performance) Bearish Aggressive Bearish Investors - "Breakdown Stocks" to Sell Short. Ideally suited for bear markets or market pull backs. Potential for large returns (See Performance) |
|---|
The TTD report also contains stocks to short as breakdown plays and as bargain (swing trade) shorts.
Investors should tend to try to go with a strategy that fits with the stock market's trend, unless there is a special situation play.
TTD's Breakout Stocks - Long are
most suitable for aggressive investors seeking ideal entry points into leading stocks, especially during bull markets. They can do extremely well in bull markets with gains of as much as several hundred percent. 
These stocks can also do extremely well during strong market rallies, or if they are in a industry group that is performing very well. They tend to have strong earnings outlooks and are near new-52 week, or all-time highs.
TTD Quick Trade Stocks - Long These are leading issues that have pulled back in recent days, but could move higher soon. They are most suitable for Aggressive Investors willing to trade short term. These stocks will do extremely well during market advances. They have about 74% win rate. During market rally sequences the win rate is even higher. The return is small 3% to 8% in just a few days.
TTD's Bargain Buy Trades - Long - Long Term. These are for conservative bullish Investors These long-term buys are ideally suited for entry into stocks on pull backs within overall up trend. These stocks can give a good return long-term especially during a bull market.
TTD also presents Stocks To Sell or Sell Short. These issues are suitable for aggressive investors willing to take short positions both as trades or for longer-term plays. These stocks will do very well during bear markets or market pull backs.
TTD's Bearish breakdown stocks to sell short. These issues have potential to fall sharply. They often show a technical breakdown and also some fundamental business problem such as weak earnings.
TTD's multi-media updates include a slide-show that presents charts and analysis at midsession. Some times TTD presents feature analysis on stocks and the market. TTD uses Windows Media Files. (WMV).
TTD also presents a "Breakout Watch List" that is up dated daily. This list consists of key stocks in position to breakout. A close watch of this list can put you in the stock just as it breaks out. A good idea is to study the list and be ready to move into a stock quickly as it hits its breakpoint.
TTD often suggests using stop buy orders to enter. It is very important to buy a breakout stock as close as possible to the breakpoint. The idea is to get "elbow room" if the stock should follow through to the upside. This is very important in being successful in making big money with breakout stocks.
It is also essential to have a stop loss strategy for all stocks in which positions are taken. Not every stock will work as expected. It is important for investors to "police" their portfolios and avoid getting trapped in any bad positions.
Quality rating of breakout Two key factors: 1 - Stock near all-time high in price or near a 52-week high. 2 - earnings growth current year is strong. The ideal play is a stock with an Above Average Quality Rating. The stock is near a new high and will have strong earnings. TTD's other ratings are Average and Below Average.
TTD also has special feature sections on Educational Tips on Investing.
To email Mr. Leo Fasciocco leo@tickertapedigest.com.
For service, email Beverly Owen owen@tickertapedigest.com. TTDÆs Tel: 1-480-878-8381 or 480-704-3331.
Wednesday - March 4, 2020
TTD's Breakout Stocks
Stock Market Overview
Total Buy Breakouts - 5
Quality of Breakouts - Below Average.
Stocks Screened - 12,234
Bull side - Small list of breakouts and very selective. Bulls be conservative.
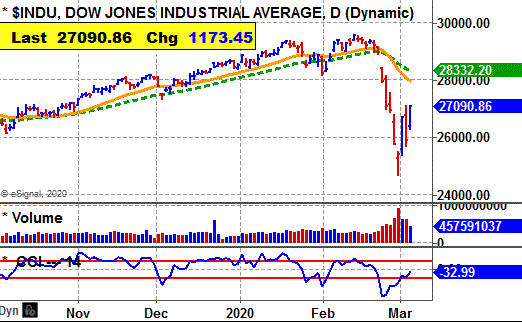
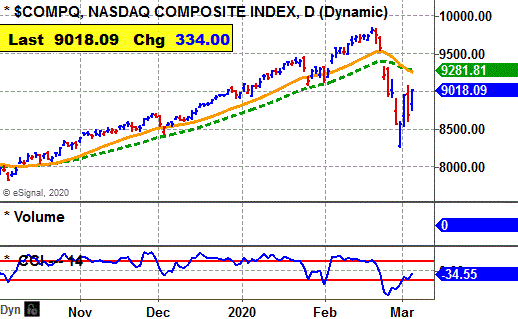
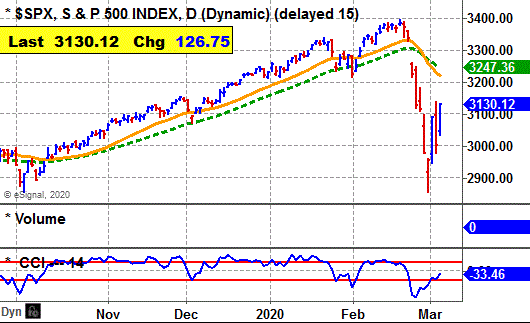
Stock market - Major averages still bearish for the daily and weekly, except for the Nasdaq. Monthly averages now bullish.
Comment - Stock market is now in a bottoming process. However, it needs to be watched closely. A key would be to see a contraction in volatility and volume.
See Latest Earnings Reports - A company that tops the Street's highest earnings estimate has potential to go higher. Key earnings beats - RYI, CECE, GWRE, PING and TAC.
Stock Market Momentum
(Daily is based on a moving average)
|
Market (Daily) |
Market (Weekly) |
Market (Monthly) |
|
Dow - Bearish |
Dow - Bearish |
Dow - Bullish |
|
Nasdaq - Bearish |
Nasdaq - Bullish |
Nasdaq - Bullish |
|
S&P 500 - Bearish |
S&P 500 - Bearish |
S&P 500 - Bullish |
 Ticker Tape Digest's
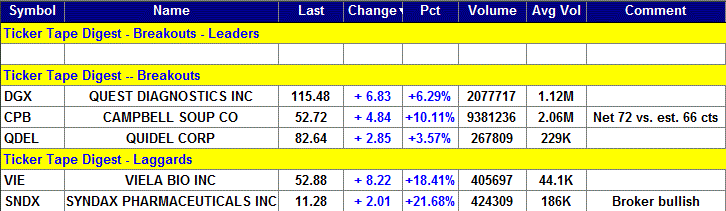
|
TTD's Quality Rating of Stock - DGX - AVERAGE |
DGX, based in Secaucus, N.J., provides diagnostic information services. Annual revenues: $7.7 billion. DGX's stock drives higher Wednesday and breaks out from its 6-week flat base. 
So far today, DGX is trading 2.1 million shares, almost double its average daily volume of 1.1 million shares.
TTD sees more on the upside. 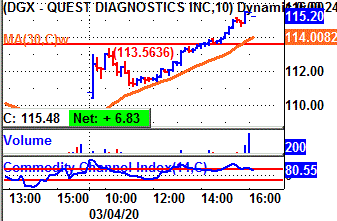
DGX's stock gapped higher in the morning.
It then trended sideways.
In the early afternoon, DGX cleared its breakpoint line.
The stock closed at its high for the day. That is bullish.
Tape Action
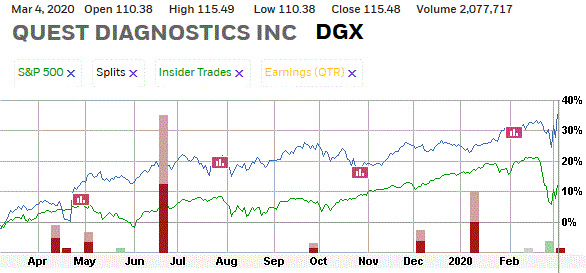
DGX's tape action shows the recent block trades.
One can see the price for the blocks climbing from $108.65 in the prior session to as high as $115.48 by the close.
A key bullish trade came in the morning when a massive block of 187,493 shares crossed the tape at $108.65.
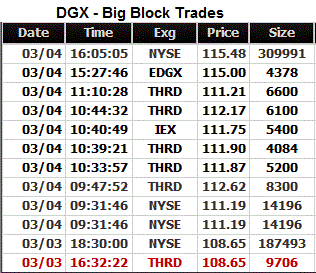 The price of the stock then moved higher.
Neat the close a block of 309,991 shares crossed at $15.48.
That was up from the prior block at $115 on 4,378 shares.
Business
DGX operates through two businesses: Diagnostic Information Services and Diagnostic Solutions.
The diagnostic information delivers diagnostic testing information on patients to clinicians, hospitals, integrated delivery networks and accountable care organizations (ACOs).
Its diagnostic solutions group includes its risk assessment service. It offers solutions for insurers, and its healthcare information technology businesses.
Charts
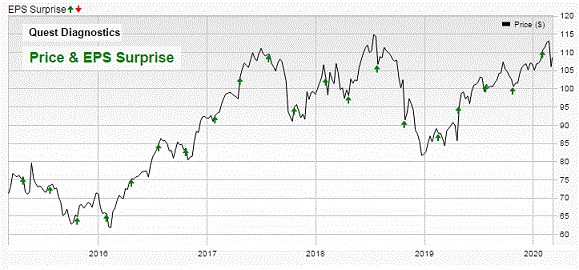
DGX's 12-month performance chart shows the stock up 35% versus a 10% gain for the stock market.
Insiders were recent buyers at $52 to $66 a share.
They were sellers at $109 to $112 a share.
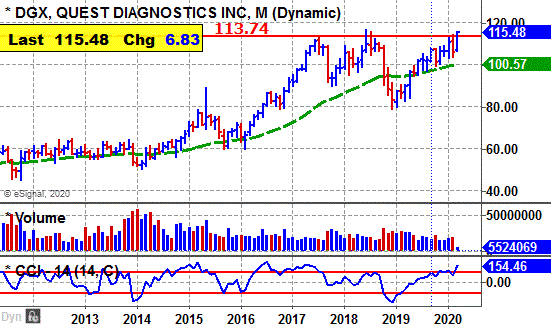
DGX's long-term chart shows the stock climbing from $50 back in 2014 to a peak at $112 by 2017.
 The stock then worked its way to a peak at $116 by 2018. It then pulled back hard to $80, but has since come on again.
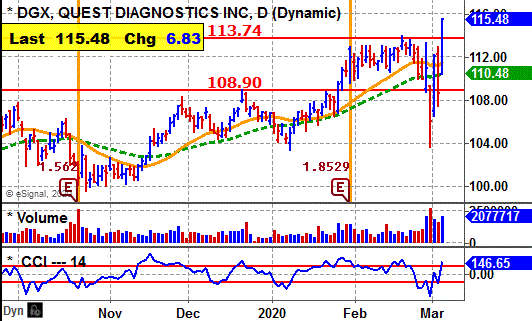
DGX's daily chart shows the stock advancing from $100 in October to a peak near $113
The stock put down a flat base.
It was knocked back to around $104 during the recent market selloff.
However, it has come back very strong.
The stock's CCI momentum indicator is bullish.
Earnings Outlook
This year, analysts are forecasting a modest 1% increase in net to $6.65 a share versus $6.56 the prior year.
Looking out to 2021, the Street expects a 6% rise in net to $7.03 a share from the anticipated $6.65 this year.
For the first quarter, net should be up 6% to $1.49 a share from the $1.40 the prior year.
DGX did beat the Street estimate the past four quarters by 7 cents a share, 4 cents, 4 cents and 4 cents.
Looking ahead to the second quarter, analysts expect just flat net at $1.73 a share.
Strategy Opinion: TTD is targeting DGX for a move to $1.30 within the next few months, or sooner.
A protective stop can be placed near $111.
Intermediate-Term Rating: Below Average.
Suitability: Average Bulls.
TTD's special research of Stock's Prior Performance:
|
Breakout Success |
Bullish |
DGX scored modest gains off recent breakouts. |
|
Response to Net |
Bullish |
DGX rose 10 times after 15 earnings reports. |
|
Seasonal Success |
Bullish |
DGX avg. gain 3.7% in March., 5.7% in April prior years. |
|
Earnings Beats |
Bullish |
DGX beat Street net estimate 6 times after 10 reports. |
Stock's Prior Performance After A Breakout
|
Stock's % Change from Breakout to peak - prior to cut below 50-day M/A. |
Date of Breakout |
Break point Price |
Stocks Price Peak after Breakout - prior to cut below 50-day M/A |
Date Trade Closed |
|
4% |
1/24/2020 | 109.11 | 113.48 | 2/19/2020 |
|
13% |
4/23/2019 | 91.67 | 103.97 | 7/3/2019 |
|
7% |
5/24/2018 | 107.50 | 114.95 | 7/13/2018 |
|
27% |
11/22/2016 | 86.86 | 111.11 | 6/28/2017 |
|
19% |
4/11/2016 | 72.44 | 86.36 | 7/29/2016 |
(In actual trading, entry and exit points could vary depending on broker execution.
Also, ideal are breakouts to a new 52-week high or better, perhaps all-time highs.)
Stock's Long-term Chart
Stock's Price Performance after Reporting Earnings
Stock's Performance Chart with Quarterly Earnings Markers vs. S&P 500
Insider Buying in Green - Insider Selling in Red
Charts of Selected Breakout Stocks
|
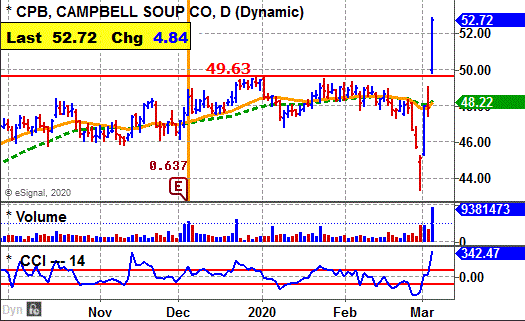
TTD's Quality Rating of Stock - CPB - AVERAGE |
|
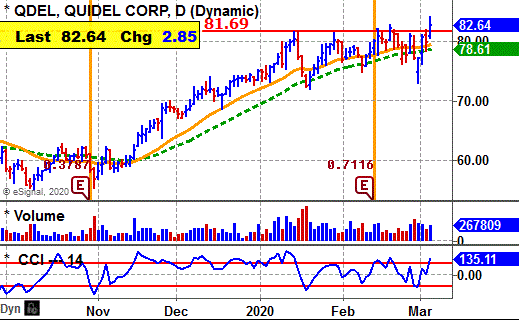
TTD's Quality Rating of Stock - QDEL- AVERAGE |
|
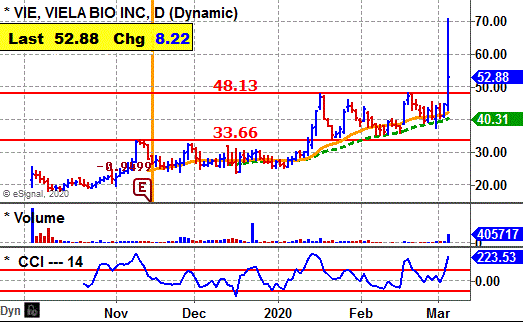
TTD's Quality Rating of Stock - VIE - BELOW AVERAGE |
|
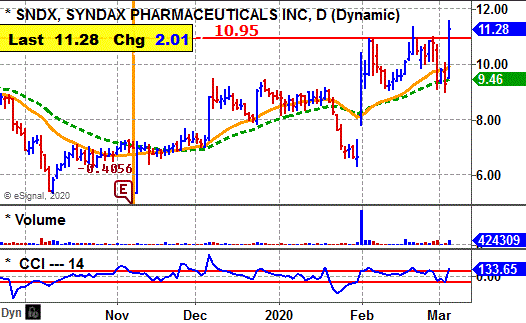
TTD's Quality Rating of Stock - SNDX - BELOW AVERAGE |

Ticker Tape DigestÆs Daily List of ōStocks To Sell or Sell Shortö ranks stocks well timed to be sold immediately based on daily trading. The list can be used as an alert to reduce current long-term positions.
Shorts from tape action for Thursday - 2
Stocks Screened - 12,234
Long-Term Environment for bears: Neutral.
Bear Side - Small list of shorts as stock rebounds sharply. Bears be selective.

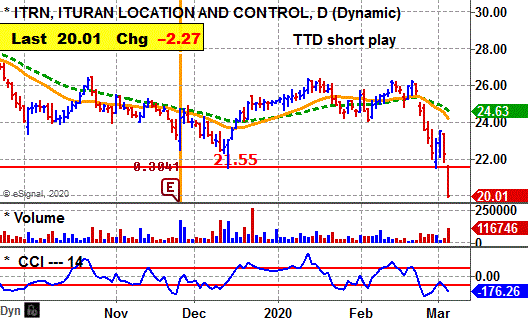
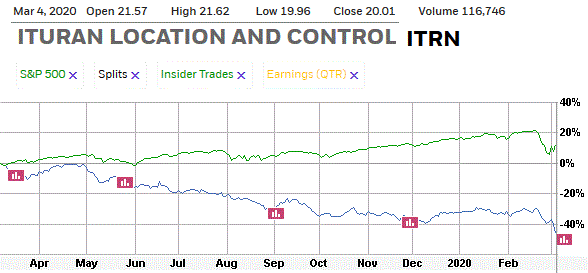
ITRN, based in Israel. provides location-based services for stolen vehicle recovery, fleet management services and other tracking services. Annual revenues: $253 million. ITRN's stock falls sharply Wednesday and undercuts key technical support. 
So far today, ITRN is trading 116,746 shares, double its average daily volume of 45,000 shares.
TTD sees more on the downside. TTD highlighted ITRN as a short at our midsession video show on the Web Wednesday. 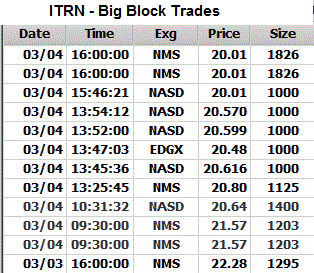
ITRN's stock gapped lower in the morning and undercut key technical support.
The stock closed near its low for the session. That is bearish.
Tape Action
ITRN's tape action shows the recent block trades.
One can see the price for the blocks falling from $22.28 in the prior session to as low as $20.01 near Wednesday's close.
A key bearish trade came in the morning when a block of 1,203 shares (duplicated) crossed the tape at $21.57.
That was down from the prior block at $22.28 on 1,285 shares in the prior session.
Business
ITRN provides wireless communication products used with its location-based services and other applications.
It primarily provides its services, as well as sells and leases its products in Israel, Brazil, Argentina and the U.S.
Earnings:
This year, analysts are forecasting a 2% increase in net to $1.72 a share from the $1.68 the prior year.
However, net for the upcoming first quarter should fall 14% to 43 cents a share from the 50 cents the prior year.
Charts:
ITRN's daily chart shows the stock cutting below support in the morning and closing near its low for the day.
ITRN's 12-month performance chart shows the stock down 48% versus a 10% gain for the stock market.
Strategy Opinion: TTD is targeting ITRN for a decline to $15. A protective stop buy can be placed near $22.
Suitability: Aggressive Bears.
TTD's Stock Probability research of Prior Performance:
|
Response to Net |
Bearish |
ITRN rose one time after 7 earnings reports. |
|
Seasonal Success |
Bullish |
ITRN rose 0.2% in March, 3.9% in April in prior years. |
|
Earnings Beats |
Neutral |
ITRN beat Street estimate 3 times after 6 reports. |
|
TTD's Quality Rating of Stock - ITRN - BELOW AVERAGE |
Stock's Performance Chart with Quarterly Earnings Markers vs. S&P 500
Insider Buying in Green - Insider Selling in Red
TTD columnist Leo Fasciocco has covered the stock market for over 30 years. His articles appear in many publications. He has also been a speaker at the Money Show conferences. He has been on television and radio. He is author of many educational articles about stock investing and the book ōGuide To High-Performance Investing.ö

For information to subscribe to the Ticker Tape Digest Services call: Beverly Owen at 1-480-878-8381.
Distributed by Corona Publishing Enterprises. TickerTape Digest Inc. 1220 W. Sherri, Gilbert, Az. 85233.
TTD ōProfessional Reportö is available on the Web: $100 per month. Password needed. Published daily - around 20 times a month.
TTD Pro Report includes a Morning chart slide show of breakout stocks, a Midsession video-audio show with commentary on breakout stocks and shorts and a Final end of day overall report on breakout stocks for the session, short plays and accumulation plays. There are other features too such as Quick Trades and Long-term Plays.
TTD Daily Report is $39. It covers a Morning slide show of charts of stocks breaking out and a TTD end of day print report covering breakout stocks and shorts.
Credit cards accepted. Payable to Corona Publishing Enterprises.
(The information contained has been prepared from data deemed reliable but there is no guarantee of complete accuracy. Ticker Tape Digest Inc. is not affiliated with any broker, dealer or investment advisor. Nothing in this publication constitutes an offer, recommendation or solicitation to buy or sell any securities. Further research is advised. This report is copyrighted and no redistribution is permitted with out permission.)