|
Weekly - Bullish Conservative Investors - Go To TTD Long-Term Plays - Monday, March 5 |
|
Go to Video Show - "How to Make Money With Breakout Stocks" |
|---|

By Leo Fasciocco -- TTD
Ticker Tape Digest presents its daily stock market report containing stocks to go long as breakout trades, quick trades, or bargain trades. We also feature stocks under Significant Accumulation that are poised to breakout.
|
Ticker Tape Digest's Daily schedule guide for TTD subscribers 1. Pre-market - check Breakout Watch List and Quick Trades. 2. Morning - (11:30 - 12 A.M.) - check breakout stocks tape and breakout chart slide show. 3. Midday (1 P.M.) check TTD Midsession Report and see market video show. 4. After close (4 P.M.) check final TTD Report for day. Trading Strategies Bullish Aggressive Investors Bullish - "Breakout Stocks" - ideally suited for bull markets and special situation stocks. Potential for large returns. (See Performance) Aggressive Investor Bullish- "Quick Trade Stocks" -ideally suited for entry into top performing issues looking for a small quick profit." (See Performance) Conservative Investors "Bargain Buy Trades for the Long Term." Ideally suited for entry into top performing big cap stocks on pullbacks within overall up trend.(See Performance) Bearish Aggressive Bearish Investors - "Breakdown Stocks" to Sell Short. Ideally suited for bear markets or market pull backs. Potential for large returns (See Performance) |
|---|
The TTD report also contains stocks to short as breakdown plays and as bargain (swing trade) shorts.
Investors should tend to try to go with a strategy that fits with the stock market's trend, unless there is a special situation play.
TTD's Breakout Stocks - Long are
most suitable for aggressive investors seeking ideal entry points into leading stocks, especially during bull markets. They can do extremely well in bull markets with gains of as much as several hundred percent. 
These stocks can also do extremely well during strong market rallies, or if they are in a industry group that is performing very well. They tend to have strong earnings outlooks and are near new-52 week, or all-time highs.
TTD Quick Trade Stocks - Long These are leading issues that have pulled back in recent days, but could move higher soon. They are most suitable for Aggressive Investors willing to trade short term. These stocks will do extremely well during market advances. They have about 74% win rate. During market rally sequences the win rate is even higher. The return is small 3% to 8% in just a few days.
TTD's Bargain Buy Trades - Long - Long Term. These are for conservative bullish Investors These long-term buys are ideally suited for entry into stocks on pull backs within overall up trend. These stocks can give a good return long-term especially during a bull market.
TTD also presents Stocks To Sell or Sell Short. These issues are suitable for aggressive investors willing to take short positions both as trades or for longer-term plays. These stocks will do very well during bear markets or market pull backs.
TTD's Bearish breakdown stocks to sell short. These issues have potential to fall sharply. They often show a technical breakdown and also some fundamental business problem such as weak earnings.
TTD's multi-media updates include a slide-show that presents charts and analysis at midsession. Some times TTD presents feature analysis on stocks and the market. TTD uses Windows Media Files. (WMV).
TTD also presents a "Breakout Watch List" that is up dated daily. This list consists of key stocks in position to breakout. A close watch of this list can put you in the stock just as it breaks out. A good idea is to study the list and be ready to move into a stock quickly as it hits its breakpoint.
TTD often suggests using stop buy orders to enter. It is very important to buy a breakout stock as close as possible to the breakpoint. The idea is to get "elbow room" if the stock should follow through to the upside. This is very important in being successful in making big money with breakout stocks.
It is also essential to have a stop loss strategy for all stocks in which positions are taken. Not every stock will work as expected. It is important for investors to "police" their portfolios and avoid getting trapped in any bad positions.
Quality rating of breakout Two key factors: 1 - Stock near all-time in price or near a 52-week high. 2 - earnings growth current year is strong. The ideal play is a stock with an Above Average Quality Rating. The stock is near a new high and will have strong earnings. TTD's other ratings are Average and Below Average.
TTD also has special feature sections on Educational Tips on Investing.
To email Mr. Leo Fasciocco leo@tickertapedigest.com.For service, email Beverly Owen owen@tickertapedigest.com. TTD’s Tel: 1-480-926-1680.
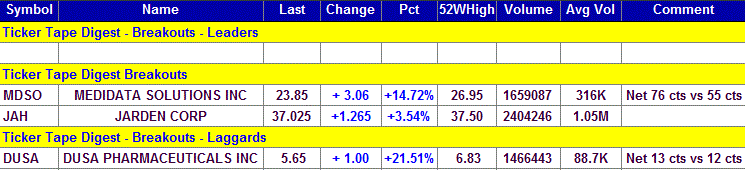
Breakout Stocks
Total Buy Breakouts so far today - 3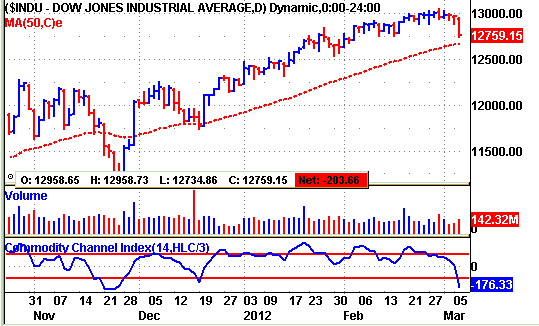
Overall Quality of Breakouts - Average
Stocks Screened - 8,300
Bull side - Very few breakouts Tuesday. Stock market falls sharply in the morning with a gap move. As TTD said on Monday, the market has peaked. Bulls be selective and watch all stop strategies. (Put mouse on Dow chart to see Nasdaq chart)
Long Term Environment for bulls: Neutral
Market (Daily) - NYSE Bearish, Nasdaq Bearish
Market (Weekly) - NYSE Bullish, Nasdaq Bullish
Market (Monthly) - NYSE Bullish, Nasdaq Bullish
Ticker Tape Digest's
|
TTD's Quality Rating of Stock - JAH - ABOVE AVERAGE |
JAH, based in Rye, N.J. sells a wide range of consumer products. Annual revenues: $6.7 billion. JAH's stock breaks out today from a seven-week flat base. The stock's push higher comes against the wind of declining stock market. JAH, a conservative breakout play, is trading a heavy 2.7 million shares, more than double its normal daily volume of 1.1 million shares.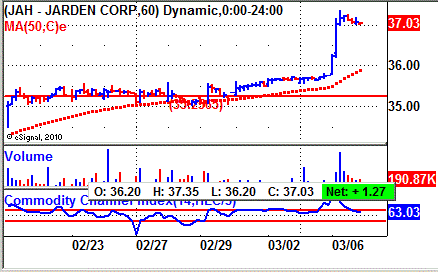

TTD highlighted JAH as a breakout at our midsession video show on the Web Tuesday.
The company recently completed a Dutch Tender Offer for some of its stock.
JAH's 60-minute chart shows the stock trending sideways for several days. The stock then spurted higher on Tuesday.
The move carried the stock clear of its breakpoint. JAH then consolidated its gain in the afternoon.
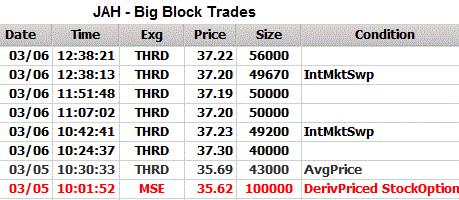 TTD's clip of the tape shows JAH's recent block trades. One can see the price for the blocks climbing from $35.62 on Monday to $37.30 on Tuesday morning.
That key bullish trade came on a block of 40,000 shares. The price for the blocks then dipped slightly
JAH operates in four business segments: outdoor solutions, consumer Solutions, branded consumables and process solutions.
Its sales are principally within the United States.
The Company’s international operations are mainly based in Asia, Canada, Europe and Latin America. The company is aggressive in making acquisitions to expand its operations.
The company makes coffeemakers, bedding vacuum packaging machines, heating pads and cleaning products.
JAH's 12-month performance chart shows the stock appreciating 9% versus a 3% gain for the S&P 500 index. The stock pays a dividend yield of 1%.
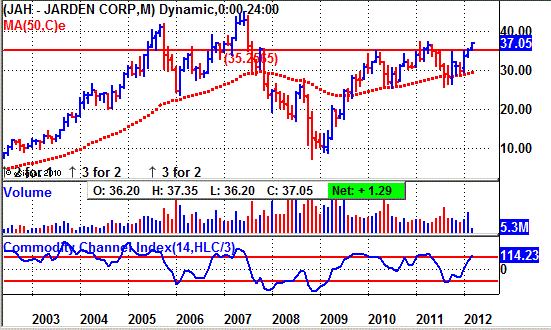
JAH's long-term chart shows the stock climbing from 10 back in 2003 to a peak of 45 in 2007. The stock then was pulled lower by the bear market sinking to 6. However, JAH has since staged a strong come back having made a sixfold move. The stock is positioned to make a new 12-month high. It needs to get over 37.50.
JAH's daily chart shows the stock climbing from 26 back in August to 35 by January. The stock then put down a flat base. Today, it gaps out of the base with a big expansion in volume.
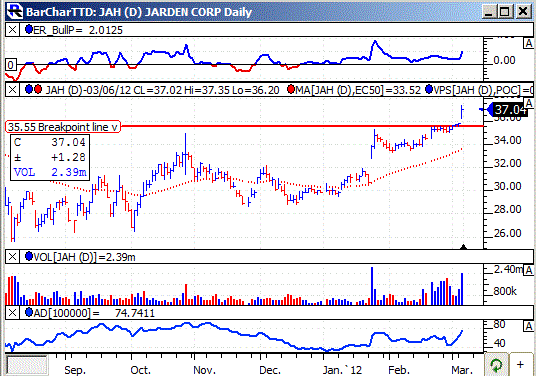
Of course, JAH is a conservative stock. So, one should expect if the stock moves higher it will do it gradually. However, JAH does have good upside momentum going for it.
The TTD momentum indicator (top of chart) is solidly bullish.
The accumulation - distribution line (bottom of chart) was weak but has now started to turn up.
This year, analysts forecast a 10% increase in JAH's earnings to $3.76 a share from $3.43 a year ago. The stock sells with a price-earnings ratio of 10. TTD sees that as reasonable.
Next year, analysts look for an 11% increase in net to $4.17 a share from the anticipated $3.76 this year.
JAH will show a modest acceleration in quarterly earnings growth.
Net for the first quarter should rise 10% and then 14% in the second quarter. That is very good given the size of the company.
The Street is forecasting first quarter net of 44 cents a share, up from 40 cents a year ago. The highest estimate on the Street is at 47 cents a share. TTD sees chances for an upside earnings surprise. The prior two quarters, JAH topped the consensus estimate by 4 cents a share and 8 cents a share.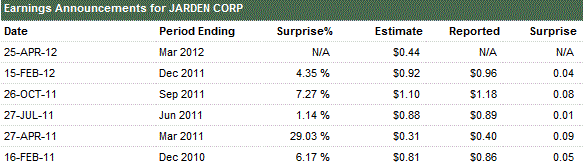
Strategy Opinion: JAH is a conservative play with only modest earnings growth. TTD is targeting the stock for a move to 44 off this breakout. A protective stop can be placed near 35.
TTD rates JAH an average intermediate-term play.
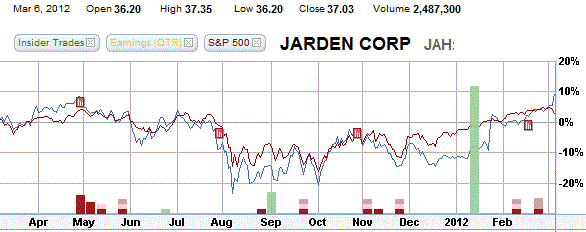
Sponsorship: Excellent. A key fund buyer recently was 4-star rated Fidelity Low-Priced Stock Fund which purchased 1.2 million shares. It has a 1.7% stake. The largest fundholder is CREF Fund with a 7% stake. The 4-star rated rated fund was a recent seller of 9,508 shares. JAH has 91.3 million shares outstanding. Institutions hold 96% of the stock.
Insider Activity: Bearish. Insiders were recent buyers at $21 using stock options. They were sellers around $34. Currently, 6 analysts follow the stock, 4 have a buy, down from 6 three months ago.
Stock Performance Chart with Quarterly Earnings Markers
Insider Activity - Buying in Green - Selling in Red
| TTD's Breakout Profile
Rating Jarden Corp. (JAH) |
| TTD Check List | Bullish | Bearish | Neutral |
| Near 52-week High | YES | ||
| Volume | YES | ||
| Tick Volume | YES | ||
| Price Trend - Daily | YES | ||
| Price Trend - Long Term | YES | ||
| Price Daily Spread | YES | ||
| Base Structure | YES | ||
| Base - A-D | YES | ||
| Earnings-Quarterly | YES | ||
| Earnings-Long Term | YES | ||
| Earnings Outlook | YES | ||
| Industry Group | YES | ||
| Prior Breakout Success | YES | ||
| Fund Sponsorship | YES | ||
| Total Score | 10 | 0 | 4 |
Charts of Selected Breakout Stocks
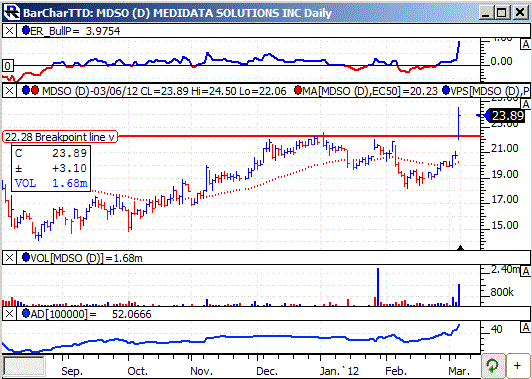
| TTD's Quality Rating of Stock - MDSO - AVERAGE |
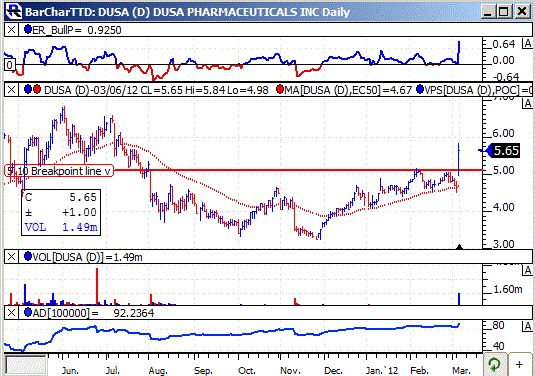
| TTD's Quality Rating of Stock - DUSA - AVERAGE |

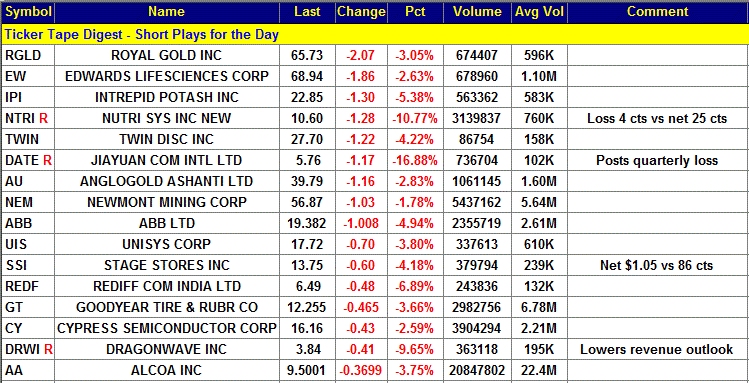
Ticker Tape Digest’s Daily List of “Stocks To Sell or Sell Short” ranks stocks well timed to be sold immediately based on daily trading. The list can be used as an alert to reduce current long-term positions.
Shorts from tape action so far today - 16
Stocks Screened - 8,300
Long-Term Environment for bears: Unfavorable.
Bear Side - Large number of short plays today as stock market declines sharply in the morning. Bears be selective. TTD's short from Monday was Peabody Energy Corp. (BTU) at 31.37. Today, the stock has declined to $30.69 and is working well for bears.
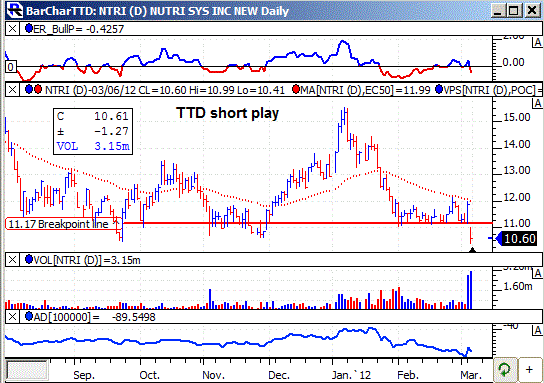
NTRI, based near Philadelphia, produces weight management systems. Annual revenues $422 million. NTRI's stock gaps lower in heavy trading today to undercut its key support. The stock sets off a technical short as the company reports a loss for the fourth quarter. So far today, NTRI is trading a heavy 3.3 million shares, four times its normal daily volume of 760,000 shares. 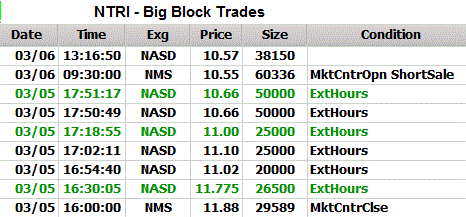
TTD highlighted NTRI as a short at our midsession video show on the Web.
Today, NTRI reported a loss for the fourth quarter of 4 cents a share compared with a profit of 25 cents a year ago. The Street was looking for a loss of 3 cents a share. So, the loss was greater than expected.
The stock fell sharply on the news. It hit an intraday low of $10.41. The stock lifted late in the morning to trim some of its loss. It then trended sideways.
The tape action shows the recent big block trades. One can see the price for the blocks declining from $11.88 to $10.55. A key bearish trade came when a block of 20,000 shares crossed late on Monday at $11.02. That was down sharply from the prior block at $26,5000. The tape action showed heavy institutional selling.
NTRI is a provider of a weight management system based on a low-calorie, portion-controlled, prepared meal program.
The Company’s customers purchase monthly food packages containing a 28-day supply of breakfasts, lunches, dinners and desserts, which they supplement with dairy, fruit, salad, vegetables and low-glycemic carbohydrate items. The customers order on an auto-delivery basis in which the company send a month’s food supply on an ongoing basis until notified by the customer to stop its shipments.
This year, analysts are forecasting a 103% jump in net to 88 cents a share from 43 cents a year ago. That estimate may come down.
NTRI's chart shows the breakdown today on heavy volume. The move reverses a sharp rise the day before. That may have trapped some bargain hunting bulls. The stock's TTD momentum indicator has now turned bearish. The stock's accumulation - distribution line is trending lower showing clear selling pressure.
Strategy Opinion: TTD is targeting NTRI for a decline to 8 within the next few months, or sooner. A protective stop buy can be placed near 11.40. TTD sees NTRI as a trading short.
| TTD's Quality Rating of Stock - NTRI - BELOW AVERAGE |
TTD columnist Leo Fasciocco has covered the stock market for over 20 years. His articles appear in many publications. He is also a speaker at the Intershow conferences. He has been on television and radio. He is author of many educational articles about stock investing and the book “Guide To High-Performance Investing.”

For information to subscribe to the Ticker Tape Digest Services call: B. J. Owen at 1-480-926-1680. Distributed by Corona Publishing Enterprises. Ticker Tape Digest Inc. P.O. Box 2044 Chandler, Az. 85244-2044. TTD “Professional Report” is available on the World Wide Web: $100 per month. Password needed. “TTD Professional“ Faxed is $200 per month. The TTD Daily Report is $39.95. Credit cards accepted.
(The information contained has been prepared from data deemed reliable but there is no guarantee of complete accuracy. Ticker Tape Digest Inc. is not affiliated with any broker, dealer or investment advisor. Nothing in this publication constitutes an offer, recommendation or solicitation to buy or sell any securities. Further research is advised. This report is copyrighted and no redistribution is permitted with out permission.)