![]()
|
|
|
Weekly - Bullish Conservative Investors - Go To TTD Long-Term Plays - Monday, March 5, 2018 |
|
|
Go to Video Show - "How to Make Money With Breakout Stocks |
|---|

By Leo Fasciocco -- TTD
Ticker Tape Digest presents its daily stock market report containing stocks to go long as Breakout Trades, Quick Trades, or Bargain Accumulation Trades.
We also feature stocks under Significant Accumulation that are poised to breakout.
|
Ticker Tape Digest's Daily schedule guide for TTD subscribers 1. Pre-market - check Breakout Watch List and Quick Trades. 2. Morning - (11:30 - 12 A.M.) - check breakout stocks tape and breakout chart slide show. 3. Midday (1 P.M.) check TTD Midsession Report and see market video show. 4. After close (4 P.M.) check final TTD Report for day. Trading Strategies Bullish Aggressive Investors Bullish - "Breakout Stocks" - ideally suited for bull markets and special situation stocks. Potential for large returns. (See Performance) Aggressive Investor Bullish- "Quick Trade Stocks" -ideally suited for entry into top performing issues looking for a small quick profit." (See Performance) Conservative Investors "Bargain Buy Trades for the Long Term." Ideally suited for entry into top performing big cap stocks on pullbacks within overall up trend.(See Performance) Bearish Aggressive Bearish Investors - "Breakdown Stocks" to Sell Short. Ideally suited for bear markets or market pull backs. Potential for large returns (See Performance) |
|---|
The TTD report also contains stocks to short as breakdown plays and as bargain (swing trade) shorts.
Investors should tend to try to go with a strategy that fits with the stock market's trend, unless there is a special situation play.
TTD's Breakout Stocks - Long are
most suitable for aggressive investors seeking ideal entry points into leading stocks, especially during bull markets. They can do extremely well in bull markets with gains of as much as several hundred percent. 
These stocks can also do extremely well during strong market rallies, or if they are in a industry group that is performing very well. They tend to have strong earnings outlooks and are near new-52 week, or all-time highs.
TTD Quick Trade Stocks - Long These are leading issues that have pulled back in recent days, but could move higher soon. They are most suitable for Aggressive Investors willing to trade short term. These stocks will do extremely well during market advances. They have about 74% win rate. During market rally sequences the win rate is even higher. The return is small 3% to 8% in just a few days.
TTD's Bargain Buy Trades - Long - Long Term. These are for conservative bullish Investors These long-term buys are ideally suited for entry into stocks on pull backs within overall up trend. These stocks can give a good return long-term especially during a bull market.
TTD also presents Stocks To Sell or Sell Short. These issues are suitable for aggressive investors willing to take short positions both as trades or for longer-term plays. These stocks will do very well during bear markets or market pull backs.
TTD's Bearish breakdown stocks to sell short. These issues have potential to fall sharply. They often show a technical breakdown and also some fundamental business problem such as weak earnings.
TTD's multi-media updates include a slide-show that presents charts and analysis at midsession. Some times TTD presents feature analysis on stocks and the market. TTD uses Windows Media Files. (WMV).
TTD also presents a "Breakout Watch List" that is up dated daily. This list consists of key stocks in position to breakout. A close watch of this list can put you in the stock just as it breaks out. A good idea is to study the list and be ready to move into a stock quickly as it hits its breakpoint.
TTD often suggests using stop buy orders to enter. It is very important to buy a breakout stock as close as possible to the breakpoint. The idea is to get "elbow room" if the stock should follow through to the upside. This is very important in being successful in making big money with breakout stocks.
It is also essential to have a stop loss strategy for all stocks in which positions are taken. Not every stock will work as expected. It is important for investors to "police" their portfolios and avoid getting trapped in any bad positions.
Quality rating of breakout Two key factors: 1 - Stock near all-time high in price or near a 52-week high. 2 - earnings growth current year is strong. The ideal play is a stock with an Above Average Quality Rating. The stock is near a new high and will have strong earnings. TTD's other ratings are Average and Below Average.
TTD also has special feature sections on Educational Tips on Investing.
To email Mr. Leo Fasciocco leo@tickertapedigest.com.
For service, email Beverly Owen owen@tickertapedigest.com. TTD’s Tel: 1-480-926-1680.
Tuesday - March 6, 2018
TTD's Breakout Stocks
Stock Market Overview
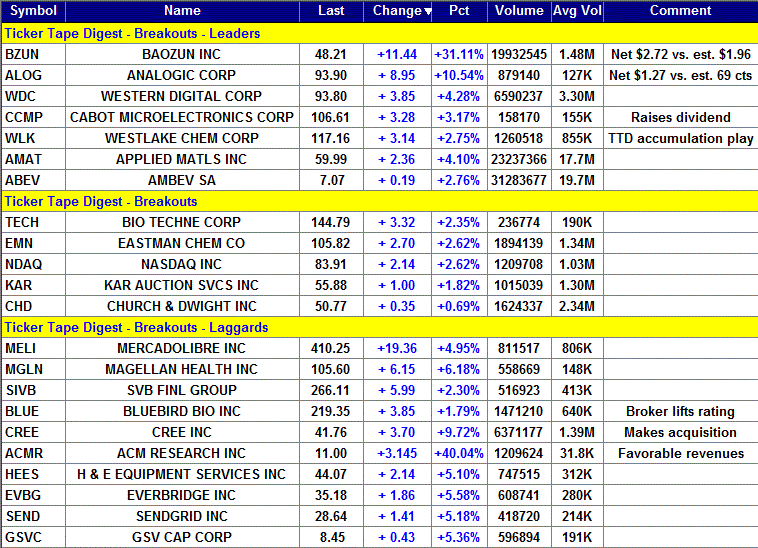
Total Buy Breakouts so far today - 22
Quality of Breakouts - Above Average.
Stocks Screened - 12,234
Bull side - Large list of breakouts with some good looking plays. Bulls can be venturesome.
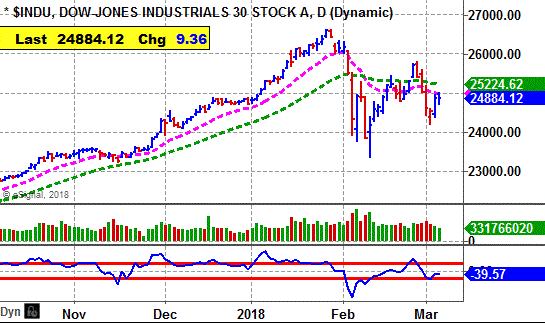
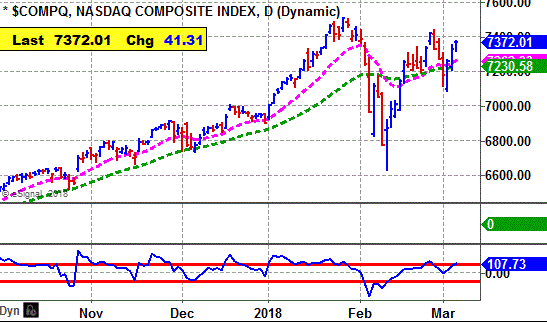
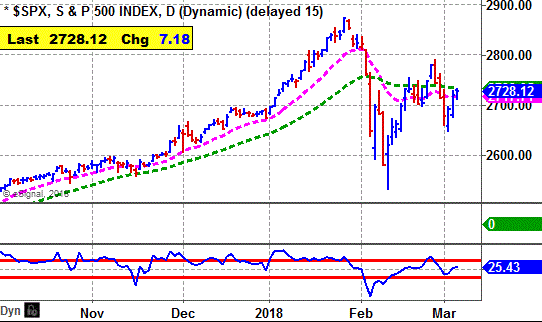
Stock market - All market averages are bullish in all time sectors - except for the daily Dow Industrials.
The technical pattern of the market is a trading range. So, one needs to be watchful of all positions.
Stock Market Momentum
(Daily is based on a moving average)
|
Market (Daily) |
Market (Weekly) |
Market (Monthly) |
|
Dow - Bearish |
Dow - Bullish |
Dow - Bullish, |
|
Nasdaq - Bullish |
Nasdaq - Bullish |
Nasdaq - Bullish |
|
S&P 500 - Bullish |
S&P 500 - Bullish |
S&P 500 - Bullish |
Ticker Tape Digest's
|
TTD's Quality Rating of Stock - CCMP - ABOVE AVERAGE |
CCMP, based in Aurora, Il., supplies polishing slurries and pads used to make integrated circuit devices for the semiconductor industry. CCMP's stock moves higher Tuesday and breaks out from a seven-week flat base. 
The base is a base on top of a base. The move carries the stock to a new all-time high.
So far today, CCMP is trading 158,170 shares. Its average daily volume is 155,000 shares.
CCMP's stock moved slightly higher in the morning and then trended sideways until the early afternoon.
In the afternoon, the stock pushed higher to clear its breakpoint line easily. 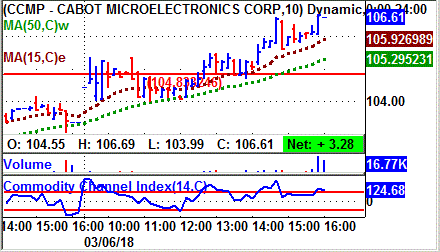 The stock closed near its high for the day.
That is bullish.
Tape Action
CCMP''s tape action shows the recent block trades.
One can see the price for the blocks climbing from $103.33 in the prior session to as high as $106.61 Tuesday.
A key bullish trade came in the morning when a block of 2,136 shares (duplicated) crossed the tape at $104.55.
That was up from the prior block trade at $103.33 on 1,946 shares.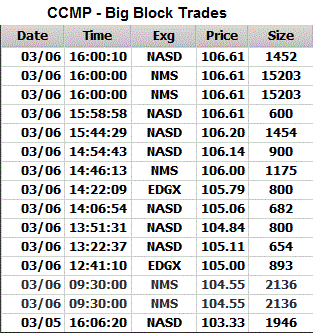
Near the close a block of 15,203 shares (duplicated) crossed the tape at $106.61.
That was in a big block sequence that showed a rise in price.
Business
CCMP makes its electronics products using a process called chemical mechanical planarization.
The company sells CMP slurries for polishing conducting and insulating materials used in IC devices and also for polishing the disk substrates and magnetic heads used in hard disk drives.
It also makes CMP polishing pads used in conjunction with slurries in the CMP process.
Charts
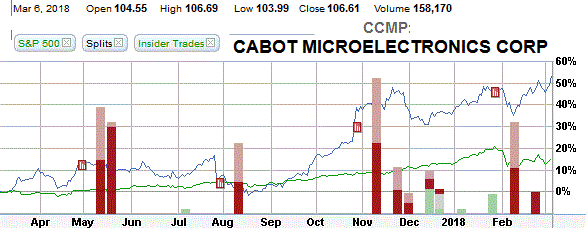
CCMP's 12-month performance chart shows the stock appreciating 54% versus a 15% gain for the stock market.
Insiders were recent buyers using stock options at $27 to $44 a share. They were sellers at $91 to $102 a share.
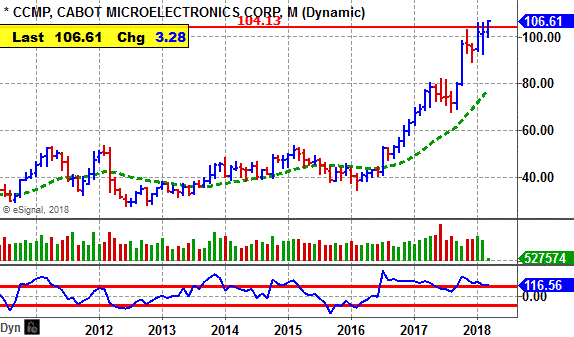
CCMP's long-term chart shows the stock making a bottom at $27.69 in 2012. The stock then worked to a peak of $53.37 by early 2015.
CCMP then pulled back to $34.53 by early 2016. Since then it has surged sharply higher tripling from its recent low in 2016. 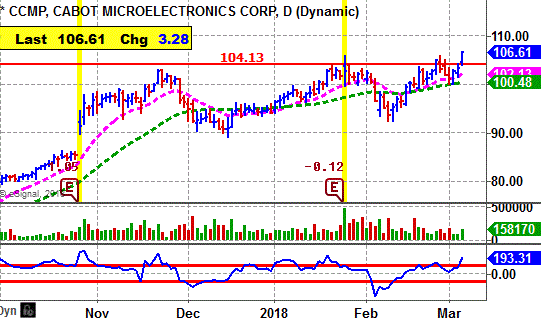
CCMP's daily chart shows the stock climbing from $80 back in October to a peak near $104 by January.
The stock then put down a cup-and-handle base.
The breakout looks solid coming with expanding volume and a widening of the daily spread.
CCMP's CCI momentum indicator (bottom of chart) is strongly bullish.
Earnings Outlook
This fiscal year ending in September analysts are forecasting a 32% surge in net to $4.71 a share from $3.56 the year before.
The stock sells with a price-earnings ratio of 21. TTD sees that as attractive for value-growth investors.
Looking out to fiscal 2019 ending in September, the Street predicts a 15% rise in net to $5.43 a share from the anticipated $4.71 for fiscal 2018.
Quarterly earnings will be strong showing a modest acceleration in growth. That is bullish.
Net for the fiscal second quarter ending in March is expected to jump 38% to $1.05 a share from 76 cents the year before.
TTD sees good chances for an upside earnings surprise. The company topped the consensus estimate by 17 cents a share and 20 cents in the prior two quarters.
Going out to the fiscal third quarter ending in June, the Street predicts a 43% surge in net to $1.16 a share from 81 cents the year before.
Strategy Opinion: TTD is targeting CCMP for a move to $130 off this breakout. A protective stop can be placed near $98 after a breakout.
TTD rates CCMP a good intermediate-term play.
Suitability: Average Bulls.
TTD's special research of Stock's Prior Performance:
Probability - Breakout Success - Bullish. CCMP has scored strong gains off recent breakouts. The stock is in a long-term up trend.
Probability - Earnings Response - Bullish. CCMP rose 9 times after 12 earnings reports when there was a significant change in price.
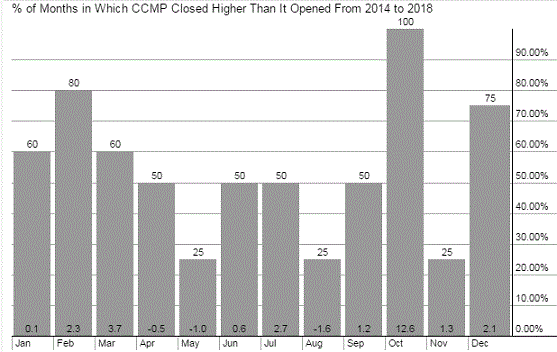
Probability: Seasonal Success - Slightly Bullish. CCMP has averaged a gain of 3.7% in March but a decline of 0.5% in April the past several years.
Stock's Prior Performance After A Breakout
|
Stock's % Change from Breakout to peak - prior to cut below 50-day M/A. |
Date of Breakout |
Break point Price |
Stocks Price Peak after Breakout - prior to cut below 50-day M/A |
Date Trade Closed |
|
28% |
10/2/2017 | 79.86 | 102.73 | 11/21/2017 |
|
9% |
3/15/2017 | 69.83 | 76.61 | 3/31/2017 |
|
40% |
10/27/2016 | 54.46 | 76.61 | 3/31/2017 |
| 18% | 7/7/2016 | 44.26 | 52.62 | 7/29/2016 |
(In actual trading, entry and exit points could vary depending on broker execution.
Also, ideal are breakouts to a new 52-week high or better, perhaps all-time highs.)
Stock's Long-term Chart
Stock's Performance Chart with Quarterly Earnings Markers vs. S&P 500
Insider Buying in Green - Insider Selling in Red
Stock's Monthly Seasonal Performance Chart - Past 5 Years
Showing % Months UP and % Change
| TTD's Breakout Profile Rating Cabot Microelectronics Corp. (CCMP) |
| TTD Check List | Bullish | Bearish | Neutral |
| Near 52-week High | YES | ||
| Volume | YES | ||
| Tick Volume | YES | ||
| Price Trend - Daily | YES | ||
| Price Trend - Long Term | YES | ||
| Price Daily Spread | YES | ||
| Base Structure | YES | ||
| Base - A-D | YES | ||
| Earnings-Quarterly | YES | ||
| Earnings-Long Term | YES | ||
| Earnings Outlook | YES | ||
| Industry Group | YES | ||
| Prior Breakout Success | YES | ||
| Fund Sponsorship | YES | ||
| Total Score | 14 | 0 | 0 |
Charts of Selected Breakout Stocks
|
TTD's Quality Rating of Stock - BZUN - ABOVE AVERAGE |
|
TTD's Quality Rating of Stock - ALOG - ABOVE AVERAGE |
|
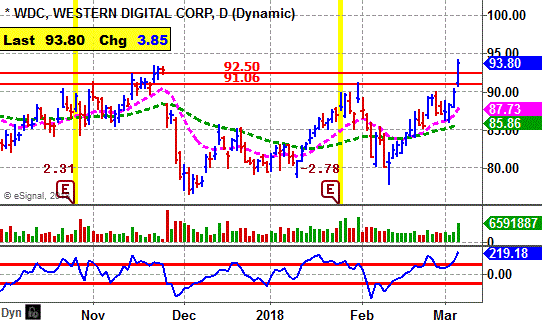
TTD's Quality Rating of Stock - WDC - ABOVE AVERAGE |
|
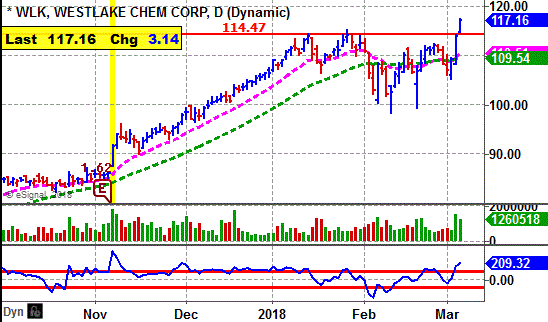
TTD's Quality Rating of Stock - WLK - ABOVE AVERAGE |

Ticker Tape Digest’s Daily List of “Stocks To Sell or Sell Short” ranks stocks well timed to be sold immediately based on daily trading. The list can be used as an alert to reduce current long-term positions.
Shorts from tape action so far today - 2
Stocks Screened - 12,234
Long-Term Environment for bears: Neutral.
Bear Side - Only a few breakdown stocks. Bears be conservative. Stock market in a trading range.
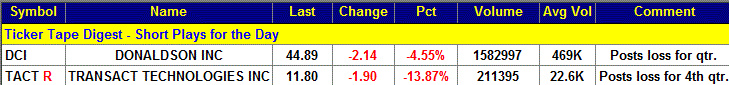
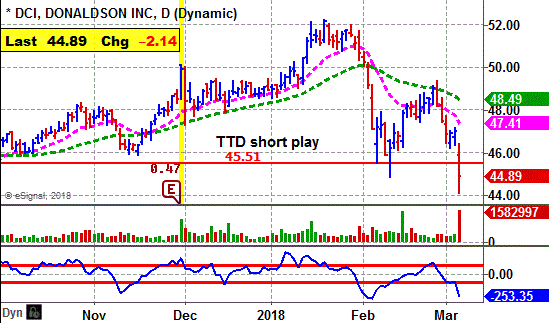
DCI, based in Minneapolis, Min., makes filtration systems and replacement parts. Annual revenues: $2.4 billion. DCI's stock falls sharply Tuesday after reporting a loss for the fiscal second quarter ending in December. TTD sees more on the downside. 
So far today, DCI is trading a heavy 1.6 million shares, triple its average daily volume of 469,000 shares.
TTD highlighted DCI as a short at our midsession video show on the Web Tuesday.
The company reported a loss for the fiscal second quarter of 40 cents a share. The loss was less than expected. The Street was expecting a loss of 44 cents a share. Nevertheless the stock fell. 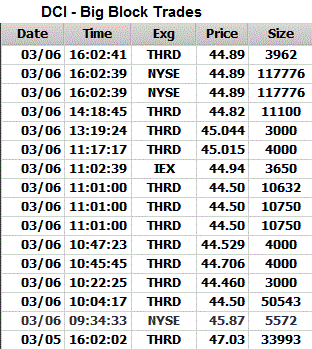
Tape Action
DCI's tape action shows the recent block trades.
One can see the price for the blocks falling from $47.03 in the prior session to as low as $44.46.
A key bearish trade came in the morning when a block of 50,543 shares crossed the tape at $44.50.
That was down from the prior block at $45.87 on 5,572 shares.
There was some buying near the close when a block of 117,776 shares (duplicated) crossed the tape at $44.89.
That came on an up tick from the prior trade at $44.52 on 193 shares.
Business
DCI makes filtration engine products and industrial products. It has 44 plants around the world and through three joint ventures.
The Company offers its products under the Ultra-Web, PowerCore and Donaldson brands.
The engine products unit sells to OEMs in the construction, mining, agriculture, aerospace, defense and truck end-markets.
Earnings:
This fiscal year ending in July, analysts have been forecasting an 18% increase in net to $2 a share from $1.69 the year before.
Net for the upcoming fiscal second quarter ending in April analysts are forecasting a 22% rise in net to 55 cents a share from 45 cents the year before.
Charts:
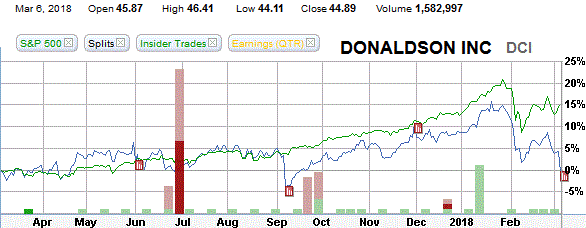
DCI's 12-month performance chart shows the stock with a flat performance versus a 15% gain for the stock market.
Insider activity has been subdued. There was one insider buy at $15 using stock options and then the insider turned around and sold at $48.
DCI's daily chart shows the stock cutting below key support with a big pickup in volume. The stock peaked at $52 earlier in the year and is now rending lower.
Strategy Opinion: TTD is targeting DCI for a decline to $37 within the next few months, or sooner. A protective stop buy can be placed near $47.20.
Suitability: Average Bears.
TTD's special probability research of Prior Performance:
Probability - Earnings Response - Extremely Bearish. DCI rose just 6 times after the past 15 earnings reports when there was a significant change.
Probability: Seasonal Activity - Bullish. DCI rose an average of 2.6% in March and 0.6% in April the past several years.
|
TTD's Quality Rating of Stock - DCI - BELOW AVERAGE |
Stock Performance Chart with Quarterly Earnings Markers vs. S&P 500
Insider Buying in Green - Insider Selling in Red
TTD columnist Leo Fasciocco has covered the stock market for over 30 years. His articles appear in many publications. He has also been a speaker at the Money Show conferences. He has been on television and radio. He is author of many educational articles about stock investing and the book “Guide To High-Performance Investing.”

For information to subscribe to the Ticker Tape Digest Services call: Beverly Owen at 1-480-926-1680.
Distributed by Corona Publishing Enterprises. TickerTape Digest Inc. 1220 W. Sherri, Gilbert, Az. 85233.
TTD “Professional Report” is available on the Web: $100 per month. Password needed. Published daily - around 20 times a month.
TTD Pro Report includes a Morning chart slide show of breakout stocks, a Midsession video-audio show with commentary on breakout stocks and shorts and a Final end of day overall report on breakout stocks for the session, short plays and accumulation plays. There are other features too such as Quick Trades and Long-term Plays.
TTD Daily Report is $39. It covers a Morning slide show of charts of stocks breaking out and a TTD end of day print report covering breakout stocks and shorts.
Credit cards accepted. Payable to Corona Publishing Enterprises.
(The information contained has been prepared from data deemed reliable but there is no guarantee of complete accuracy. Ticker Tape Digest Inc. is not affiliated with any broker, dealer or investment advisor. Nothing in this publication constitutes an offer, recommendation or solicitation to buy or sell any securities. Further research is advised. This report is copyrighted and no redistribution is permitted with out permission.)