Daily - Go to TTD's Chart scroller of Breakout Stocks - Tuesday, March 7, 2017
|
Daily - Go to TTD's Chart scroller of Breakout Stocks - Tuesday, March 7, 2017 |
|
Weekly - Bullish Conservative Investors - Go To TTD Long-Term Plays - Monday, March 6, 2017 |
|
|
Go to Video Show - "How to Make Money With Breakout Stocks |
|---|

By Leo Fasciocco -- TTD
Ticker Tape Digest presents its daily stock market report containing stocks to go long as breakout trades, quick trades, or bargain trades. We also feature stocks under Significant Accumulation that are poised to breakout.
|
Ticker Tape Digest's Daily schedule guide for TTD subscribers 1. Pre-market - check Breakout Watch List and Quick Trades. 2. Morning - (11:30 - 12 A.M.) - check breakout stocks tape and breakout chart slide show. 3. Midday (1 P.M.) check TTD Midsession Report and see market video show. 4. After close (4 P.M.) check final TTD Report for day. Trading Strategies Bullish Aggressive Investors Bullish - "Breakout Stocks" - ideally suited for bull markets and special situation stocks. Potential for large returns. (See Performance) Aggressive Investor Bullish- "Quick Trade Stocks" -ideally suited for entry into top performing issues looking for a small quick profit." (See Performance) Conservative Investors "Bargain Buy Trades for the Long Term." Ideally suited for entry into top performing big cap stocks on pullbacks within overall up trend.(See Performance) Bearish Aggressive Bearish Investors - "Breakdown Stocks" to Sell Short. Ideally suited for bear markets or market pull backs. Potential for large returns (See Performance) |
|---|
The TTD report also contains stocks to short as breakdown plays and as bargain (swing trade) shorts.
Investors should tend to try to go with a strategy that fits with the stock market's trend, unless there is a special situation play.
TTD's Breakout Stocks - Long are
most suitable for aggressive investors seeking ideal entry points into leading stocks, especially during bull markets. They can do extremely well in bull markets with gains of as much as several hundred percent. 
These stocks can also do extremely well during strong market rallies, or if they are in a industry group that is performing very well. They tend to have strong earnings outlooks and are near new-52 week, or all-time highs.
TTD Quick Trade Stocks - Long These are leading issues that have pulled back in recent days, but could move higher soon. They are most suitable for Aggressive Investors willing to trade short term. These stocks will do extremely well during market advances. They have about 74% win rate. During market rally sequences the win rate is even higher. The return is small 3% to 8% in just a few days.
TTD's Bargain Buy Trades - Long - Long Term. These are for conservative bullish Investors These long-term buys are ideally suited for entry into stocks on pull backs within overall up trend. These stocks can give a good return long-term especially during a bull market.
TTD also presents Stocks To Sell or Sell Short. These issues are suitable for aggressive investors willing to take short positions both as trades or for longer-term plays. These stocks will do very well during bear markets or market pull backs.
TTD's Bearish breakdown stocks to sell short. These issues have potential to fall sharply. They often show a technical breakdown and also some fundamental business problem such as weak earnings.
TTD's multi-media updates include a slide-show that presents charts and analysis at midsession. Some times TTD presents feature analysis on stocks and the market. TTD uses Windows Media Files. (WMV).
TTD also presents a "Breakout Watch List" that is up dated daily. This list consists of key stocks in position to breakout. A close watch of this list can put you in the stock just as it breaks out. A good idea is to study the list and be ready to move into a stock quickly as it hits its breakpoint.
TTD often suggests using stop buy orders to enter. It is very important to buy a breakout stock as close as possible to the breakpoint. The idea is to get "elbow room" if the stock should follow through to the upside. This is very important in being successful in making big money with breakout stocks.
It is also essential to have a stop loss strategy for all stocks in which positions are taken. Not every stock will work as expected. It is important for investors to "police" their portfolios and avoid getting trapped in any bad positions.
Quality rating of breakout Two key factors: 1 - Stock near all-time high in price or near a 52-week high. 2 - earnings growth current year is strong. The ideal play is a stock with an Above Average Quality Rating. The stock is near a new high and will have strong earnings. TTD's other ratings are Average and Below Average.
TTD also has special feature sections on Educational Tips on Investing.
To email Mr. Leo Fasciocco leo@tickertapedigest.com. For service, email Beverly Owen owen@tickertapedigest.com. TTD’s Tel: 1-480-926-1680.
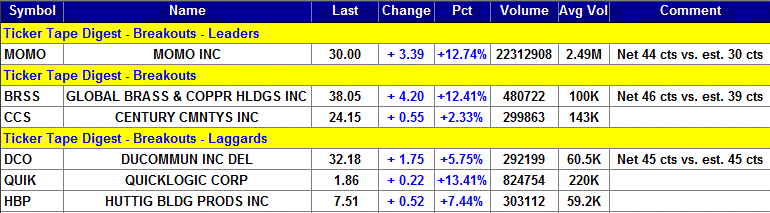
Breakout Stocks
Total Buy Breakouts so far today - 61
Quality of Breakouts - AVERAGE
Stocks Screened - 8,300
Bull side - Breakout list small and very selective. Stock market holds in up trend, but has lost momentum. Look for a basing period.
(Put mouse on chart to Nasdaq)
Environment for bulls: Neutral
Stock Market Momentum
Market (Daily) - NYSE Bearish, Nasdaq Bearish
Market (Weekly) - NYSE Bullish, Nasdaq Bearish
Market (Monthly) - NYSE Bullish, Nasdaq Bullish
Ticker Tape Digest's
|
TTD's Quality Rating of Stock - MOMO - ABOVE AVERAGE |
MOMO, based in China, provides a mobile-based social networking platform. Annual revenues: $346 million. MOMO reports strong than expected quarterly earning and the stock responds by driving higher and breaking out. 
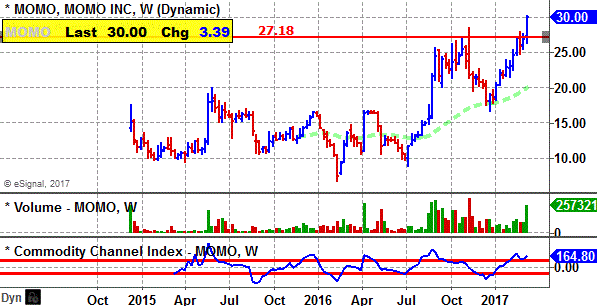
The push carries the stock through the top of its 20-week, cup-and-handle base.
The stock a recent new issue from 2015 hits a new all-time high. That is very bullish.
TTD highlighted MOMO as a breakout at our midsession video show on the Web Tuesday.
So far today, MOMO is trading a heavy 22.3 million shares, about 10-times its average daily volume of 2.5 million shares.
MOMO came in with fourth quarter earnings of 44 cents a share. That topped the Street estimate of 30 cents a share.
 MOMO's 10-minute chart shows the stock pushing higher in the morning and clearing its breakpoint line.
The stock rose to a peak of $30.22 in the morning, its high for the day.
The stock then backed off slightly and trended sideways the rest of the day.
Late in the day, it managed to lift and close near its high for the session.
Tape Action
MOMO's tape action shows the recent block trades.
One can see the price for the blocks climbing from $26.79 in the prior session to as high as $30.
A key bullish trade came in the morning when a massive block of 175,348 shares (duplicated) crossed the tape at $29.48.
 That was up from the prior block trade at $26.79 on 58,100 shares.
Business
MOMO operates a mobile-based social networking platform.
The platform includes its Momo mobile application and a range of related features, functionalities, tools and services that it provides to users, customers and platform partners.
The company's users can maintain their relationships through its private and group communication tools, content creation and sharing functions, as well as the offline social activities promoted on its platform.
It also offers live music and entertainment broadcasts on its Momo platform.
The Momo makes its money via ads and funds from certain services.
Charts
MOMO's 12-month performance chart shows the stock appreciating a sensational 120% versus a 19% gain for the stock market.
MOMO is one of the strongest stocks in the market.
MOMO's long-term chart shows the stock coming public in January of 2015 at $12. The stock rose quickly to $19.89 in a few months. However, it fell back in early 2016 to its all-time low of $6.72.
The stock then turned and has since rallied strongly and has made a new all-time high. That is bullish.

MOM's daily chart shows the stock peaking in late October and then going into a sharp pull back.
The stock then circled around and completed a "long-term type cup-and-handle base.
The gap breakout is impressive and comes with big volume and favorable earnings.
The CCI momentum indicator (bottom of chart) is strongly bullish.
Earnings Outlook
This year, analysts are forecasting a 40% increase in net to $1.12 a share from the 80 cents a share in 2016.
However, the $1.12 estimate could easily be lifted by analysts after the big beat in the fourth quarter.
Net for the first quarter is expected to skyrocket 1,000% to 30 cents a share from 3 cents a year ago.
That is impressive.
MOMO tends to come in close to Street estimates. However, the beat in the fourth quarter was impressive.
Strategy Opinion: TTD is targeting MOMO for a move to $37 off this breakout. A protective stop can be placed near $26.50 giving it room.
TTD rates MOMO a good intermediate-term play provided earnings meet or top expectations.
Suitability: Aggressive Bulls.
TTD's special research of MOMO's Prior Performance after a Breakout:
TTD's research shows that recently (see table) MOMO has scored some sensational gains after a breakout. The stock is a bit extended now but could still move significantly higher. It is most suitable now for an aggressive investor.
The stock has moved higher 4 out of 8 past 11 earnings reports with other showing not much change.
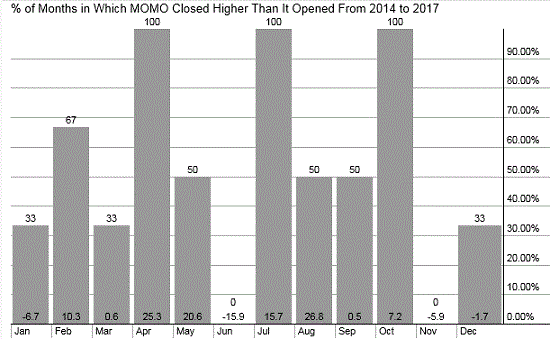
The seasonal chart shows MOMO moving toward April which is one of its strongest months.
Stock's Prior Performance After A Breakout
|
Stock's % Change from Breakout to peak - prior to cut below 50-day M/A. |
Date of Breakout |
Break point Price |
Stocks Price Peak after Breakout - prior to cut below 50-day M/A |
Date Trade Closed |
|
4% |
10/24/2016 | 25.69 | 26.88 | 10/24/2016 |
|
96% |
8/02/2016 | 13.57 | 26.61 | 10/24/2016 |
|
14% |
12/7/2015 | 14.44 | 16.49 | 12/24/2015 |
|
51% |
5/18/2015 |
12.63 |
19.11 |
5/27/2015 |
(In actual trading, entry and exit points could vary depending on broker execution.
Also, ideal are breakouts to a new 52-week high or better, perhaps all-time highs.)
Stock's Long-term Chart
Stock's Performance Chart with Quarterly Earnings Markers vs. S&P 500
Insider Buying in Green - Insider Selling in Red

Stock's Monthly Seasonal Performance Chart - Past 5 Years
Showing % Months UP and % Change
Charts of Selected Breakout Stocks
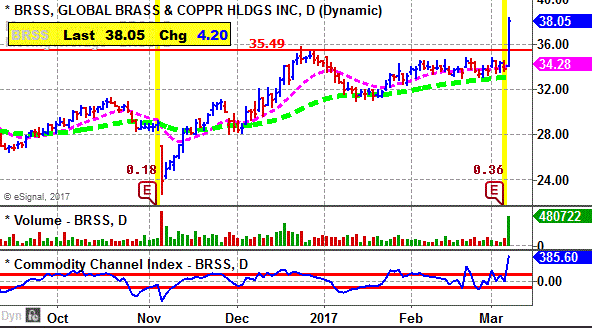
| TTD's Quality Rating of Stock - BRSS - AVERAGE |
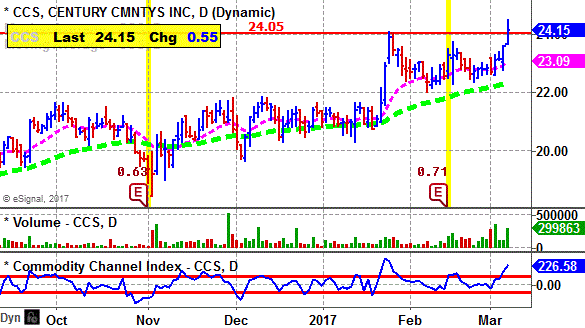
| TTD's Quality Rating of Stock - CCS - AVERAGE |
| TTD's Quality Rating of Stock - DCO - BELOW AVERAGE |

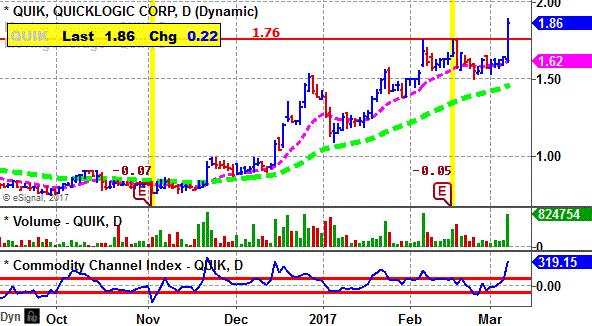
| TTD's Quality Rating of Stock - QUIK - BELOW AVERAGE |

Ticker Tape Digest’s Daily List of “Stocks To Sell or Sell Short” ranks stocks well timed to be sold immediately based on daily trading. The list can be used as an alert to reduce current long-term positions.
Shorts from tape action so far today - 8
Stocks Screened - 8,300
Long-Term Environment for bears: Unfavorable.
Bear Side - Small lit of breakdown stocks, but some interesting plays. Stock market appears ready to try and consolidate recent run up. Aggressive bears can be venturesome.
TTD's short from Monday was Gopro (GPR) at $8.14. Tuesday, it closed at $7.93 and is working well for bears.
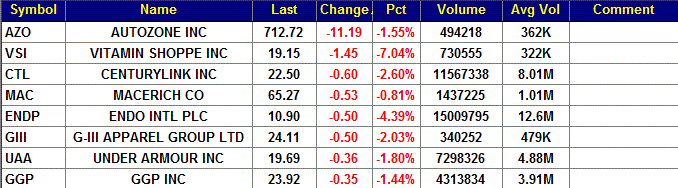
VSI, based in Secaucus, N.J., is a retailer and contract maker of vitamins, minerals, herbs, specialty supplements and sports nutrition products. VSI's stock falls sharply Tuesday and undercuts key technical support. TTD sees more on the downside. 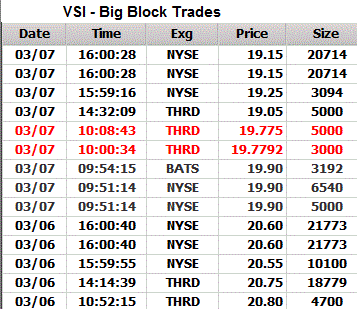
TTD highlighted VSI as a short at our midsession video show on the Web Tuesday.
So far today, VSI is trading a heavy 730,555 shares, double its average daily volume of 322,000 shares.
VSI's stock fell sharply in the morning and continued south into late in the session. It touched an intraday low of $19.
The stock lifted slightly in the final hour.
Tape Action
VSI showed heavy institutional selling late on Monday.
A block of 18,779 shares crossed Monday at $20.75.
That was down from the prior block at $20.80 on 4,700 shares.
Then on Tuesday morning a block of 5,000 shares crossed the tape at $19.90.
That was down sharply from the prior block at $20.60 on 21,773 shares.
Business
VSI operates through three segments: 1. retail, which includes Vitamin Shoppe, Super Supplements and Vitapath retail store formats, 2. direct, which sells its products directly to consumers through the Internet, primarily at www.vitaminshoppe.com, and 3. manufacturing, which makes private labeling of vitamin, mineral and supplement.
The Company has about 800 brands, as well as its own brands. It operates 760 stores in 40 states and Canada.
Earnings
This year, VSI's earnings are expected to decline 3% to $2.04 a share from $2.09 a year ago.
Most importantly net for the upcoming first quarter should drop 9% to 61 cents a share from 67 cents the year before. The company missed Street estimates the past two out of three quarters.
For the second quarter, net is expected to be down 11% to 49 cents a share from 55 cents the year before.
Charts
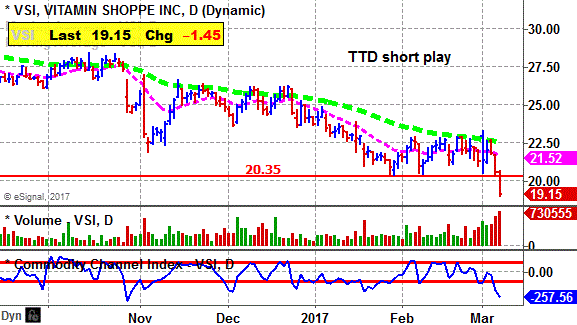
VSI's daily chart shows the stock cutting below key support with expanding volume. The CCI momentum indicator is extremely bearish.
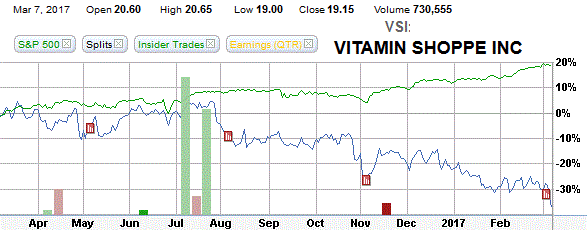
VSI's 12-month performance chart shows the stock down 35% versus a 19% gain for the stock market.
Insides have been getting options. Last year, they were priced at $30 a share. So, they are now worthless unless the stock rises.
Strategy Opinion: TTD is targeting VSI for a decline to $15 within the next few months, or sooner. A protective stop buy can be placed near $20.30.
Suitability: Aggressive Bears.
| TTD's Quality Rating of Stock - VSI - BELOW AVERAGE |
Stock Performance Chart with Quarterly Earnings Markers vs. S&P 500
Insider Buying in Green - Insider Selling in Red
TTD columnist Leo Fasciocco has covered the stock market for over 30 years. His articles appear in many publications. He is also a speaker at the Intershow conferences. He has been on television and radio. He is author of many educational articles about stock investing and the book “Guide To High-Performance Investing.”

For information to subscribe to the Ticker Tape Digest Services call: Beverly Owen at 1-480-926-1680. Distributed by Corona Publishing Enterprises. Ticker Tape Digest Inc. P.O. Box 2044 Chandler, Az. 85244-2044. TTD “Professional Report” is available on the World Wide Web: $100 per month. Password needed. “TTD Professional“ Faxed is $200 per month. The TTD Daily Report is $39.95. Credit cards accepted.
(The information contained has been prepared from data deemed reliable but there is no guarantee of complete accuracy. Ticker Tape Digest Inc. is not affiliated with any broker, dealer or investment advisor. Nothing in this publication constitutes an offer, recommendation or solicitation to buy or sell any securities. Further research is advised. This report is copyrighted and no redistribution is permitted with out permission.)