![]()
|
|
|
Weekly - Bullish Conservative Investors - Go To TTD Long-Term Plays - Monday, March 4, 2019 |
|
|
Go to Video Show - "How to Make Money With Breakout Stocks |
|---|

By Leo Fasciocco -- TTD
Ticker Tape Digest presents its daily stock market report containing stocks to go long as Breakout Trades, Quick Trades, or Bargain Accumulation Trades.
We also feature stocks under Significant Accumulation that are poised to breakout.
|
Ticker Tape Digest's Daily schedule guide for TTD subscribers 1. Pre-market - check Breakout Watch List and Quick Trades. 2. Morning - (11:30 - 12 A.M.) - check breakout stocks tape and breakout chart slide show. 3. Midday (1 P.M.) check TTD Midsession Report and see market video show. 4. After close (4 P.M.) check final TTD Report for day. Trading Strategies Bullish Aggressive Investors Bullish - "Breakout Stocks" - ideally suited for bull markets and special situation stocks. Potential for large returns. (See Performance) Aggressive Investor Bullish- "Quick Trade Stocks" -ideally suited for entry into top performing issues looking for a small quick profit." (See Performance) Conservative Investors "Bargain Buy Trades for the Long Term." Ideally suited for entry into top performing big cap stocks on pullbacks within overall up trend.(See Performance) Bearish Aggressive Bearish Investors - "Breakdown Stocks" to Sell Short. Ideally suited for bear markets or market pull backs. Potential for large returns (See Performance) |
|---|
The TTD report also contains stocks to short as breakdown plays and as bargain (swing trade) shorts.
Investors should tend to try to go with a strategy that fits with the stock market's trend, unless there is a special situation play.
TTD's Breakout Stocks - Long are
most suitable for aggressive investors seeking ideal entry points into leading stocks, especially during bull markets. They can do extremely well in bull markets with gains of as much as several hundred percent. 
These stocks can also do extremely well during strong market rallies, or if they are in a industry group that is performing very well. They tend to have strong earnings outlooks and are near new-52 week, or all-time highs.
TTD Quick Trade Stocks - Long These are leading issues that have pulled back in recent days, but could move higher soon. They are most suitable for Aggressive Investors willing to trade short term. These stocks will do extremely well during market advances. They have about 74% win rate. During market rally sequences the win rate is even higher. The return is small 3% to 8% in just a few days.
TTD's Bargain Buy Trades - Long - Long Term. These are for conservative bullish Investors These long-term buys are ideally suited for entry into stocks on pull backs within overall up trend. These stocks can give a good return long-term especially during a bull market.
TTD also presents Stocks To Sell or Sell Short. These issues are suitable for aggressive investors willing to take short positions both as trades or for longer-term plays. These stocks will do very well during bear markets or market pull backs.
TTD's Bearish breakdown stocks to sell short. These issues have potential to fall sharply. They often show a technical breakdown and also some fundamental business problem such as weak earnings.
TTD's multi-media updates include a slide-show that presents charts and analysis at midsession. Some times TTD presents feature analysis on stocks and the market. TTD uses Windows Media Files. (WMV).
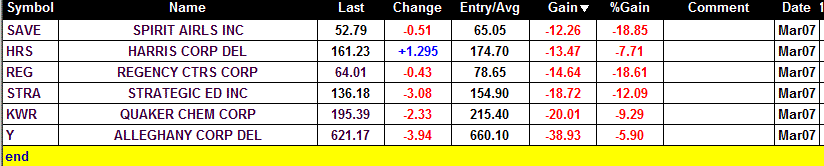
TTD also presents a "Breakout Watch List" that is up dated daily. This list consists of key stocks in position to breakout. A close watch of this list can put you in the stock just as it breaks out. A good idea is to study the list and be ready to move into a stock quickly as it hits its breakpoint.
TTD often suggests using stop buy orders to enter. It is very important to buy a breakout stock as close as possible to the breakpoint. The idea is to get "elbow room" if the stock should follow through to the upside. This is very important in being successful in making big money with breakout stocks.
It is also essential to have a stop loss strategy for all stocks in which positions are taken. Not every stock will work as expected. It is important for investors to "police" their portfolios and avoid getting trapped in any bad positions.
Quality rating of breakout Two key factors: 1 - Stock near all-time high in price or near a 52-week high. 2 - earnings growth current year is strong. The ideal play is a stock with an Above Average Quality Rating. The stock is near a new high and will have strong earnings. TTD's other ratings are Average and Below Average.
TTD also has special feature sections on Educational Tips on Investing.
To email Mr. Leo Fasciocco leo@tickertapedigest.com.
For service, email Beverly Owen owen@tickertapedigest.com. TTDÆs Tel: 1-480-926-1680.
Thursday - March 7, 2019
TTD's Breakout Stocks
Stock Market Overview
Total Buy Breakouts so far today - 2
Quality of Breakouts - Below Average
Stocks Screened - 12,234
Bull side - Bulls be conservative as breakout list low and market now in a pull back.
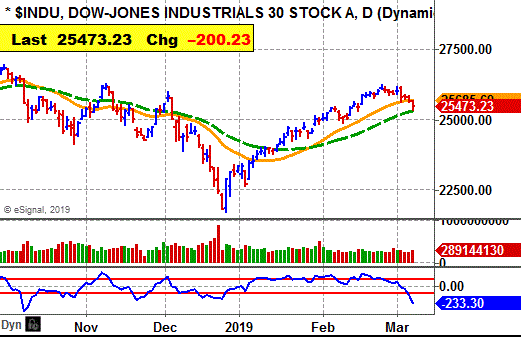
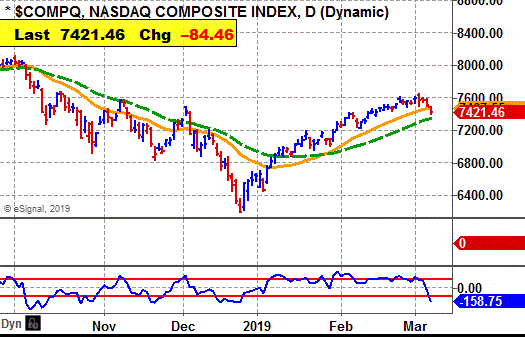
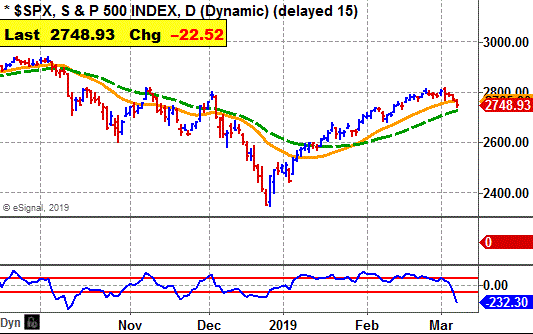
Stock market - Daily Market averages are now bearish. The weekly and monthly averages are still holding bullish.
Comment - TTD suggests being cautious now as market is in a pull back.
See Latest Earnings Reports - A company that tops the Street's highest earnings estimate has potential to go higher. Earnings beats for Thursday - CLMT, KRP, LONE FLY and TGLS.
Stock Market Momentum
(Daily is based on a moving average)
|
Market (Daily) |
Market (Weekly) |
Market (Monthly) |
|
Dow - Bearish |
Dow - Bullish |
Dow - Bullish |
|
Nasdaq - Bearish |
Nasdaq - Bullish |
Nasdaq - Bullish |
|
S&P 500 - Bearish |
S&P 500 - Bullish |
S&P 500 - Bullish |
 Ticker Tape Digest's
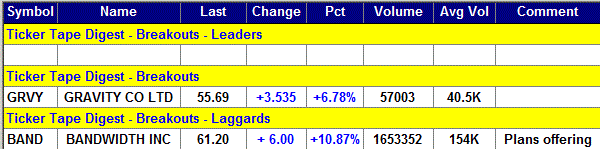
|
TTD's Quality Rating of Stock - GRVY - AVERAGE |
GRVY, based in Korea, produces and publishes on line games in Japan and Taiwan. Annual revenues: $141.6 million (South Korean Won). GRVY's stock drives higher Thursday and breaks out from a nine-week base. 
The move carries the stock to a new all-time high. The stock came public back in 2005.
GRVY traded 57,003 shares Thursday. Its average daily volume is 41,000 shares.
TTD sees more on the upside.
GRVY's breakout was triggered by favorable earnings for the fourth quarter versus the third quarter. That is the only comparison the company gave. 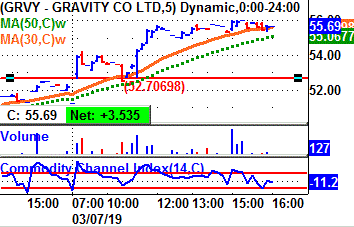
It said net for the fourth quarter rose 313% from the third quarter. Revenues jump 66%.
Tape Action
GRVY's tape action shows the recent block trades.
One can see the price for the blocks climbing from $51.49 in the prior session to as high as $56 late in the session.
A key bullish trade came in the morning when a block of 500 shares crossed the tape at$54.20.
That was up from the prior block trade at $52.25 on 7000 shares. 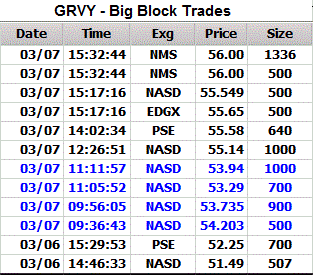
Business
GRVY produces online games and mobile games and other.
Its principal product includes Ragnarok Online, which is a multiplayer online role playing game.
The company offers over five online games, such as Ragnarok Online, Ragnarok Online II, Requiem, Dragonica (Dragon Saga) and R.O.S.E. Online, which are action adventure massive multiplayer online role-playing games .
It develops mobile games, including Ragnarok Online-Uprising: Valkyrie, Ragnarok Online Mobile Story and Ragnarok Violet, and also publishes mobile games licensed from third parties.
It provides games for game consoles and handheld game consoles, such as Nintendo DS, Xbox 360 and the PlayStation series.
Charts
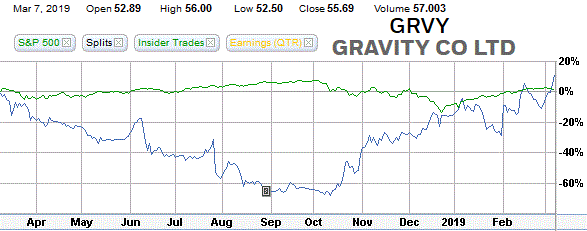
GRVY's 12-month performance chart shows the stock up 10% versus a 2% gain for the stock market.
Insider trading was not available.
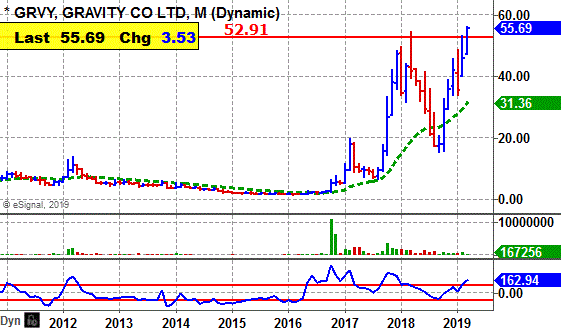
GRVY's long-term chart shows the stock as extremely volatile.
In 2015, GRVY was trading around $2 a share. The stock formed a bottom and then surged to a peak at $54 by March of 2018.
The stock then fell back to $15.44 in 2018, a steep drop. Since then, GRVY has shot ahead to an all-time high of $56.
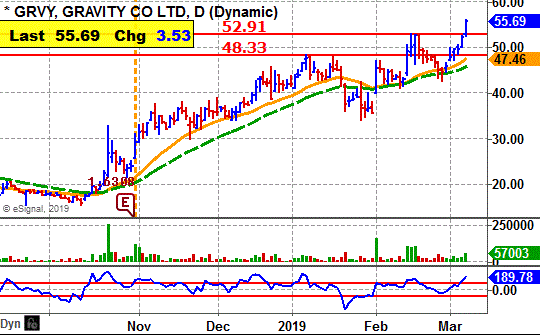 The stock is very volatile.
GRVY's daily chart shows the stock climbing from $20 back in October to a peak near $48 by January.
That was a big move.
The stock formed a cup and handle base and broke out in February briefly. The stock faded back.
TTD set up a breakpoint zone. Thursday, GRVY clears the zone.
GRVY's CCI momentum indicator is solidly bullish.
Earnings Outlook
There are no analysts following the stock and no earnings projections.
Net for the fourth quarter is expected to be 314% and revenues should be up 66%.
No annual results for forecast was given regarding 2018 results. Also, no projections were made for 2019.
Strategy Opinion: TTD is targeting GRVY for a move to $64 within the next few months. A protective stop can be placed near $47.
Intermediate-Term Rating: Average.
Suitability: Aggressive Bulls.
TTD's special research of Stock's Prior Performance:
Probability - Breakout Success - Extremely Bullish - GRVY scored some massive gains off some of its recent breakouts. The stock is in a long-term up trend now.
Probability - Earnings Response - Bearish - GRVY rose one time after the past 4 earnings reports when there was a significant change in price.
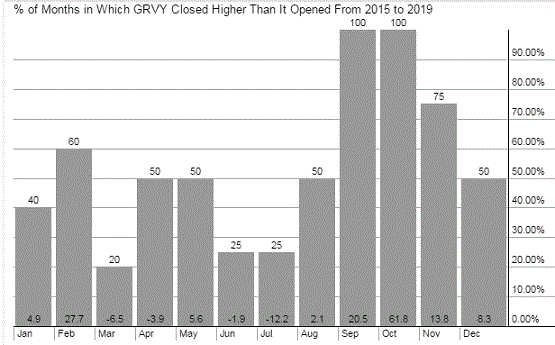
Probability: Seasonal Success - Bearish. - GRVY averaged a loss of 6.5% in March and a loss of 3.9% in April the past several years.
Stock's Prior Performance After A Breakout
|
Stock's % Change from Breakout to peak - prior to cut below 50-day M/A. |
Date of Breakout |
Break point Price |
Stocks Price Peak after Breakout - prior to cut below 50-day M/A |
Date Trade Closed |
|
24% |
12/14/2018 |
38.29 |
47.55 |
1/7/2019 |
|
29% |
12/15/17 |
38.25 |
49.29 |
1/3/2018 |
|
515% |
9/13/2017 |
10.68 |
49.29 |
1/3/2018 |
|
136% |
1/18/2017 |
7.62 |
18.01 |
2/27/2017 |
(In actual trading, entry and exit points could vary depending on broker execution.
Also, ideal are breakouts to a new 52-week high or better, perhaps all-time highs.)
Stock's Long-term Chart
Stock's Performance Chart with Quarterly Earnings Markers vs. S&P 500
Insider Buying in Green - Insider Selling in Red
Stock's Monthly Seasonal Performance Chart - Past 5 Years
Showing % Months UP and % Change
| TTD's Breakout Profile Rating Gravity Co. Ltd. (GRVY) |
| TTD Check List | Bullish | Bearish | Neutral |
| Near 52-week High | YES | ||
| Volume | YES | ||
| Tick Volume | YES | ||
| Price Trend - Daily | YES | ||
| Price Trend - Long Term | YES | ||
| Price Daily Spread | YES | ||
| Base Structure | YES | ||
| Base - A-D | YES | ||
| Earnings-Quarterly | YES | ||
| Earnings-Long Term | YES | ||
| Earnings Outlook | YES | ||
| Industry Group | YES | ||
| Prior Breakout Success | YES | ||
| Fund Sponsorship | YES | ||
| Total Score | 13 | 0 | 1 |
Charts of Selected Breakout Stocks
|
TTD's Quality Rating of Stock - BAND - BELOW AVERAGE |
Ticker Tape Digest provides a list of potential breakout stocks from our screen of companies that will show some of the strongest earnings gains. One of the best ways to play these stocks is to study the list and then place a stop buy order to catch the stock on the breakout.
One can take either a full position on the breakout if they are aggressive, or scale-in looking to add to the stake later if they are conservative. TTD's premarket breakout watch list gives you a great opportunity "to be prepared for the next key breakout stock just before it happens." The list will be updated daily and the screen monthly.
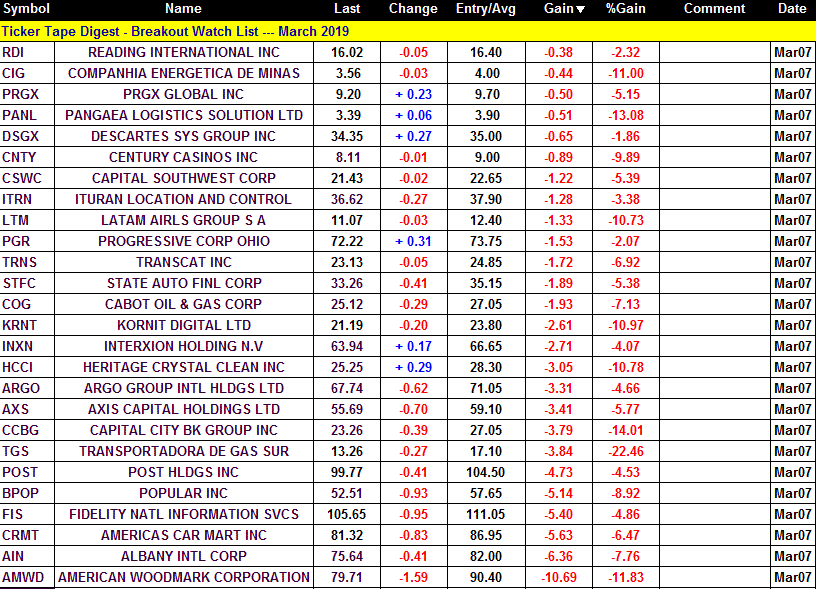
Guide: Symbol=Ticker, Name=Corporate name, Entry is the buy price to enter on the breakout, Last=prior close, Change=change from last close to prior, Date=date of price of close etc, Gain in blue is price above breakpoint (entry), Gain in red is price below breakpoint (entry)., % Gain in blue is % over breakpoint (entry), Gain in red is % below breakpoint (entry)

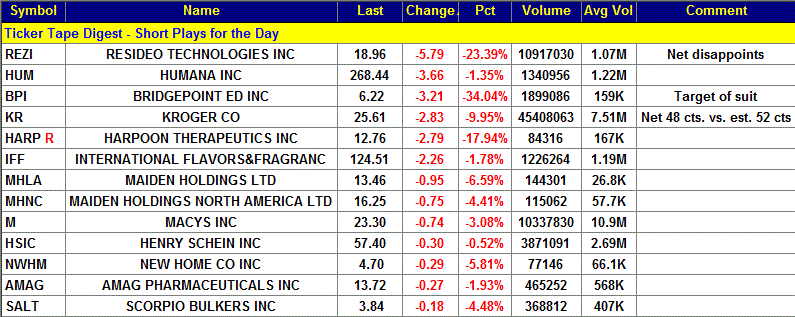
Ticker Tape DigestÆs Daily List of ōStocks To Sell or Sell Shortö ranks stocks well timed to be sold immediately based on daily trading. The list can be used as an alert to reduce current long-term positions.
Shorts from tape action so far today - 13
Stocks Screened - 12,234
Long-Term Environment for bears: Neutral.
Bear Side - Large list of shorts Thursday as stock market falls sharply. Aggressive bears can be venturesome.
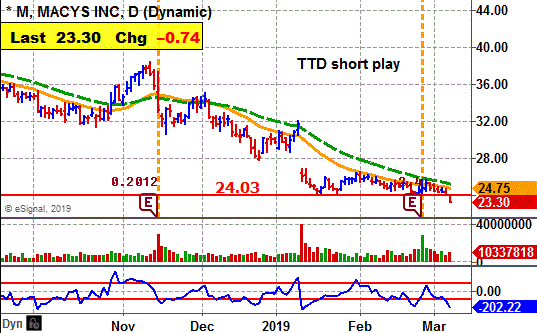
M, based in Cincinnati, Ohio, sells clothes and other items in its stores at Macy's, Bloomingdale's and Bluemercury. Annual revenues: $25.7 billion. M's stock falls sharply Thursday and undercuts key technical support. 
TTD sees more on the downside.
So far today, M is trading 10.3 million shares. Its average daily volume is 10.9 million shares.
M's stock fell sharply in the morning and undercuts key technical support.
The stock fell to $23.24 by noon. It then trended sideways the rest of the day. It was unable to rally. 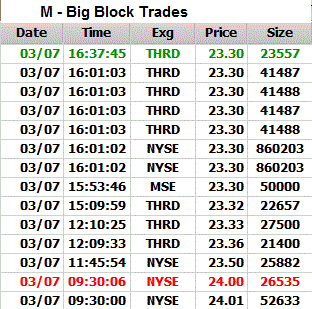
Tape Action
M's tape action shows the recent block trades.
One can see the price for the blocks falling from $24.01 in the morning to as low as $23.30.
A key bearish trade came in the morning when a block of 25,882 shares crossed the tape at $23.50.
That was down from the prior block at $24 on 26,535 shares.
Business
M sells men's, women's and children's clothes, cosmetics, home furnishings and consumer goods.
Its bank subsidiary, FDS Bank, provides credit processing, certain collections, customer service and credit marketing services.
The private label brands offered by the Company include Alfani, American Rag, Aqua, Bar III, Belgique, Charter Club, Club Room, Epic Threads, first impressions, Giani Bernini, Greg Norman for Tasso Elba, Holiday Lane and Home Design.
Earnings:
This fiscal year ending in January of 2020 analysts are forecasting a 25% drop in net to $3.11 a share from the $4.18 the year before.
Profits for the upcoming fiscal first quarter ending in April is expected to decline 23% to 37 cents a shaer from the 48 cents the year before.
Charts:
M's daily chart shows the stock cutting below key support and resuming its down trend.
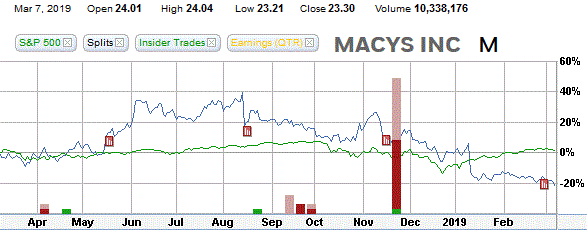
M's 12-month performance chart shows the stock down 20% versus a 2% gain for the stock market.
Insiders were recent buyers using stock options at $21 and in the market at $29 to $35 a share.
They were sellers at $25 to $36 a share.
Strategy Opinion: TTD is targeting M for a decline to $19 within the next few months, or sooner.
A protective stop buy can be placed near $24.50.
Suitability: Aggressive Bears.
TTD's probability research of Prior Performance:
Probability - Earnings Response - Bullish - M rose 5 times after the past 9 earnings reports when there was a significant change in price.
Probability: Seasonal Activity - Bearish. - M averaged a decline of 1.6% in March and a decline of 1.9% in April the past several years.
|
TTD's Quality Rating of Stock - M - BELOW AVERAGE |
Stock's Performance Chart with Quarterly Earnings Markers vs. S&P 500
Insider Buying in Green - Insider Selling in Red
TTD columnist Leo Fasciocco has covered the stock market for over 30 years. His articles appear in many publications. He has also been a speaker at the Money Show conferences. He has been on television and radio. He is author of many educational articles about stock investing and the book ōGuide To High-Performance Investing.ö

For information to subscribe to the Ticker Tape Digest Services call: Beverly Owen at 1-480-878-8381 or 480-704-3331
Distributed by Corona Publishing Enterprises. TickerTape Digest Inc. 1220 W. Sherri, Gilbert, Az. 85233.
TTD ōProfessional Reportö is available on the Web: $100 per month. Password needed. Published daily - around 20 times a month.
TTD Pro Report includes a Morning chart slide show of breakout stocks, a Midsession video-audio show with commentary on breakout stocks and shorts and a Final end of day overall report on breakout stocks for the session, short plays and accumulation plays. There are other features too such as Quick Trades and Long-term Plays.
TTD Daily Report is $39. It covers a Morning slide show of charts of stocks breaking out and a TTD end of day print report covering breakout stocks and shorts.
Credit cards accepted. Payable to Corona Publishing Enterprises.
(The information contained has been prepared from data deemed reliable but there is no guarantee of complete accuracy. Ticker Tape Digest Inc. is not affiliated with any broker, dealer or investment advisor. Nothing in this publication constitutes an offer, recommendation or solicitation to buy or sell any securities. Further research is advised. This report is copyrighted and no redistribution is permitted with out permission.)