![]()
|
|
|
Weekly - Bullish Conservative Investors - Go To TTD Long-Term Plays - Monday, March 9, 2020 |
|
Go to Video Show - "How to Make Money With Breakout Stocks |
|---|

By Leo Fasciocco -- TTD
Ticker Tape Digest presents its daily stock market report containing stocks to go long as Breakout Trades, Quick Trades, or Bargain Accumulation Trades.
We also feature stocks under Significant Accumulation that are poised to breakout.
|
Ticker Tape Digest's Daily schedule guide for TTD subscribers 1. Pre-market - check Breakout Watch List and Quick Trades. 2. Morning - (11:30 - 12 A.M.) - check breakout stocks tape and breakout chart slide show. 3. Midday (1 P.M.) check TTD Midsession Report and see market video show. 4. After close (4 P.M.) check final TTD Report for day. Trading Strategies Bullish Aggressive Investors Bullish - "Breakout Stocks" - ideally suited for bull markets and special situation stocks. Potential for large returns. (See Performance) Aggressive Investor Bullish- "Quick Trade Stocks" -ideally suited for entry into top performing issues looking for a small quick profit." (See Performance) Conservative Investors "Bargain Buy Trades for the Long Term." Ideally suited for entry into top performing big cap stocks on pullbacks within overall up trend.(See Performance) Bearish Aggressive Bearish Investors - "Breakdown Stocks" to Sell Short. Ideally suited for bear markets or market pull backs. Potential for large returns (See Performance) |
|---|
The TTD report also contains stocks to short as breakdown plays and as bargain (swing trade) shorts.
Investors should tend to try to go with a strategy that fits with the stock market's trend, unless there is a special situation play.
TTD's Breakout Stocks - Long are
most suitable for aggressive investors seeking ideal entry points into leading stocks, especially during bull markets. They can do extremely well in bull markets with gains of as much as several hundred percent. 
These stocks can also do extremely well during strong market rallies, or if they are in a industry group that is performing very well. They tend to have strong earnings outlooks and are near new-52 week, or all-time highs.
TTD Quick Trade Stocks - Long These are leading issues that have pulled back in recent days, but could move higher soon. They are most suitable for Aggressive Investors willing to trade short term. These stocks will do extremely well during market advances. They have about 74% win rate. During market rally sequences the win rate is even higher. The return is small 3% to 8% in just a few days.
TTD's Bargain Buy Trades - Long - Long Term. These are for conservative bullish Investors These long-term buys are ideally suited for entry into stocks on pull backs within overall up trend. These stocks can give a good return long-term especially during a bull market.
TTD also presents Stocks To Sell or Sell Short. These issues are suitable for aggressive investors willing to take short positions both as trades or for longer-term plays. These stocks will do very well during bear markets or market pull backs.
TTD's Bearish breakdown stocks to sell short. These issues have potential to fall sharply. They often show a technical breakdown and also some fundamental business problem such as weak earnings.
TTD's multi-media updates include a slide-show that presents charts and analysis at midsession. Some times TTD presents feature analysis on stocks and the market. TTD uses Windows Media Files. (WMV).
TTD also presents a "Breakout Watch List" that is up dated daily. This list consists of key stocks in position to breakout. A close watch of this list can put you in the stock just as it breaks out. A good idea is to study the list and be ready to move into a stock quickly as it hits its breakpoint.
TTD often suggests using stop buy orders to enter. It is very important to buy a breakout stock as close as possible to the breakpoint. The idea is to get "elbow room" if the stock should follow through to the upside. This is very important in being successful in making big money with breakout stocks.
It is also essential to have a stop loss strategy for all stocks in which positions are taken. Not every stock will work as expected. It is important for investors to "police" their portfolios and avoid getting trapped in any bad positions.
Quality rating of breakout Two key factors: 1 - Stock near all-time high in price or near a 52-week high. 2 - earnings growth current year is strong. The ideal play is a stock with an Above Average Quality Rating. The stock is near a new high and will have strong earnings. TTD's other ratings are Average and Below Average.
TTD also has special feature sections on Educational Tips on Investing.
To email Mr. Leo Fasciocco leo@tickertapedigest.com.
For service, email Beverly Owen owen@tickertapedigest.com. TTD’s Tel: 1-480-878-8381 or 480-704-3331.
Wednesday - March 11, 2020
TTD's Breakout Stocks
Stock Market Overview
Total Buy Breakouts Wednesday - 1
Quality of Breakouts - Average.
Stocks Screened - 12,234
Bull side - Only one breakout as stock market falls sharply.
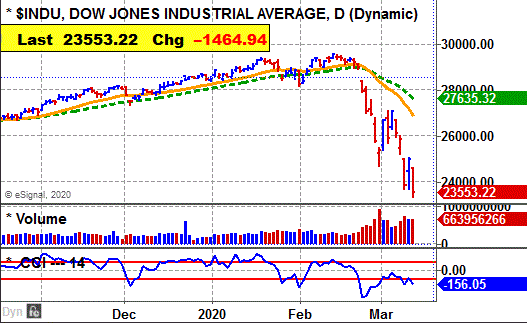
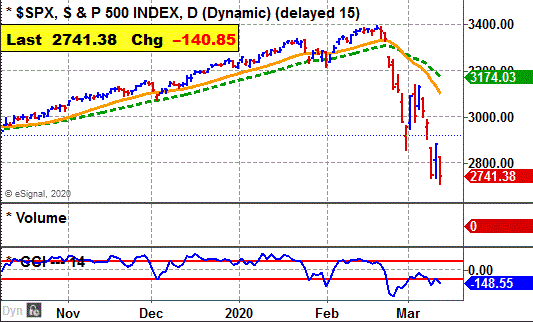
Stock market - Major averages resumed down trend and close near the low of the session. That is very bearish.
Comment - Market daily, weekly and Monthly bearish. Market is extended to the downside due to expectations of weak economy. Bulls be patient and selective waiting for a rally follow through move of over 1%.
See Latest Earnings Reports - A company that tops the Street's highest earnings estimate has potential to go higher. Key earnings beats - DQ.
Stock Market Momentum
(Daily is based on a moving average)
|
Market (Daily) |
Market (Weekly) |
Market (Monthly) |
|
Dow - Bearish |
Dow - Bearish |
Dow - Bearish |
|
Nasdaq - Bearish |
Nasdaq - Bearish |
Nasdaq - Bearish |
|
S&P 500 - Bearish |
S&P 500 - Bearish |
S&P 500 - Bearish |

 Ticker Tape Digest's
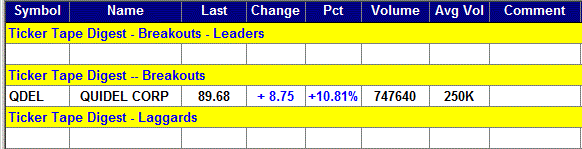
|
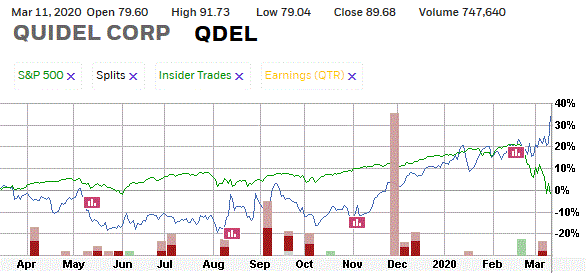
TTD's Quality Rating of Stock - QDEL - ABOVE AVERAGE |
QDEL, based in San Diego, Ca., makes diagnostic testing equipment. Annual revenues: $535 million. QDEL's stock drives sharply higher Wednesday and breaks out from its 10-week, flat base. 
The move carries the stock to a new all-time high. That is very bullish.
TTD sees more on the upside.
So far today, QDEL is trading a heavy 748,000 shares, triple its average daily volume.
QDEL's stock moved higher in the morning. It cleared its breakpoint line in the early afternoon. 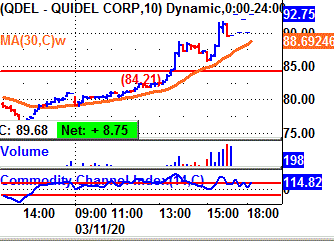
It pushed higher near the close to finish near its high for the session.
That is bullish considering the stock market closed near its low for the session.
Tape Action
QDEL's tape action shows the recent block trades.
One can see the price for the blocks climbing from $80.38 in the morning to as high as $91.41 late in the day.
A key bullish trade came in the afternoon when a block of 2,091 shares crossed the tape at $87.95.
That was up sharply from the prior block at $80.43 on 3,000 shares.
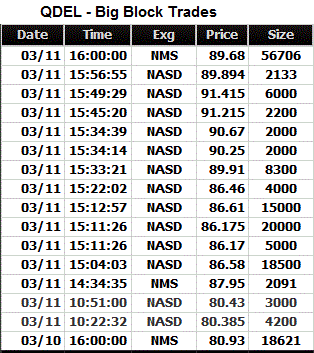 Near the close a big block of 56,706 shares crossed at $89.68.
That actually came on an up tick from a prior trade in the sequence at $89.49 on 300 shares.
Business
QDEL's diagnostic testing solutions are separated into four product categories: rapid immunoassays, cardiac immunoassay, specialized diagnostic solutions and molecular diagnostic solutions.
It products are sold to physician offices, hospitals, clinical labs, reference labs, universities, retail clinics, pharmacies and wellness screening centers.
Its diagnostic solutions detect and diagnosis infectious diseases, cardiovascular diseases, women's health, gastrointestinal diseases, autoimmune diseases, bone health and thyroid diseases.
Charts
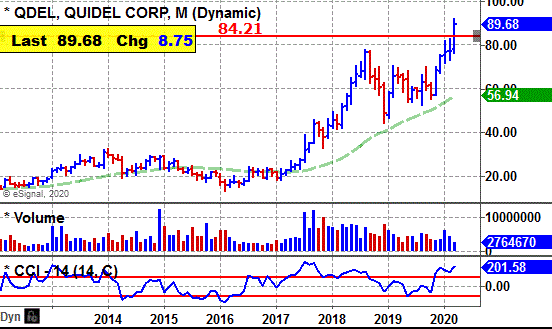
QDEL's 12-month performance chart shows the stock up 35% versus a 1% decline for the stock market
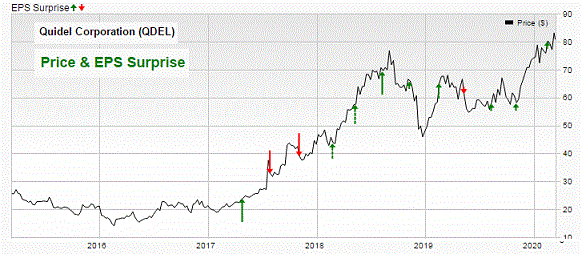
QDEL insiders were recent buyers at $15.40 $22.85 using stock options.
They were sellers at $68 to $79.
QDEL's long-term chart shows the stock making a bottom at $13 in 2016. The stock then drove sharply higher reaching a peak at $77 in 2018.
It then went into a consolidation, but has since broken out through resistance near $77. 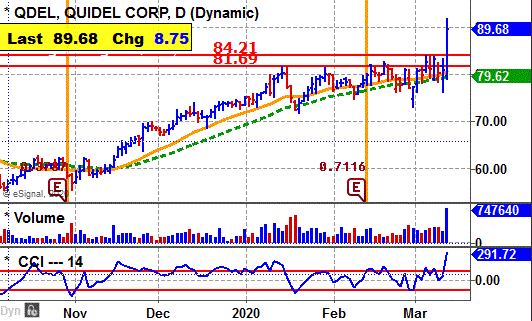
The stock ran up to the $84 area and then formed a tight flat base.
The breakout Wednesday is strong coming with a widening of the daily spread and strong volume.
The stock's CCI momentum indicator is strongly bullish.
Earnings Outlook
This year, analysts are forecasting a modest 3% rise in net to $3.06 a share from the $2.97 the prior year.
However, there is a good chance analysts will boost their estimates.
Looking out to 2021, the Street is calling for a 12% increase in net to $3.43 a share from the anticipated $3.05 this year.
Net for the upcoming first quarter should be up 4% to 95 cents a share from the 91 cents the prior year.
However, the highest estimate on the Street is at $1.16 a share.
Going out to the second quarter the Street expects a 14% rise in net to 41 cents a share from the 36 cents the prior year.
Strategy Opinion: TTD is targeting QDEL for a move to $105 within the next few months, or sooner.
A protective stop can be placed near $84
Intermediate-Term Rating: Average.
Suitability: Average Bulls.
TTD's special research of Stock's Prior Performance:
|
Breakout Success |
Bullish |
QDEL scored big gains off recent breakouts. |
|
Response to Net |
Bullish |
QDEL rose 7 times after 10 earnings reports. |
|
Seasonal Success |
Bullish |
QDEL avg. gain 10.5% in March., 3.5% in April prior years. |
|
Earnings Beats |
Bullish |
QDEL beat Street net estimate 14 times after 20 reports. |
Stock's Prior Performance After A Breakout
|
Stock's % Change from Breakout to peak - prior to cut below 50-day M/A. |
Date of Breakout |
Break point Price |
Stocks Price Peak after Breakout - prior to cut below 50-day M/A |
Date Trade Closed |
|
9% |
12/31/2019 | 73.57 | 80.36 | 1/14/2020 |
|
43% |
3/22/2018 | 49.51 | 71.02 | 7/23/2018 |
|
83% |
5/24/2017 | 23.74 | 43.55 | 9/19/2017 |
(In actual trading, entry and exit points could vary depending on broker execution.
Also, ideal are breakouts to a new 52-week high or better, perhaps all-time highs.)
Stock's Long-term Chart
Stock's Price Performance after Reporting Earnings
Stock's Performance Chart with Quarterly Earnings Markers vs. S&P 500
Insider Buying in Green - Insider Selling in Red
Charts of Selected Breakout Stocks
None

Ticker Tape Digest’s Daily List of “Stocks To Sell or Sell Short” ranks stocks well timed to be sold immediately based on daily trading. The list can be used as an alert to reduce current long-term positions.
Shorts from tape action for Thursday - 6
Stocks Screened - 12,234
Long-Term Environment for bears: Favorable.
Bear Side - Small list of shorts but some interesting plays. Stock market in a down trend with big earnings declines seen in certain industries. Bears be selective.
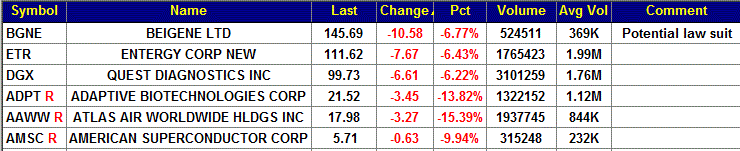
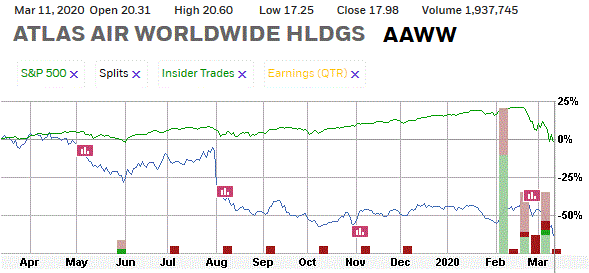
AAWW, based in Purchase, N.Y., provides outsourced aircraft and aviation operating services throughout the world. Annual revenues: $2.7 billion. AAWW's stock falls sharply Wednesday and undercuts key technical support. 
So far today, AAWW is trading a heavy 1.9 million shares, double its average daily volume of 844,000 shares.
TTD sees more on the downside.
TTD highlighted AAWW as a short at our midsession video show on the Web Wednesday.
AAWW's stock moved lower in the morning and undercut technical support. 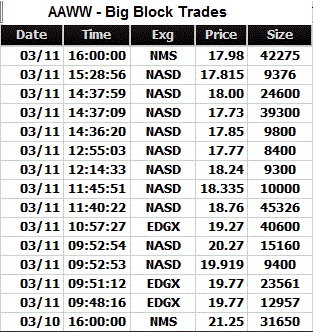
It continued south and touched an intraday low of $17.25 in the early afternoon.
The stock lifted slightly in the late afternoon.
Tape Action
AAWW's tape action shows the recent block trades.
One can see the price for the blocks falling from $21.25 in the prior session to as low as $17.73.
A key bearish trade came in the morning when a block of 12,957 shares crossed the tape at $19.77.
That was down from the prior block the day before at $21.25 on 31,650 shares.
Business
AAWW services Africa, Asia, Australia, Europe, the Middle East, North America and South America through contractual service arrangements.
They include those through which it provides aircraft to customers including crew, maintenance and insurance.
The company operates 749 freighters and provides customers a range of 747, 777, 767, 757 and 737 aircraft for domestic, regional and international cargo and passenger use. Its subsidiaries include Atlas Air, Inc. and Southern Air, Inc.
Earnings:
AAWW's results for the first quarter should show a loss of 2 cents a share compared with a profit of 98 cents the prior year.
With the slowdown in the economy, the loss could be greater. The lowest estimate is at a loss of 4 cents a share.
For the year, analysts have been forecasting a 27% increase in net to $6.65 a share from the $5.24 the prior year.
However, that estimate could come down due to the slow economy.
Charts:
AAWW's daily chart shows the stock cutting sharply below support. It did have a breakout last month, but that failed.
AAWW's 12-month performance chart shows the stock down 60% versus a 1% decline for the stock market.
Strategy Opinion: TTD is targeting AAWW for a decline to $14 within the next few months, or sooner. A protective stop buy can be placed near $19.40.
Suitability: Aggressive Bears.
TTD's Stock Probability research of Prior Performance:
|
Response to Net |
Bearish |
AAWW rose 7 times after 15 earnings reports. |
|
Seasonal Success |
Bearish |
AAWW lost 5% in March, lost 0.1% in April in prior years. |
|
Earnings Beats |
Bullish |
AAWW beat Street estimate 14 times after 20 reports. |
|
TTD's Quality Rating of Stock - AAWW - BELOW AVERAGE |
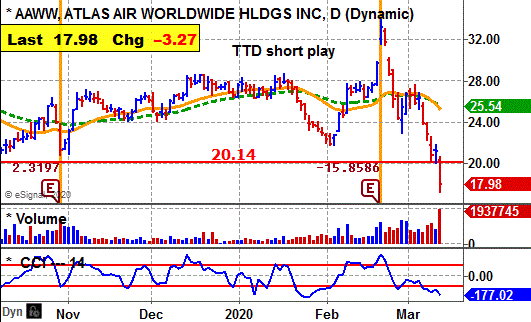
Stock's Performance Chart with Quarterly Earnings Markers vs. S&P 500
Insider Buying in Green - Insider Selling in Red
TTD columnist Leo Fasciocco has covered the stock market for over 30 years. His articles appear in many publications. He has also been a speaker at the Money Show conferences. He has been on television and radio. He is author of many educational articles about stock investing and the book “Guide To High-Performance Investing.”

For information to subscribe to the Ticker Tape Digest Services call: Beverly Owen at 1-480-878-8381.
Distributed by Corona Publishing Enterprises. TickerTape Digest Inc. 1220 W. Sherri, Gilbert, Az. 85233.
TTD “Professional Report” is available on the Web: $100 per month. Password needed. Published daily - around 20 times a month.
TTD Pro Report includes a Morning chart slide show of breakout stocks, a Midsession video-audio show with commentary on breakout stocks and shorts and a Final end of day overall report on breakout stocks for the session, short plays and accumulation plays. There are other features too such as Quick Trades and Long-term Plays.
TTD Daily Report is $39. It covers a Morning slide show of charts of stocks breaking out and a TTD end of day print report covering breakout stocks and shorts.
Credit cards accepted. Payable to Corona Publishing Enterprises.
(The information contained has been prepared from data deemed reliable but there is no guarantee of complete accuracy. Ticker Tape Digest Inc. is not affiliated with any broker, dealer or investment advisor. Nothing in this publication constitutes an offer, recommendation or solicitation to buy or sell any securities. Further research is advised. This report is copyrighted and no redistribution is permitted with out permission.)