![]()
Daily - Bullish Investors - Go To TTD Pre-Market Opening Breakout Watch List -Monday, March 12, 2018
|
|
Daily - Bullish Investors - Go To TTD Pre-Market Opening Breakout Watch List -Monday, March 12, 2018 |
|
Weekly - Bullish Conservative Investors - Go To TTD Long-Term Plays - Monday, March 12, 2018 |
|
|
Go to Video Show - "How to Make Money With Breakout Stocks |
|---|

By Leo Fasciocco -- TTD
Ticker Tape Digest presents its daily stock market report containing stocks to go long as Breakout Trades, Quick Trades, or Bargain Accumulation Trades.
We also feature stocks under Significant Accumulation that are poised to breakout.
|
Ticker Tape Digest's Daily schedule guide for TTD subscribers 1. Pre-market - check Breakout Watch List and Quick Trades. 2. Morning - (11:30 - 12 A.M.) - check breakout stocks tape and breakout chart slide show. 3. Midday (1 P.M.) check TTD Midsession Report and see market video show. 4. After close (4 P.M.) check final TTD Report for day. Trading Strategies Bullish Aggressive Investors Bullish - "Breakout Stocks" - ideally suited for bull markets and special situation stocks. Potential for large returns. (See Performance) Aggressive Investor Bullish- "Quick Trade Stocks" -ideally suited for entry into top performing issues looking for a small quick profit." (See Performance) Conservative Investors "Bargain Buy Trades for the Long Term." Ideally suited for entry into top performing big cap stocks on pullbacks within overall up trend.(See Performance) Bearish Aggressive Bearish Investors - "Breakdown Stocks" to Sell Short. Ideally suited for bear markets or market pull backs. Potential for large returns (See Performance) |
|---|
The TTD report also contains stocks to short as breakdown plays and as bargain (swing trade) shorts.
Investors should tend to try to go with a strategy that fits with the stock market's trend, unless there is a special situation play.
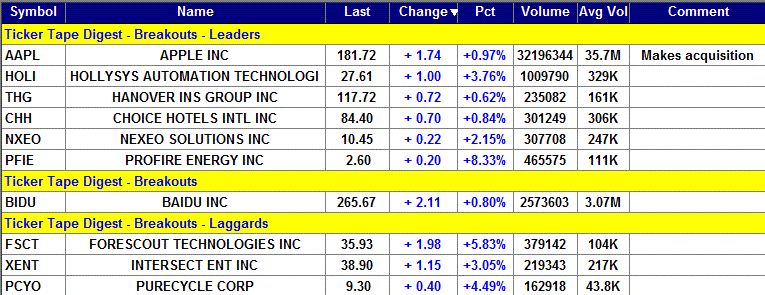
TTD's Breakout Stocks - Long are
most suitable for aggressive investors seeking ideal entry points into leading stocks, especially during bull markets. They can do extremely well in bull markets with gains of as much as several hundred percent. 
These stocks can also do extremely well during strong market rallies, or if they are in a industry group that is performing very well. They tend to have strong earnings outlooks and are near new-52 week, or all-time highs.
TTD Quick Trade Stocks - Long These are leading issues that have pulled back in recent days, but could move higher soon. They are most suitable for Aggressive Investors willing to trade short term. These stocks will do extremely well during market advances. They have about 74% win rate. During market rally sequences the win rate is even higher. The return is small 3% to 8% in just a few days.
TTD's Bargain Buy Trades - Long - Long Term. These are for conservative bullish Investors These long-term buys are ideally suited for entry into stocks on pull backs within overall up trend. These stocks can give a good return long-term especially during a bull market.
TTD also presents Stocks To Sell or Sell Short. These issues are suitable for aggressive investors willing to take short positions both as trades or for longer-term plays. These stocks will do very well during bear markets or market pull backs.
TTD's Bearish breakdown stocks to sell short. These issues have potential to fall sharply. They often show a technical breakdown and also some fundamental business problem such as weak earnings.
TTD's multi-media updates include a slide-show that presents charts and analysis at midsession. Some times TTD presents feature analysis on stocks and the market. TTD uses Windows Media Files. (WMV).
TTD also presents a "Breakout Watch List" that is up dated daily. This list consists of key stocks in position to breakout. A close watch of this list can put you in the stock just as it breaks out. A good idea is to study the list and be ready to move into a stock quickly as it hits its breakpoint.
TTD often suggests using stop buy orders to enter. It is very important to buy a breakout stock as close as possible to the breakpoint. The idea is to get "elbow room" if the stock should follow through to the upside. This is very important in being successful in making big money with breakout stocks.
It is also essential to have a stop loss strategy for all stocks in which positions are taken. Not every stock will work as expected. It is important for investors to "police" their portfolios and avoid getting trapped in any bad positions.
Quality rating of breakout Two key factors: 1 - Stock near all-time high in price or near a 52-week high. 2 - earnings growth current year is strong. The ideal play is a stock with an Above Average Quality Rating. The stock is near a new high and will have strong earnings. TTD's other ratings are Average and Below Average.
TTD also has special feature sections on Educational Tips on Investing.
To email Mr. Leo Fasciocco leo@tickertapedigest.com.
For service, email Beverly Owen owen@tickertapedigest.com. TTD’s Tel: 1-480-926-1680.
Monday - March 12, 2018
TTD's Breakout Stocks
Stock Market Overview
Total Buy Breakouts so far today - 10
Quality of Breakouts - Above Average.
Stocks Screened - 12,234
Bull side - Several leading stocks breakout, although some are not well known. Bulls can be venturesome.
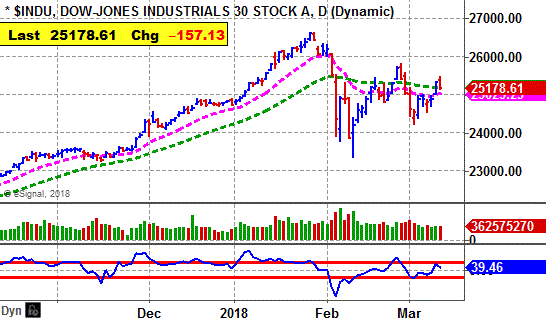
Stock market - Bullish. All major averages remain bullish in all time zones. However, the Dow daily is just holding.
Stock Market Momentum
(Daily is based on a moving average)
|
Market (Daily) |
Market (Weekly) |
Market (Monthly) |
|
Dow - Bullish |
Dow - Bullish |
Dow - Bullish, |
|
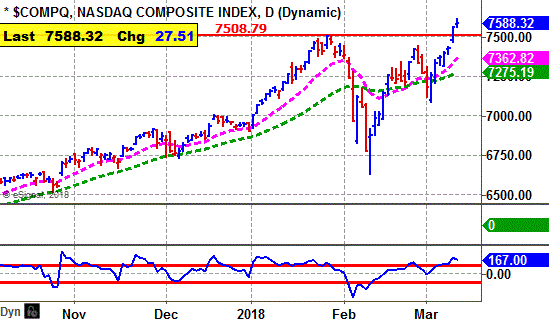
Nasdaq - Bullish |
Nasdaq - Bullish |
Nasdaq - Bullish |
|
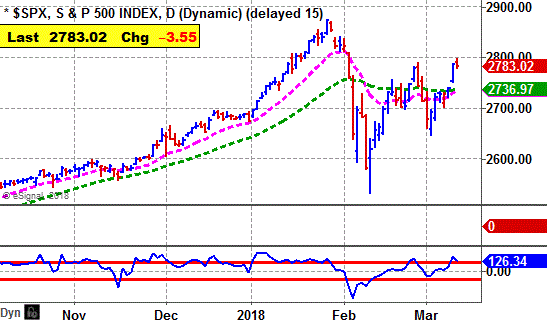
S&P 500 - Bullish |
S&P 500 - Bullish |
S&P 500 - Bullish |
Ticker Tape Digest's
|
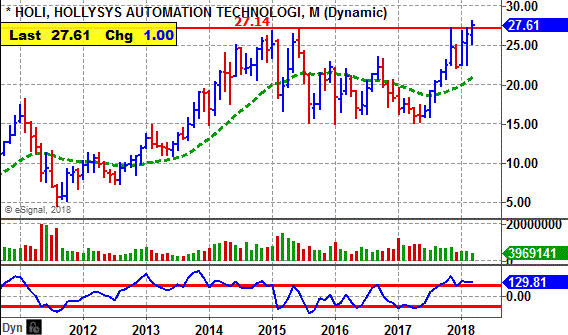
TTD's Quality Rating of Stock - HOLI - ABOVE AVERAGE |
HOLI, based in China, makes automation and control technology systems. Annual revenues: $432 million. HOLI breaks out Monday from an 8-week, cup-and-handle base. The move carries HOLI to a new all-time high. That is bullish. 
TTD highlighted HOLI as a breakout at our midsession video show on the Web Monday.
So far today, HOLI is trading 1 million shares, triple its average daily volume of 329,000 shares.
HOLI's stock rose sharply in the morning and cleared its breakpoint line.
The stock reached an intraday peak at $28.09 around noon.
The stock then gave ground in the afternoon, but held above its breakpoint line. 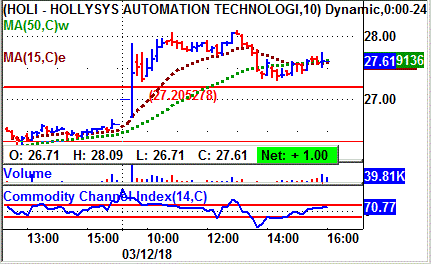
Tape Action
HOLI's tape action shows the recent block trades.
One can see the price for the blocks climbing from $26.61 in the prior session to as high as $28.
A key bullish trade came in the morning when a block of 8,882 shares (duplicated) crossed the tape at $26.71.
That was up from the prior block trade at $26.61 on 16,352 shares.
Near the close a block of 33,134 shares (duplicated) crossed the tape at $27.61 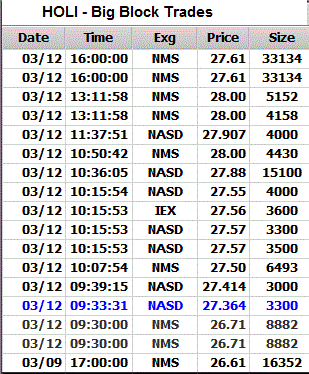
That came on an up tick from the prior trade at $27.60 on 100 shares.
Business
HOLI makes products for industrial automation, rail transportation and mechanical and electrical uses.
Its technologies are applied through its industrial automation solution suite.
They cover items like: Programmable Logic Controllers, Real-time Management Information Systems, Operator Training Systems, Advanced Process Control Packages and Safety Instrumentation Systems.
It serves the industrial, railway, subway, nuclear power, and mechanical and electronic industries in China, Southeast Asia, India, Europe and the Middle East.
Charts
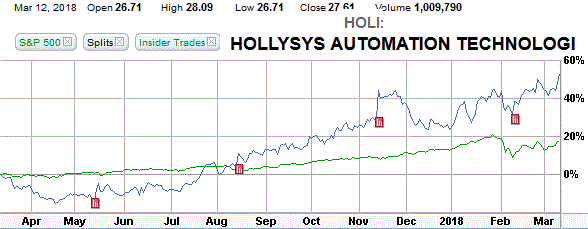
HOLI's 12-month performance chart shows the stock advancing 52% versus a 17% gain for the stock market.
Insider activity not available.
HOLI's long-term chart shows the stock making a bottom at $5 back in 2011. The stock then worked steadily higher reaching a peak at $27.05 by 2015.
The stock then pulled back and went into a long-term base. It broke out late last year and has now cleared all long-term upside resistance. That is bullish. 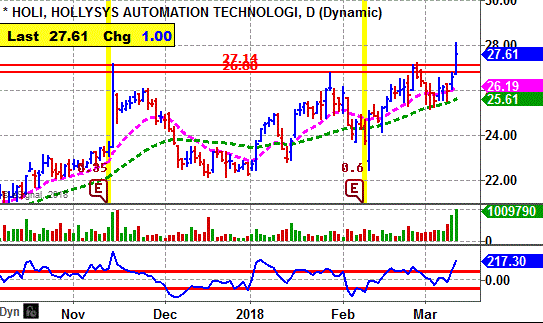
HOLI's daily chart show the stock climbing from $21 back in October to a peak near $27 by November.
The stock pulled back and formed a cup-and-handle base.
The stock ran into some resistance when it tried to breakout in February.
However, it regrouped and Monday breaks through a breakpoint zone to clear its base.
The stock showed a good pick up in volume. That is very bullish.
Earnings Outlook:
This fiscal year ending June analysts are forecasting a 58% surge in net to $1.83 a share from the $1.16 the year before.
The stock sells with a price-earnings ratio of just 15. TTD sees that as attractive for value-growth investors.
Looking out to fiscal 2019 ending in June, the Street is predicting a 19% increased in net to $2.17 a share from the anticipated $1.83 this fiscal year.
For the upcoming fiscal third quarter ending in March, analysts look for a 59% leap in profits to 35 cents a share from 22 cents the year before.
Then in the fiscal fourth quarter, analysts look for a 32% gain in net to 49 cents a share from the 37 cents the year before.
Strategy Opinion: TTD is targeting HOLI for a move to $34 off this breakout. A protective stop can be placed near $25.40.
Intermediate-Term Rating: Above Average.
Suitability: Average Bulls.
TTD's special research of Stock's Prior Performance:
Probability - Breakout Success - Strongly Bullish HOLI has scored some big gains on prior breakouts.
Probability - Earnings Response - Slightly Bearish. HOLI rose 5 times after the past 12 earnings reports when there was a significant change.
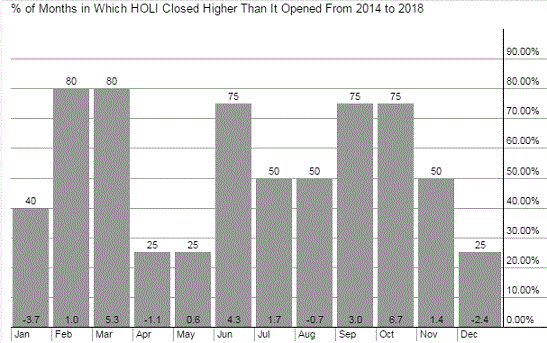
Probability: Seasonal Success - Bullish. HOLI rose an average of 5.3% in March but declined an average of 1.1% in April the past several years.
Stock's Prior Performance After A Breakout
|
Stock's % Change from Breakout to peak - prior to cut below 50-day M/A. |
Date of Breakout |
Break point Price |
Stocks Price Peak after Breakout - prior to cut below 50-day M/A |
Date Trade Closed |
|
49% |
7/19/2017 |
17.35 |
25.96 |
11/14/2017 |
|
25% |
7/13/2016 |
18.56 |
23.21 |
9/29/2016 |
|
5% |
10/31/2014 |
23.79 |
24.98 |
12/5/2014 |
|
27% |
9/6/2013 |
14.08 |
17.97 |
1/3/2014 |
|
16% |
12/24/2012 |
11.25 |
13.07 |
2/21/2013 |
(In actual trading, entry and exit points could vary depending on broker execution.
Also, ideal are breakouts to a new 52-week high or better, perhaps all-time highs.)
Stock's Long-term Chart
Stock's Performance Chart with Quarterly Earnings Markers vs. S&P 500
Insider Buying in Green - Insider Selling in Red
Stock's Monthly Seasonal Performance Chart - Past 5 Years
Showing % Months UP and % Change
| TTD's Breakout Profile Rating Hollysys Automation Technologies (HSS) |
| TTD Check List | Bullish | Bearish | Neutral |
| Near 52-week High | YES | ||
| Volume | YES | ||
| Tick Volume | YES | ||
| Price Trend - Daily | YES | ||
| Price Trend - Long Term | YES | ||
| Price Daily Spread | YES | ||
| Base Structure | YES | ||
| Base - A-D | YES | ||
| Earnings-Quarterly | YES | ||
| Earnings-Long Term | YES | ||
| Earnings Outlook | YES | ||
| Industry Group | YES | ||
| Prior Breakout Success | YES | ||
| Fund Sponsorship | YES | ||
| Total Score | 12 | 0 | 2 |
Charts of Selected Breakout Stocks
|
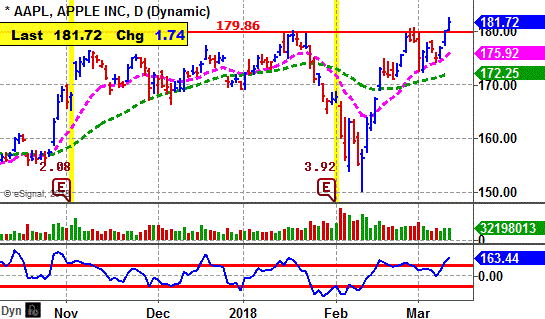
TTD's Quality Rating of Stock - AAPL - ABOVE AVERAGE |
|
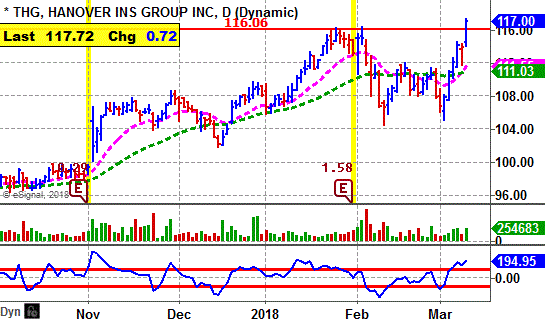
TTD's Quality Rating of Stock - THG - ABOVE AVERAGE |
|
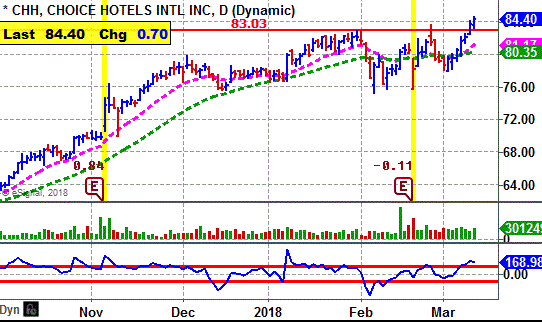
TTD's Quality Rating of Stock - CHH - ABOVE AVERAGE |
|
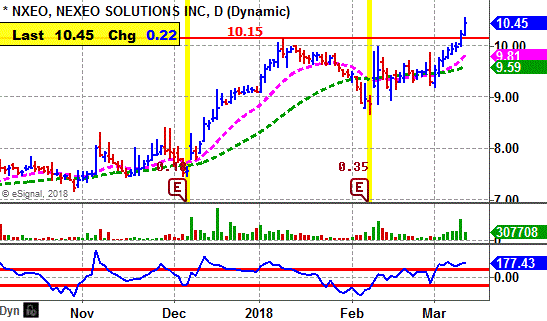
TTD's Quality Rating of Stock - NXEO - ABOVE AVERAGE |

Ticker Tape Digest’s Daily List of “Stocks To Sell or Sell Short” ranks stocks well timed to be sold immediately based on daily trading. The list can be used as an alert to reduce current long-term positions.
Shorts from tape action so far today - 2
Stocks Screened - 12,234
Long-Term Environment for bears: Unfavorable.
Bear Side - Small list of breakdown stocks Monday. Bears be conservative.
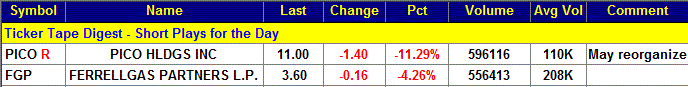
PICO, based in La Jolla, Ca., provides water storage services and also is involved in real estate. Annual revenues: $36 million. PICO's stock falls sharply Monday after being unable to arrange a reorganization of its operations. TTD sees more on the downside. 
So far today, PICO is trading a heavy 596,116 share, five times its average daily volume of 110,000 shares.
TTD highlighted PICO as a short at our midsession video show on the Web Monday.
PICO's stock fell steadily in the morning and touched an intraday low of $10.60. The stock then lifted slightly and trended sideways into the late afternoon. Near the close it lifted slightly. 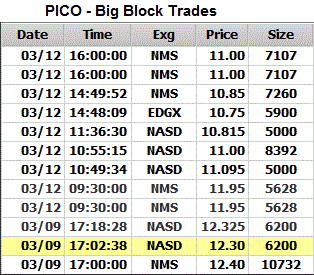
Tape Action
PICO's tape action show the recent block trades.
One can see the price for the blocks falling from $12.40 in the prior session to as low as $10.75 Monday.
A key bearish trade came in the morning when a block of 5,628 shares (duplicated) crossed the tape at $11.95.
That was down from the prior block late on Friday at $12.32 on 6,200 shares.
Business
PICO holds Vidler Water Company, Inc., which owns water resources and water storage operations in the southwest. It has operations in Nevada, Arizona, Colorado and New Mexico.
Its real estate operations are conducted through UCP, Inc., which is a homebuilder and land developer in California, Washington, North Carolina, South Carolina and Tennessee.
Earnings:
The company reported a loss of 5 cents a share for the fourth quarter. It has a profit of 2 cents a share for the year 2017.
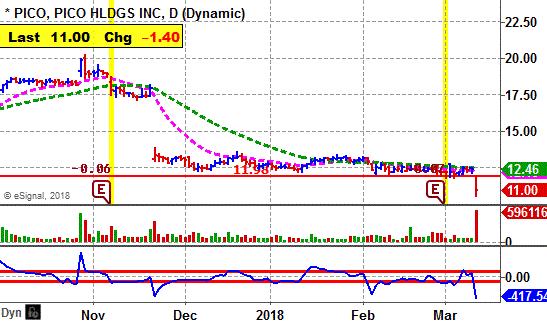
Charts:
PICO's daily chart shows the stock gapping lower and cutting below key technical support with a big increase in volume.
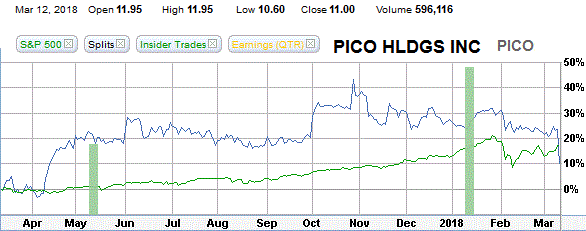
PICO's 12-month performance chart shows the stock up 10% versus a 17% gain for the stock market.
Strategy Opinion: TTD is targeting PICO for a decline to $8.80 within the next few months, or sooner. A protective stop buy can be placed near $11.60.
Suitability: Aggressive Bears.
TTD's special probability research of Prior Performance:
Probability - Earnings Response - Extremely Bearish. PICO rose just 1 time after the past 9 earnings reports when there was a significant change.
Probability: Seasonal Activity - Bullish. PICO rose an average of 1.9% in March and 3.2% in April the past several years.
|
TTD's Quality Rating of Stock - PICO - BELOW AVERAGE |
Stock Performance Chart with Quarterly Earnings Markers vs. S&P 500
Insider Buying in Green - Insider Selling in Red
TTD columnist Leo Fasciocco has covered the stock market for over 30 years. His articles appear in many publications. He has also been a speaker at the Money Show conferences. He has been on television and radio. He is author of many educational articles about stock investing and the book “Guide To High-Performance Investing.”

For information to subscribe to the Ticker Tape Digest Services call: Beverly Owen at 1-480-926-1680.
Distributed by Corona Publishing Enterprises. TickerTape Digest Inc. 1220 W. Sherri, Gilbert, Az. 85233.
TTD “Professional Report” is available on the Web: $100 per month. Password needed. Published daily - around 20 times a month.
TTD Pro Report includes a Morning chart slide show of breakout stocks, a Midsession video-audio show with commentary on breakout stocks and shorts and a Final end of day overall report on breakout stocks for the session, short plays and accumulation plays. There are other features too such as Quick Trades and Long-term Plays.
TTD Daily Report is $39. It covers a Morning slide show of charts of stocks breaking out and a TTD end of day print report covering breakout stocks and shorts.
Credit cards accepted. Payable to Corona Publishing Enterprises.
(The information contained has been prepared from data deemed reliable but there is no guarantee of complete accuracy. Ticker Tape Digest Inc. is not affiliated with any broker, dealer or investment advisor. Nothing in this publication constitutes an offer, recommendation or solicitation to buy or sell any securities. Further research is advised. This report is copyrighted and no redistribution is permitted with out permission.)